← Back to the plain-language case
Reported HbA1c intervention effect of 0.02% lies outside its own 95% confidence interval of 0.03%–0.14%
JAMA Netw Open (2023) · doi:10.1001/jamanetworkopen.2022.50375 · PMC9856961
Summary
This secondary analysis of a cluster randomized trial (Texas Sprouts, 16 elementary schools) reports that, compared with control schools, the intervention produced a "0.02% reduction in mean hemoglobin A1c (95% CI, 0.03%-0.14%; P = .005)". The 0.02 figure appears in the Key Points, and the full estimate with its CI and P value appears in the Abstract, the Results text and Table 3. In each of those three places the estimate 0.02 lies below the lower limit of its own 95% CI. The four reported quantities (estimate 0.02, SE 0.01, CI 0.03 to 0.14, P = .005) cannot all be correct. The CI and the P value agree with each other and point to an effect of about 0.085 percentage points. The estimate and SE agree with neither, and the unadjusted difference in group changes in Table 3 (−0.03 vs +0.06, so 0.09) agrees with the CI. HbA1c is the only outcome behind the paper's conclusion that the intervention "improved glucose control". The Limitations say the improvement "may not be clinically relevant", and then add that "even small reductions in HbA1c levels reflect clinical improvements in glucose control". The improvement the paper reports, 0.02, is about one quarter of the size the paper's other numbers imply.
What the paper reports
Key Points, "Findings":
In this secondary analysis of a cluster randomized clinical trial of 695 children, a gardening, nutrition, and cooking intervention resulted in reductions of 0.02% for hemoglobin A1c and 6.40 mg/dL for low-density lipoprotein cholesterol levels.
Abstract, "Results":
Compared with control schools, children from Texas Sprouts schools had a 0.02% reduction in mean hemoglobin A1c (95% CI, 0.03%-0.14%; P = .005)
Results, paragraph on intervention effects:
Compared with children in the control schools, children in the Texas Sprouts intervention had a 0.02% reduction in mean HbA1c (95% CI, 0.03%-0.14%; P = .005)
Table 3, HbA1c row. Columns: intervention children, preintervention mean (SE), change mean (SE) | control children, preintervention mean (SE), change mean (SE) | differences in changes, mean (SE) [95% CI] | P value, intervention effect. (The minus sign is a Unicode minus in the publisher's XML.)
Hemoglobin A1c, %c | 236 | 5.27 (0.01) | -0.03 (0.02) | 221 | 5.22 (0.01) | 0.06 (0.02) | 0.02 (0.01) [0.03 to 0.14] | .005
Table 3, footnotes b and c:
Generalized linear mixed models with the identity link for continuous variables were used to test differences in metabolic parameters between the intervention and the control estimates, with schools as clusters fixed for their intervention effect and children nested within schools.
Children at 5 intervention schools and 5 control schools were analyzed for hemoglobin A1c.
Methods, "Statistical Analysis":
Data were analyzed using SPSS statistical software version 28 (IBM) and a 2-sided type I error level of α = .05 was used as the threshold for statistical significance.
The conclusions that rest on this result. Abstract, "Conclusions and Relevance":
In this cluster RCT, Texas Sprouts improved glucose control and reduced low-density lipoprotein cholesterol in high-risk youth.
Discussion, first paragraph:
To our knowledge, Texas Sprouts was the first cluster RCT to show that a school-based gardening, nutrition, and cooking intervention can improve glucose control and lower LDL cholesterol in elementary schoolchildren.
Discussion, paragraph on body composition:
The current intervention resulted in reductions in LDL cholesterol and improvements in HbA1c, independent of changes in body composition.
Discussion, "Limitations":
Another limitation is that the improvement in HbA1c was rather small, albeit significant, and may not be clinically relevant. However, health care professionals believe that even small reductions in HbA1c levels reflect clinical improvements in glucose control.
Conclusions:
In conclusion, the present RCT showed that a school-based gardening, nutrition, and cooking intervention resulted in a small, albeit significant, improvement in glycemic control and a reduction in LDL cholesterol in predominately low-income and racially diverse elementary schoolchildren.
What the paper's own numbers show
Method. The paper states an identity-link linear mixed model, so each 95% CI should be symmetric about its estimate, with half-width equal to a fixed multiplier times the SE. To find that multiplier I divided the CI half-width by the SE in the other rows of Table 3. In the seven rows without other problems it is 2.138 to 2.206 (median 2.148, not 1.96), which matches a t reference with about 14 degrees of freedom. I therefore used t(14) for the HbA1c checks, and give normal-reference values as well. For each pair of reported quantities (estimate, SE, CI, P) I worked out what one implies for the other. As an independent check I took the unadjusted difference between the two group changes in Table 3, with an SE from the two group SEs. That SE ignores clustering, so it is only a rough check. Every number below is printed by recompute.py.txt.
| Quantity | Location | Reported | Recomputed from the paper's numbers |
|---|---|---|---|
| Estimate inside its own 95% CI? | Abstract, Results, Table 3 | 0.02 with CI 0.03 to 0.14 | No: 0.02 is 0.01 below the lower limit |
| Centre of the reported CI | Table 3 | (estimate) 0.02 | (0.03 + 0.14) / 2 = 0.085 |
| SE implied by the CI width | Table 3 | 0.01 | 0.055 / 2.145 = 0.026 (t14); 0.028 (normal) |
| CI implied by estimate 0.02 and SE 0.01 | Table 3 | 0.03 to 0.14 | −0.001 to 0.041 (t14); 0.000 to 0.040 (normal) |
| P implied by estimate/SE (0.02/0.01 = 2.0) | Abstract, Results, Table 3 | .005 | .065 (t14); .046 (normal) |
| P implied by the reported CI | Abstract, Results, Table 3 | .005 | .0051 (t14); .0025 (normal); .004 to .007 for df 8 to 20 |
| Estimate needed for P = .005 if SE were 0.01 | Table 3 | 0.02 | 0.033 (t14); 0.028 (normal) |
| Unadjusted difference in changes, intervention − control | Table 3 change columns: −0.03 (0.02) vs 0.06 (0.02) | 0.02 | −0.09, i.e. a reduction of 0.09; SE 0.028, CI −0.145 to −0.035 (ignores clustering) |
| Sign of the difference column | Table 3, rows with clear effects (e.g. LDL changes −8.43 vs −3.53, difference −6.40) | HbA1c CI 0.03 to 0.14 (positive) | In those rows the column reads intervention − control, so a reduction should be negative: −0.14 to −0.03, which matches −0.145 to −0.035 |
| Reported effect vs CI centre | Key Points, Abstract | 0.02 | The CI centre is 4.25 times larger; the unadjusted difference is 4.5 times larger |
Three things follow. First, the estimate cannot belong to the reported interval, so at least one of them is wrong. Second, the CI and the P value fit together: under the multiplier the rest of Table 3 implies, the CI gives P = .0051, against the reported .005. The estimate 0.02 and SE 0.01 fit neither of them, and they are also much smaller than the unadjusted difference. Third, the CI's sign does not follow the convention the table uses in its rows with clear effects. In those rows (fasting glucose, total, LDL and non-HDL cholesterol) the column reads intervention − control, so an HbA1c reduction would be negative. With the sign restored, the HbA1c CI matches the unadjusted difference closely (−0.14 to −0.03 against −0.145 to −0.035). The most coherent reading of the paper's own numbers is an HbA1c reduction of about 0.085 to 0.09 percentage points, with the estimate and SE cells in error. The exact model estimate cannot be rebuilt from these rounded summaries, because elsewhere in Table 3 the model estimates differ from the unadjusted differences by up to about 2 SEs (for example, non-HDL cholesterol −6.13 against −3.83, about 2.2 SE). In fasting insulin and HDL the model estimate and the unadjusted difference differ in sign (+0.61 against −0.42; +0.43 against −0.31), which fits adjustment gaps of that size. So the sign convention is inferred from the rows with clear effects, not shown for every row.
Related observations in Table 3. These do not change the HbA1c finding, but they bear on how the table can be read:
- The P column does not follow from the displayed estimates and CIs in 6 of the other 8 rows. Fasting glucose has CI 1.60 to 6.84, which excludes zero (P ≈ .004 from the CI, t14), but P = .13 is printed. LDL has CI −8.97 to −3.82 (P ≈ .0001), but P = .048 is printed. The total cholesterol, HOMA-IR, HDL and non-HDL rows differ in the same way. So the "P value, intervention effect" column may come from a different test than the displayed difference; the paper does not say which. Among the rows whose CI excludes zero (fasting glucose, total, LDL and non-HDL cholesterol, HbA1c), HbA1c is the only one whose printed P matches its CI; the P values for fasting insulin (.474 from the CI, .46 printed) and triglycerides (.395 from the CI, .39 printed) also match their CIs.
- The triglycerides interval (−15.42 to 6.47) is not centred on its estimate 1.52 (centre −4.475), and its half-width is 4.3 times the SE, against about 2.15 in the other rows. A symmetric interval with upper limit 6.47 would have lower limit −3.43.
Figure
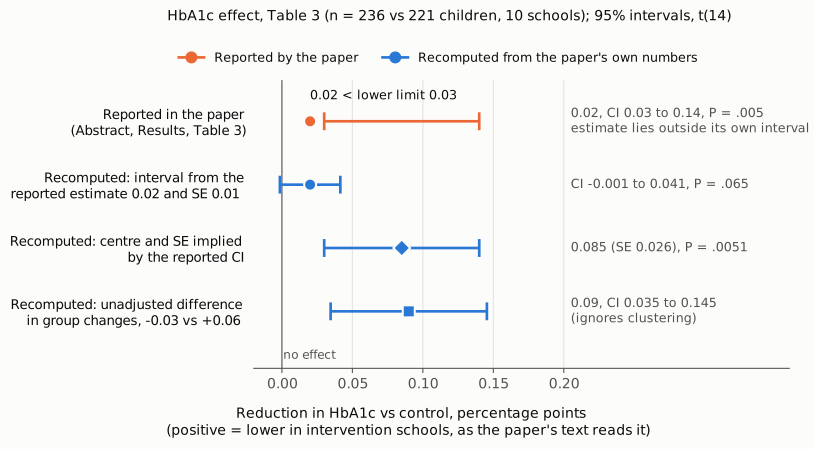
Figure 1. HbA1c effect in Table 3, on one axis in percentage points, with positive values meaning lower HbA1c in intervention schools than in control schools, as the paper's text reads "0.02% reduction (95% CI, 0.03%-0.14%)". The top row (orange) is what the paper reports: the dot (0.02) sits outside the bar (0.03 to 0.14). The blue rows are recomputed from the paper's own numbers. The second row is the interval that the reported estimate and SE would give (−0.001 to 0.041, P = .065), which does not match the reported CI or P. The third row is the centre and SE implied by the reported CI (0.085, SE 0.026, P = .0051), which matches the reported P. The fourth row is the unadjusted difference in the two group changes in Table 3 (−0.03 vs +0.06), shown as a reduction of 0.09 with CI 0.035 to 0.145. Its SE ignores clustering. The vertical line marks no effect. Intervals use the t(14) multiplier that the other rows of Table 3 imply.
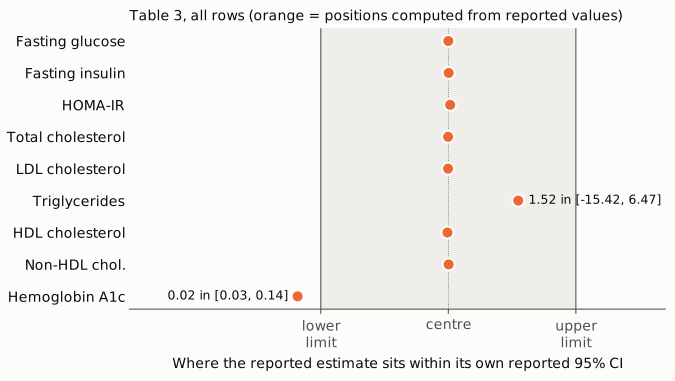
Figure 2. Where each reported estimate sits within its own reported 95% CI, for all nine outcomes in Table 3, scaled so that the lower limit is 0, the centre 0.5 and the upper limit 1. Seven rows sit at the centre, as an identity-link model requires. Triglycerides sits off-centre (its lower limit, −15.42, is not symmetric about 1.52). HbA1c is the only estimate outside its interval.
Why it matters
- It is a headline result. The HbA1c effect is one of two results in the Key Points and the Abstract. The 0.02 figure appears in all four places the result is stated (Key Points, Abstract, Results, Table 3), and the estimate-outside-CI combination appears in three (Abstract, Results, Table 3).
- It carries the glucose conclusion. The Abstract says the intervention "improved glucose control", and the Discussion calls this a first for a cluster RCT. Fasting glucose, insulin and HOMA-IR were reported as showing no effect, so this claim rests on HbA1c alone.
- It changes the size judgement. The Limitations call the HbA1c improvement "rather small, albeit significant, and may not be clinically relevant", and then add that "health care professionals believe that even small reductions in HbA1c levels reflect clinical improvements in glucose control". The Conclusions call it "small". The improvement the paper reports, and the only HbA1c effect size it states, is 0.02 percentage points. The paper's own CI, P value and group changes point to roughly 0.085 to 0.09 percentage points, about 4 times larger. Whether that larger effect is clinically meaningful is a separate question, but a reader weighing these size statements against the reported 0.02 is weighing them against a figure the other numbers do not support.
- It does not, on the evidence shown, reverse the direction or the significance. The CI, the P value and the group changes all indicate lower HbA1c in intervention schools relative to control. So the qualitative conclusion is not overturned by these numbers; the reported magnitude and the internal consistency of the result are.
- Readers using the published numbers would be misled about the size. A meta-analyst taking 0.02 (SE 0.01) would enter an effect about one quarter the size, with an SE less than half of what the CI implies.
Explanations considered
- Model-adjusted estimate vs raw difference. Footnote b says the difference comes from a mixed model, so it need not equal the unadjusted −0.09. That can explain why 0.02 differs from 0.09. It cannot explain an estimate lying outside its own interval, and in the other rows the model estimate always sits at the centre of its CI.
- Asymmetric or transformed interval. The model uses an identity link, so the interval should be estimate ± multiplier × SE, as it is in seven other rows. Any valid interval, symmetric or not, must contain its point estimate.
- Different subsample, time point or units. The Abstract, Results and Table 3 all describe the same 457 children (236 and 221) at 5 intervention and 5 control schools (footnote c; Results, "Subsample B"), over the same 9-month intervention period (Abstract, "Interventions": "1 school year long (9 months)"; Abstract, "Main Outcomes and Measures" and "Results": "postintervention (9 months)" and "(9-month)" blood draws; Limitations: "only 9 months long"). The "n = 8 schools" in the Table 3 header is explained by footnote c. HbA1c is in % throughout; the SI footnote converts % to a fraction and does not affect the comparison.
- Sign convention. The text calls the effect a reduction and prints a positive CI, which would fit a convention in which positive means reduction. But in the Table 3 rows with clear effects the difference column reads intervention − control (fasting glucose +4.22 from changes 6.53 vs 2.34; LDL −6.40 from −8.43 vs −3.53; also total and non-HDL cholesterol). In fasting insulin and HDL the model estimate and the unadjusted difference differ in sign, which fits the adjustment gaps of up to about 2 SE noted above, so the convention rests on the rows with clear effects. Under that convention the HbA1c interval should be negative. Its sign appears dropped, and with the sign restored it matches the unadjusted difference. A sign convention cannot put 0.02 inside [0.03, 0.14].
- One-sided test. The Methods state a 2-sided α = .05.
- Rounding. All values are printed to two decimals. An estimate just under 0.025 (say 0.0249) with a lower limit just over it (0.0251) would round to 0.02 and 0.03 under any rounding rule, but the interval would then reach only 0.0002 below the estimate and about 0.115 above it, which an identity-link interval cannot do. It would also leave the SE (0.01) and P (.005) unexplained. Rounding cannot reconcile the four numbers.
- Conversion artifact. The publisher's version of record shows the same HbA1c values as PMC: 0.02 in the Key Points, and 0.02 with CI 0.03 to 0.14 and P = .005 in the Abstract, Results and Table 3. In the XML the minus signs of other rows (LDL, total cholesterol, non-HDL) are kept, so the positive HbA1c interval is not a lost character.
- A correct value in the supplements. Supplement 1 is the trial protocol, which predates the HbA1c measurements, and Supplement 2 is the data sharing statement. Neither contains model output, so neither resolves the discrepancy.
Status
- Version of record. Checked on the publisher's full text (jamanetwork.com/journals/jamanetworkopen/fullarticle/2800162, reached from doi.org), PMC (PMC9856961) and the Europe PMC full-text XML. All show the same HbA1c values in the Key Points, Abstract, Results and Table 3.
- Supplements. Supplement 1 (jamanetwopen-e2250375-s001.pdf, trial protocol, 15 pages) and Supplement 2 (jamanetwopen-e2250375-s002.pdf, data sharing statement, 1 page) were read. Neither contains HbA1c results. Participant data are stated to be available on request after an approved proposal and a data sharing agreement.
- Corrections and comments. As of 2026-10-23 I found no correction, erratum, retraction or expression of concern. Crossref lists no update relations for the DOI, and a Crossref
updatesfilter returns no items. PMC and Europe PMC (PMID 36626172) list no correction or comment links. A web search found no erratum for this article. PubPeer refused automated access from this machine (HTTP 403 from both its API and its search page), so PubPeer could not be checked. - Sources. PMC article PMC9856961; publisher page https://jamanetwork.com/journals/jamanetworkopen/fullarticle/2800162; Supplements 1 and 2; Crossref; Europe PMC; trial registration NCT02668744 (as cited by the paper, not used for any number here).
Suggested correction
- Report the HbA1c intervention effect from the fitted model with an estimate, SE, 95% CI and P value that agree with one another. Correct the Key Points, Abstract, Results text and Table 3 together. Use the sign convention of the Table 3 rows with clear effects (intervention − control, so a reduction is negative) in the table, and state the magnitude in the text.
- If, as the CI and P value suggest, the effect is about 0.08 to 0.09 percentage points, revisit the Limitations and Conclusions statements that the improvement was small and "may not be clinically relevant", which accompany the reported 0.02.
- State which test the "P value, intervention effect" column reports. For fasting glucose, HOMA-IR, total, LDL, HDL and non-HDL cholesterol the printed P values do not follow from the displayed differences and CIs (for example, fasting glucose has a CI of 1.60 to 6.84 but P = .13). If the P values are wrong, the statements that there were "no intervention effects" on glucose and other lipids need to be revisited too.
- Check the triglycerides interval (−15.42 to 6.47), which is not symmetric about its estimate 1.52, and remove the minus signs printed on SEs, as in "−6.40 (−1.20)".