← Back to the plain-language case
Stated best schizophrenia classifier (RaEn, accuracy 0.8409) is contradicted by the paper's Table 5
Hum Brain Mapp (2022) · doi:10.1002/hbm.26129 · PMC9783493
Summary
The paper compares seven entropy measures, computed on three brain atlases, for linear-SVM classification of schizophrenia (SCHZ), bipolar disorder (BP) and adult ADHD against healthy controls. The Abstract names range entropy (RaEn) as the best measure for SCHZ. The Results (twice), Discussion and Conclusions say that RaEn "performs the best, where RaEn achieves an accuracy of 0.8409", and refer the reader to Table 5. Table 5 has no SCHZ accuracy of 0.8409. RaEn's SCHZ accuracies there are 0.6932, 0.8068 and 0.7841, and the highest SCHZ accuracy of any method is 0.8295, for sample entropy (SaEn) on the Brainnetome atlas. The value 0.8409 appears in Table 5 only as a specificity (Brainnetome RaEn and SaEn) and as one sensitivity (Power FuEn). As a result, the entropy ranking for SCHZ in the Abstract and Conclusions does not follow from the paper's own table, and the accuracy given for it is too high. The equivalent claims for ADHD and BP match Table 5.
What the paper reports
Abstract, final sentence:
The core brain regions that affect the classification are given, and DiffEn performed best on ADHD, SaEn for BP, and RaEn for SCHZ.
Results, "Classification comparison of different BENs", paragraph 1:
When a two-sample t-test was done, we did a classification task based on entropy values calculated using different ROI levels and the whole brain based on three different atlases. The result is presented in Tables 5 and 6. Table 5 shows the classification results at the whole-brain level from the three atlases studies. From the ADHD classification results, it can be seen that DiffEn performs the best, where DiffEn achieves an accuracy of 0.8548. Among the classification results of BP, SaEn performs the best, where SaEn achieves an accuracy of 0.8824. For the classification results of SCHZ, RaEn performs the best, where RaEn achieves an accuracy of 0.8409. Refer to Table 5 for details. Table 6 is based on the best results of a whole-brain classification in Table 5.
Results, same section, paragraph 2 (the SCHZ sentence is repeated):
For the classification results of SCHZ, RaEn performs the best, where RaEn achieves an accuracy of 0.8409. Please refer to Table 5 for details.
Results, same section, paragraph 3:
For SCHZ, this experiment uses RaEn (accuracy = 0.8409) as analysis weight. The top 10 key features (brain areas) of the classifiers corresponding to RaEn are: L_Frontal Pole, R_Superior Temporal Gyrus, posterior division, R_Angular Gyrus, R_Frontal Pole, L_Frontal Pole, L_Frontal Pole, R_Supramarginal Gyrus, posterior division, R_Supramarginal Gyrus, posterior division, R_Frontal Orbital Cortex, and L_Frontal Pole.
Discussion, paragraph 1, and Conclusions (identical sentence in both):
For the classification results of SCHZ, RaEn performs the best, where RaEn achieves an accuracy of 0.8409.
The Abstract sentence is repeated verbatim at the end of the Discussion subsection "The entropy method comparison".
A similar-looking ranking, "DiffEn, RaEn, and SaEn performed better in ADHD, SCHZ, and BP, respectively", is not part of this issue. It first appears in Results, "Multiscale entropy analysis", paragraph 1, directly after the multiscale-entropy group comparison (Table 4, Figure 7), and in the Discussion and Conclusions it again follows the multiscale-entropy result and precedes the classification sentences. It is a statement about multiscale-entropy group differences, which Table 5 neither supports nor contradicts.
Table 5 ("Whole-brain level: Classification result"), SCHZ rows. Columns are ApEn, DiffEn, DispEn, FuEn, PeEn, RaEn, SaEn. The auc rows repeat the acc rows exactly and are omitted here.
| Atlas | Row | ApEn | DiffEn | DispEn | FuEn | PeEn | RaEn | SaEn |
|---|---|---|---|---|---|---|---|---|
| Dosenbach | acc | 0.5682 | 0.6932 | 0.7159 | 0.7727 | 0.5682 | 0.6932 | 0.7159 |
| Dosenbach | Sensitivity | 0.5909 | 0.7955 | 0.5682 | 0.8636 | 0.5682 | 0.7273 | 0.6818 |
| Dosenbach | Specificity | 0.5455 | 0.5909 | 0.8636 | 0.6818 | 0.5682 | 0.6591 | 0.75 |
| Brainnetome | acc | 0.5568 | 0.7841 | 0.5909 | 0.7955 | 0.0909 | 0.8068 | 0.8295 |
| Brainnetome | Sensitivity | 0.4318 | 0.8182 | 0.5909 | 0.8636 | 0.0227 | 0.7727 | 0.8182 |
| Brainnetome | Specificity | 0.6818 | 0.75 | 0.5909 | 0.7273 | 0.1591 | 0.8409 | 0.8409 |
| Power | acc | 0.6023 | 0.75 | 0.5909 | 0.75 | 0.0568 | 0.7841 | 0.7386 |
| Power | Sensitivity | 0.5682 | 0.7727 | 0.5227 | 0.8409 | 0.0455 | 0.7955 | 0.7273 |
| Power | Specificity | 0.6364 | 0.7273 | 0.6591 | 0.6591 | 0.0682 | 0.7727 | 0.75 |
Bold marks the cells set in bold in the article's JATS XML. The table footnote reads:
Note: Bold values represent the relative best classification result.
Table 6 ("The top 10 with the most prominent weight of SVM in classification") labels the SCHZ block "SCHZ(FuEn)". Its ten regions are the same, in the same order, as the list that the Results text attributes to RaEn.
Materials and Methods, "Resting-state fMRI data" and "Classification analysis":
31 HC and 31 ADHD; 34 HC and 34 BP; 42 HC and 42 SCHZ remained for the current study.
Subjects were separated into stratified training (90%) and test (10%) subsets for each HC and disease dataset. ... This was repeated using the same 10 permutations of randomized training and testing splits to distribute overall performance metrics for BEN classification.
What the paper's own numbers show
Method. I transcribed the acc, sensitivity and specificity rows of Table 5 for all three disorders and three atlases (63 cells per row type) from the PMC-archived JATS XML, which matches the publisher's PDF. For each disorder I found the highest accuracy cell and compared it with the method and accuracy that the text names. As an internal check I confirmed that every SCHZ accuracy equals (sensitivity + specificity)/2. That is what balanced classes would give, and it shows the table's acc rows really are accuracies and not mislabelled specificities. I also searched the SCHZ block for every cell equal to 0.8409, and found the per-class denominators that the four-decimal sensitivities and specificities imply. Every number below is printed by recompute.py.txt.
| Quantity | Location | Reported | Recomputed from the paper's numbers |
|---|---|---|---|
| Best method for SCHZ and its accuracy | Abstract; Results ×2; Discussion; Conclusions | RaEn, 0.8409 | Highest SCHZ accuracy in Table 5 is SaEn, 0.8295 (Brainnetome); RaEn is second at 0.8068 |
| RaEn SCHZ accuracy, highest over atlases | Table 5 | text: 0.8409 | 0.8068 (Brainnetome); 0.6932 Dosenbach, 0.7841 Power |
| SCHZ accuracy cells equal to 0.8409 | Table 5 | — | none of 21 |
| Cells equal to 0.8409 in the SCHZ block | Table 5 | — | Brainnetome Specificity (RaEn and SaEn); Power Sensitivity (FuEn) |
| Brainnetome RaEn accuracy from its own sensitivity and specificity | Table 5 | 0.8068 | (0.7727 + 0.8409)/2 = 0.8068 |
| Brainnetome SaEn accuracy from its own sensitivity and specificity | Table 5 | 0.8295 | (0.8182 + 0.8409)/2 = 0.8295 |
| Largest |acc − (sens + spec)/2| over the 21 SCHZ cells | Table 5 | — | 0.00005 (rounding only) |
| Best SCHZ method within each atlas | Table 5 | RaEn bold in all three atlases (and FuEn in Dosenbach) | Dosenbach FuEn 0.7727; Brainnetome SaEn 0.8295; Power RaEn 0.7841 |
| Gap between claimed and tabulated accuracy | derived | 0.8409 | 0.0341 above RaEn's best; 0.0114 above the best of any method |
| ADHD best method (control) | Results; Table 5 | DiffEn, 0.8548 | DiffEn 0.8548 (Power): matches |
| BP best method (control) | Results; Table 5 | SaEn, 0.8824 | SaEn 0.8824 (Power): matches |
| Classifier used for the SCHZ weights | Results p3 vs Table 6 | text: RaEn; Table 6: "SCHZ(FuEn)" | the two labels disagree, and neither is the highest-accuracy SCHZ model (SaEn) |
| Per-class denominator implied by sensitivity/specificity cells | Table 5 vs Methods | n per group: ADHD 31, BP 34, SCHZ 42 | only n = 31 (ADHD), 34 (BP) and 44 (SCHZ) fit all cells for n from 20 to 60 |
| 0.8409 as a fraction | derived | — | 37/44 (as a specificity), or 74/88 (as an accuracy on 88 predictions); not k/42 (35/42 = 0.8333, 37/42 = 0.8810) |
The text's claims for ADHD and BP match the maximum of the corresponding accuracy rows exactly, so the same reading of Table 5 is correct for two of the three disorders. For SCHZ the stated accuracy equals the Brainnetome RaEn (and SaEn) specificity in Table 5. The stated winner, RaEn, is the best SCHZ method only on the Power atlas (0.7841). On the Brainnetome atlas SaEn is higher (0.8295 vs 0.8068), and on the Dosenbach atlas FuEn is higher (0.7727 vs 0.6932).
A secondary observation: every SCHZ sensitivity and specificity in Table 5 is a multiple of 1/44, while the Methods report 42 subjects per SCHZ group. The ADHD and BP cells are multiples of 1/31 and 1/34, which match those groups' sizes. This is consistent with pooling the test predictions of the 10 repeated splits described in the Methods: 10 stratified 10% test sets of 84 subjects hold about 42 to 45 predictions per class, depending on how the test-set size is rounded. But the Methods do not say how the splits were combined, and the ADHD and BP denominators equal their group sizes (31 and 34) while the SCHZ denominator does not. This is a reporting gap rather than a clear error.
Figure
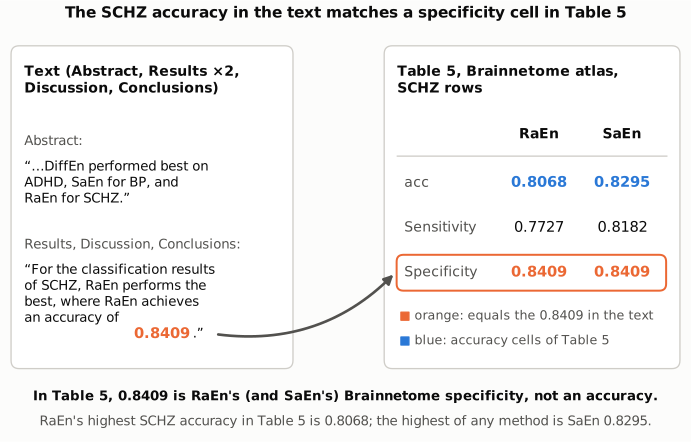
Figure 1. On the left are the Abstract and the Results/Discussion/Conclusions sentences that name RaEn as the best SCHZ classifier, with accuracy 0.8409 (orange). On the right is the Brainnetome-atlas SCHZ block of Table 5 for RaEn and SaEn. The accuracy cells (blue) are 0.8068 for RaEn and 0.8295 for SaEn. The value 0.8409 sits in the Specificity row for both methods. Each accuracy equals the mean of its sensitivity and specificity, so the 0.8409 in the text cannot be RaEn's Brainnetome accuracy as tabulated.
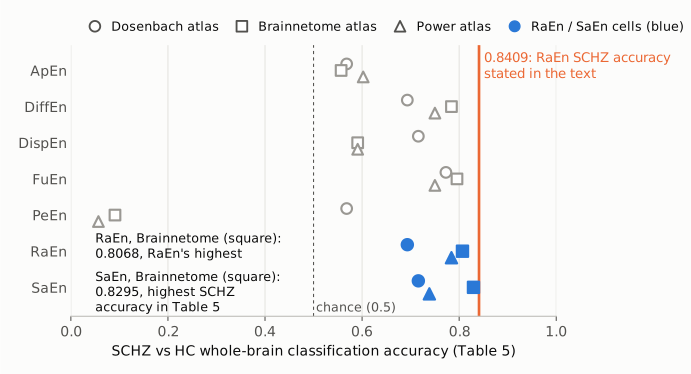
Figure 2. Every SCHZ accuracy in Table 5: seven entropy methods (rows) on three atlases (marker shape). The RaEn and SaEn cells are filled blue. The orange line is the 0.8409 that the text gives as RaEn's SCHZ accuracy, and the dotted line marks chance (0.5). No cell reaches the orange line. The highest SCHZ accuracy is SaEn on the Brainnetome atlas (0.8295), followed by RaEn on the same atlas (0.8068). The full 0–1 axis is shown. The two PeEn cells far below chance are as printed in Table 5.
Why it matters
The paper sets out to find which entropy measure is most suitable for each disorder. Its take-home message, in the final sentence of the Abstract and repeated in the Discussion, is a ranking: DiffEn for ADHD, SaEn for BP, RaEn for SCHZ. The Results, Discussion and Conclusions back the SCHZ part with the accuracy 0.8409. For SCHZ that ranking and the accuracy given for it are not what Table 5 shows. By the table, SaEn would be the best SCHZ measure overall (0.8295, Brainnetome), and RaEn's best accuracy is 0.8068. A reader choosing an entropy measure for SCHZ from the Abstract would pick a measure that the paper's own table places second. A reader citing the SCHZ accuracy would cite a number about 0.03 higher than any RaEn result in the table.
The Table 6 brain regions for SCHZ are affected too. The text says they come from the RaEn classifier with accuracy 0.8409, Table 6 says FuEn, and the text says Table 6 "is based on the best results of a whole-brain classification in Table 5", which for SCHZ would be SaEn. It is therefore unclear which classifier the ten listed SCHZ regions come from, and the paper's interpretation of those regions rests on that list.
The paper's other main findings do not depend on this number. These are the test–retest reliability analysis, lower multiscale entropy in all three disorders, the network-level group differences, and the ADHD and BP classification results, which match Table 5. Whole-brain SCHZ classification at about 0.80–0.83 accuracy remains supported by Table 5.
Explanations considered
- The acc and specificity rows of Table 5 are swapped or mislabelled. This does not account for the numbers. In every SCHZ column, acc equals (sensitivity + specificity)/2 to within rounding (largest difference 0.00005), which is what an accuracy with balanced classes must be. The rows are labelled correctly, and in Table 5 0.8409 is a specificity.
- A typographical error in the text (0.8068 meant). This could explain the number but not the method ranking. If the text meant 0.8068, RaEn would still not be the best SCHZ method, because SaEn reaches 0.8295 on the same atlas. A correction of the number alone would leave the Abstract's ranking unsupported.
- "Best" means best on one atlas, or best on average over atlases. This does not account for the claims. RaEn is the best SCHZ method on the Power atlas only, where its accuracy is 0.7841, not 0.8409. Averaged over the three atlases, FuEn is highest (0.7727), RaEn second (0.7614) and SaEn third (0.7613), and no average is 0.8409. The text applies the same wording ("performs the best, where ... achieves an accuracy of") to ADHD and BP, where it does mean the overall maximum of Table 5.
- 0.8409 is the accuracy of a different run, such as an ROI-level classification or another split, that is not shown in Table 5. This cannot be excluded from the published material. 0.8409 = 74/88 is an attainable accuracy for 88 pooled predictions. But each SCHZ sentence directs the reader to Table 5 ("Refer to Table 5 for details"), the paper reports no other classification results, and the Results say Table 6 is based on the best whole-brain results in Table 5. If such a run exists, the paper does not report it, so the claim cannot be checked.
- The bold marking in Table 5 defines "best". This does not resolve the conflict. The bold is on RaEn in all three SCHZ blocks, and also on FuEn in the Dosenbach block. On Brainnetome and Dosenbach it marks a value that is not the highest in its row (0.8068 < 0.8295; 0.6932 < 0.7727). The bold is consistent with the text's choice of RaEn, but not with the numbers in the table.
- A conversion or typesetting error in the archived copy. This is excluded. The PMC text, the Europe PMC JATS XML and the publisher's typeset PDF held in the PMC open-access bucket carry the same sentences and the same Table 5 values.
- The value is explained in a supplement. This is excluded: the article has no supplementary material (see Status).
Status
- Version of record. The Wiley landing page (via doi.org) returned HTTP 403 to automated access. I compared the PMC-archived text with the publisher's typeset PDF in the PMC open-access bucket (PMC9783493.1.pdf; 25 pages, cited as Hum Brain Mapp 2023;44(1):94–118, Table 5 on journal page 112) and with the Europe PMC full-text JATS XML. All three carry identical text and Table 5 values. The bold markings were read from the JATS XML. Every quotation above was confirmed verbatim against the PMC-archived text with
src/show.py. - Supplements. There is no supplementary material. The JATS XML has no supplementary-material element, the PMC open-access package holds only the figure images, and the Europe PMC supplementary-files endpoint returns only the article's figure images. The Data Availability Statement points to the public raw datasets (MSC, OpenNeuro ds000224; UCLA CNP, ds000030) and says the entropy code is available from the authors on request. No classifier outputs are deposited, so the published material cannot settle which SCHZ accuracy is correct.
- Corrections and comments. As of 2026-10-24 I found no correction, erratum, expression of concern or retraction. Crossref lists no update relations for the DOI. PMC and Europe PMC list no correction notices. PubMed (PMID 36358029) lists no comments or corrections. A web search for corrections or comments on the article found none. The PubPeer API refused automated access (HTTP 403), so PubPeer could not be checked directly.
- Sources. PMC article PMC9783493; Europe PMC full-text XML for PMC9783493; the publisher PDF in the PMC open-access dataset (s3://pmc-oa-opendata/PMC9783493.1/); Crossref; PubMed; Europe PMC.
Suggested correction
- In the Results (both paragraphs), the Discussion and the Conclusions, replace "RaEn performs the best, where RaEn achieves an accuracy of 0.8409" with the accuracy that Table 5 supports. Per Table 5, the best SCHZ accuracy is SaEn, 0.8295 (Brainnetome atlas), and RaEn's best is 0.8068 (Brainnetome atlas). If 0.8409 comes from an analysis not shown in Table 5, report that analysis and say how it differs.
- Revise the Abstract's final sentence, and its repeat at the end of the Discussion subsection "The entropy method comparison", so that the method named for SCHZ matches Table 5.
- Make the bold marking in Table 5 match its footnote, or redefine "relative best" in the footnote.
- State which SCHZ classifier produced the weights in Table 6 and the regions listed in the Results (the text says RaEn, Table 6 says FuEn), and make the label, the text and the accuracy quoted for that classifier agree.
- State how the test predictions of the 10 repeated splits were combined into the Table 5 sensitivities and specificities. The SCHZ cells imply 44 predictions per class, while the ADHD and BP denominators equal their group sizes (31 and 34).