← Back to the plain-language case
Reported p<0.001 for lower heart-failure hospitalisation and mortality does not follow from the paper's counts
Eur Respir J (2022) · doi:10.1183/13993003.02276-2021 · PMC9535117
Summary
The abstract and Results report that heart-failure hospitalisation (1.2% vs 1.9%) and non-COVID-19 mortality (0.3% vs 0.5%) among patients with pulmonary arterial hypertension (PAH) were lower in March–May 2020 than in the same period of 2019, with p<0.001. The underlying counts are printed in the paper: 23 of 1922 vs 36 of 1967 hospitalisations, and 6 of 1922 vs 10 of 1967 deaths. With the tests the Methods name (chi-squared or Fisher's exact), these give p = 0.11 to 0.12 for hospitalisation and p = 0.34 to 0.45 for death. The same p<0.001 is printed for add-on therapy among hospitalised patients (15/23 vs 15/36), which recomputes to p = 0.08 to 0.11. These are the comparisons behind the "paradox" in the title, the abstract's results sentence and the Conclusions. None of them reaches conventional significance, let alone p<0.001.
What the paper reports
All quotations are verbatim from the PMC-archived text and match the typeset PDF.
Abstract, Results:
Less systematic activities were converted into more effective remote interfacing between clinicians and PAH patients, resulting in lower rates of hospitalisation (1.2% versus 1.9%) and related death (0.3% versus 0.5%) compared with 2019 (p<0.001).
Results, "Downsizing of systematic activities in PAH", first paragraph (the two cohorts):
Systematic activities for 1922 PAH patients between March 1 and May 1, 2020, were compared with those for 1967 PAH patients managed in the same period in 2019.
Results, "Withdrawal of in-person-directed medical management and outcomes", first paragraph:
The hospitalisation rate for heart failure in patients treated between March 1 and May 1, 2020, was 1.2%, which was significantly lower than that in the equivalent period in 2019 (1.9%; p<0.001). This corresponds to a 36.1% reduction in hospitalisation for heart failure, from 36 patients in 2019 to 23 patients in 2020. Additionally, patients during the COVID-19 outbreak were less likely to receive elective sequential add-on therapy compared with the equivalent period in 2019 (n=24, 1.2% versus n=97, 5.0%; p<0.001), while higher rates were observed for sequential add-on therapies in patients hospitalised for heart failure (n=15, 65.2% versus n=15, 41.6%; p<0.001) (figures 3 and 4).
Same section, second paragraph:
Finally, all cause mortality (not including COVID-19) was lower among PAH patients between March 1 and May 1, 2020, compared with the previous year (n=6, 0.3% versus n=10, 0.5%; p<0.001) (figure 3).
Methods, "Statistical analysis":
Two-group comparisons were done with unpaired, two-tailed t-tests for means if the data were normally distributed or with Wilcoxon's rank-sum tests if the data were not normally distributed. Chi-squared or Fisher's exact tests were used to analyse the categorical data.
Results, "Incidence of SARS-CoV-2 infection and outcomes":
while nine patients had a diagnosis of COVID-19, corresponding to an incidence of 0.46%. The latter patients were admitted to hospital and received noninvasive or invasive ventilation at any time during hospitalisation and all of them died
Discussion, second and fifth paragraphs:
The second unexpected finding to emerge from our study, and shown for the first time, is the low morbi-mortality rates in the PAH cohort despite the apparent toned-down level of care from the previous year.
However, this was paradoxically not the case for PAH, as evidenced by lower mortality rates compared with the same period of the previous year and even lower hospitalisation rates for right heart failure.
Conclusions:
Equally important, paradoxically less systematic activities encouraged more effective remote interfacing between clinicians and patients, allowing lower rates of hospitalisation for heart failure and mortality compared with the previous year, and potentially reducing the risk of patient infection.
What the paper's own numbers show
Method. For each comparison I built the 2 × 2 table from the counts printed in the Results, with the cohort sizes 1922 (2020) and 1967 (2019) as denominators, and applied the tests the Methods name. These are Fisher's exact test (two-sided) and Pearson's chi-squared test, with and without Yates' correction. I also ran a one-sided Fisher test in the direction the paper reports and a conditional Poisson test that compares the event counts directly. Every number below is printed by recompute.py.txt (Python, scipy).
| Quantity | Location | Reported | Recomputed from the paper's own numbers |
|---|---|---|---|
| Heart-failure hospitalisation, 2020 vs 2019 | Abstract; Results, "Withdrawal…" ¶1 | 1.2% vs 1.9%, p<0.001 | 23/1922 = 1.20% vs 36/1967 = 1.83%; Fisher p = 0.116, chi-squared p = 0.106 (Yates 0.138); one-sided Fisher p = 0.068 |
| Non-COVID-19 all-cause death, 2020 vs 2019 | Abstract; Results, "Withdrawal…" ¶2 | n=6, 0.3% vs n=10, 0.5%, p<0.001 | 6/1922 = 0.31% vs 10/1967 = 0.51%; Fisher p = 0.454, chi-squared p = 0.339 (Yates 0.481); one-sided Fisher p = 0.241 |
| Add-on therapy among patients hospitalised for heart failure | Results, "Withdrawal…" ¶1 | n=15, 65.2% vs n=15, 41.6%, p<0.001 | 15/23 = 65.2% vs 15/36 = 41.7%; Fisher p = 0.110, chi-squared p = 0.078 (Yates 0.134) |
| Elective sequential add-on therapy (for contrast) | Results, "Withdrawal…" ¶1 | n=24, 1.2% vs n=97, 5.0%, p<0.001 | 1.25% vs 4.93%; Fisher p = 1.4 × 10⁻¹¹; consistent with p<0.001 |
| Risk ratio 2020/2019, heart-failure hospitalisation | derived | not reported | 0.65 (95% CI 0.39 to 1.10) |
| Risk ratio 2020/2019, non-COVID-19 death | derived | not reported | 0.61 (95% CI 0.22 to 1.69) |
| 2019 count needed for Fisher p<0.001 against the 2020 count | derived | — | ≥ 25 deaths (reported 10) against 6; ≥ 53 hospitalisations (reported 36) against 23 |
| Deaths including the 9 COVID-19 deaths | derived (Results counts) | not reported | 15/1922 = 0.78% vs 10/1967 = 0.51%; risk ratio 1.54 (0.69 to 3.41); Fisher p = 0.321 |
| Reduction in heart-failure hospitalisation | Results, "Withdrawal…" ¶1 | 36.1% | (36 − 23)/36 = 36.1%; consistent |
| 2019 heart-failure hospitalisation rate | Abstract; Results | 1.9% | 36/1967 = 1.83%, which rounds to 1.8%; 36/1922 = 1.87% would round to 1.9% |
The descriptive figures are reproduced: the counts, the 36.1% reduction and the 2020 rates all agree with the text. What does not reproduce is the inference. Under every version of the stated tests, the hospitalisation and mortality differences have p-values between about 0.07 (one-sided) and 0.48. For deaths, a p<0.001 against 6 deaths in 2020 would need at least 25 deaths in 2019 rather than 10. For hospitalisation, it would need at least 53 hospitalisations rather than 36. The elective add-on comparison, which has larger counts and a fourfold difference, does give p<0.001. This shows the problem is confined to the comparisons with few events.
Figure
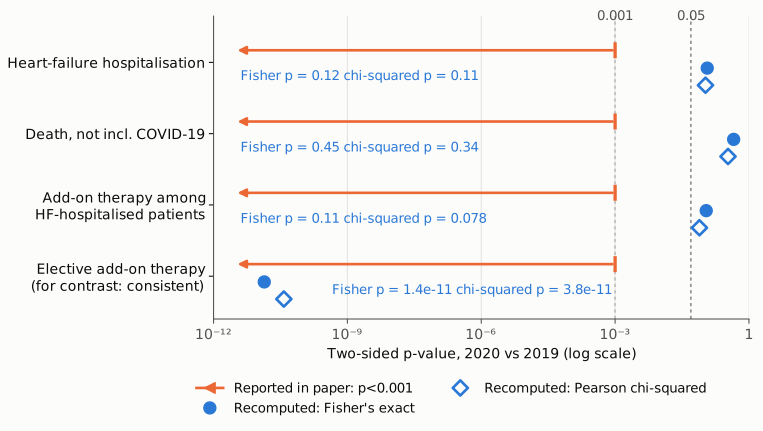
Figure 1. Two-sided p-values for the four 2020-vs-2019 comparisons that the Results report as p<0.001, on a log scale. Orange arrows show the reported value; p<0.001 is an upper bound, so each arrow starts at 0.001 and points towards smaller values. Blue markers show the p-values recomputed from the paper's printed counts with Fisher's exact test (filled circles) and Pearson's chi-squared test (open diamonds). Dashed reference lines mark 0.001 and 0.05. For heart-failure hospitalisation, non-COVID-19 death and add-on therapy among hospitalised patients, the recomputed p-values (0.08 to 0.45) lie above 0.05. The bottom row, elective add-on therapy (24/1922 vs 97/1967), is included for contrast: there the reported p<0.001 is consistent with the counts.
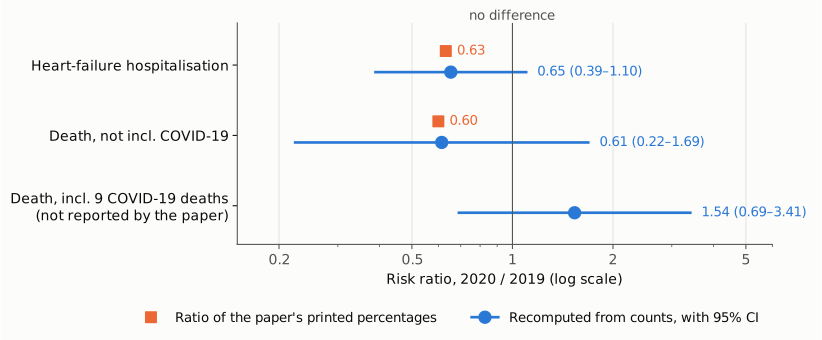
Figure 2. Risk ratios (2020 / 2019) on a log scale, with 95% confidence intervals (Katz log method) recomputed from the printed counts (blue). Orange squares are the ratios of the paper's printed percentages (1.2/1.9 and 0.3/0.5), which agree with the recomputed point estimates. Both intervals include 1 (thin vertical line, no difference). The bottom row counts the nine COVID-19 deaths reported in the Results together with the six non-COVID deaths. The paper does not report this comparison. Counted this way, deaths were more frequent in 2020 than in 2019 (15/1922 vs 10/1967), though not significantly so.
Why it matters
- The title's "paradox" rests on these comparisons. The paper presents lower hospitalisation and mortality despite reduced in-person care as "the second unexpected finding" (Discussion) and as being "paradoxically not the case for PAH" that reduced care worsened outcomes. Its only quantitative support is the pair of comparisons reported at p<0.001. With the paper's own counts, both are compatible with no change: the 95% intervals run from 0.39 to 1.10 for hospitalisation and from 0.22 to 1.69 for death.
- A causal and policy claim builds on them. The abstract and Conclusions attribute the lower rates to "more effective remote interfacing", and the Conclusions recommend that PAH patients be "prioritised within the Recovery Plan policy document for remote monitoring by dedicated tools". The case for remote monitoring may stand on other grounds. The statistical evidence of an outcome benefit cited for it, however, is not present in the data.
- The mortality comparison excludes COVID-19 deaths. This exclusion is disclosed. Counting all deaths among the 2020 cohort reverses the direction of the point estimate (0.78% vs 0.51%). A reader who took "related death (0.3% versus 0.5%) ... (p<0.001)" from the abstract could come away with a stronger and more favourable impression than the counts support.
- The finding has been repeated. An editorial commentary in the same journal (doi:10.1183/13993003.00796-2022) restates the 36.1% reduction in hospitalisations and the lower proportion of deaths without referring to their uncertainty.
- What is not affected. The large reductions in visits, tests, right heart catheterisations, new diagnoses and elective add-on therapy are not in question here. Those comparisons involve large counts, and where I checked one (elective add-on therapy) the reported p<0.001 is consistent.
Explanations considered
- A different denominator for 2020. Not able to explain it. Figure 3 describes the outcomes as those of "non-infected" patients. Using 1902 (excluding the 20 SARS-CoV-2-positive patients) or 1913 (excluding the 9 COVID-19 patients) as the 2020 denominator gives Fisher p = 0.455 for deaths and 0.117 to 0.118 for hospitalisation. Using 1922 for both years gives 0.454 and 0.115.
- A one-sided test. Not able to explain it. The Methods state two-tailed tests. Even one-sided in the reported direction, Fisher p is 0.241 (deaths) and 0.068 (hospitalisation).
- A test on event counts or rates rather than proportions. Not able to explain it. A conditional Poisson test of 6 vs 10 events gives p = 0.455, and of 23 vs 36 gives p = 0.119. A goodness-of-fit test on the counts alone gives 0.454 and 0.117.
- Treating the 2019 rate as a fixed reference. Not able to explain it. This is not one of the tests the paper names. A one-sample binomial test of the 2020 count against the 2019 rate gives p = 0.331 for deaths and p = 0.040 for hospitalisation, neither below 0.001.
- A paired (McNemar) analysis of overlapping cohorts. Not the stated analysis: the Methods describe unpaired comparisons, and the cohorts differ in size. For deaths, pairing cannot help, because a patient who died in 2019 cannot die in 2020. The discordant counts are therefore 6 and 10, and exact McNemar p = 0.454. For hospitalisation, McNemar p would fall below 0.001 only if at least 22 of the 23 patients hospitalised in 2020 had also been hospitalised in the same weeks of 2019. The paper reports nothing to suggest such an overlap.
- The p-value refers to a different comparison in the same sentence. Not supported. In the Results, each p<0.001 is attached to its own comparison in parentheses ("(1.9%; p<0.001)", "(n=6, 0.3% versus n=10, 0.5%; p<0.001)"). No grouping of these counts into a joint test is described, and no p-value for such a test is reported.
- A text-conversion artifact. Ruled out. The typeset ERJ PDF (11 pages) carries the same "p<0.001" in the abstract and at each Results location, as does the publisher's one-page shareable PDF. The counts in the text agree with the bar heights in Figure 3.
- A correction already issued. None found (see Status).
- Side observations, not part of the main finding. The 2019 hospitalisation rate printed as 1.9% matches 36/1922 (1.87%) rather than 36/1967 (1.83%, which rounds to 1.8%). "n=15, 41.6%" is 15/36 = 41.67%, which rounds to 41.7%. The COVID-19 incidence of 0.46% is 9/1922 = 0.468%, which rounds to 0.47%. "The majority of the in-person visits were registered for patients in WHO functional classes III–IV (n=158, 66.7%)": 158/250 is 63.2%, while 66.7% corresponds to 158/237. None of these changes a conclusion.
Status
- Version of record. The publisher's page (publications.ersnet.org, reached through doi.org) returned HTTP 403 to automated requests. I checked the typeset ERJ PDF instead (
2102276.full.pdf, 11 pages, the copy deposited in a university repository, arts.units.it). Its abstract, Results and Methods carry the passages quoted above word for word, including each "p<0.001". The publisher's one-page shareable abstract PDF, the Europe PMC full-text XML and the PMC HTML give the same text. Every quotation was checked verbatim against the PMC-archived text withsrc/show.py. - Supplements. The Europe PMC supplementary bundle holds an appendix listing the network members and their affiliations (4 pages), the shareable abstract (which repeats p<0.001) and the figure images. None contains outcome data or statistical output that could account for the reported p-values.
- Corrections and comments. As of 2026-10-24 I found no correction, erratum, expression of concern or retraction.
src/known.pyreturns no Crossref update relations and no PMC or Europe PMC notices. The Crossref record has empty update-to, updated-by and relation fields. The PubMed record (PMID 35301247) lists only a "Comment in" link to the editorial commentary (PMID 36202406), which does not discuss the p-values. The PubPeer API returned no record (HTTP 404) for the DOI, and a web search for the title together with "PubPeer" found no thread. - Sources. PMC article PMC9535117; typeset ERJ PDF; Europe PMC full text and supplementary files; editorial commentary PMC9924355 (doi:10.1183/13993003.00796-2022); Crossref; PubMed; PubPeer; https://doi.org/10.1183/13993003.02276-2021.
Suggested correction
In the abstract, replace
resulting in lower rates of hospitalisation (1.2% versus 1.9%) and related death (0.3% versus 0.5%) compared with 2019 (p<0.001).
with wording that reports the comparisons as not statistically significant, for example
with numerically lower rates of hospitalisation for heart failure (23/1922, 1.2% versus 36/1967, 1.8%; p=0.12) and of non-COVID-19 death (6/1922, 0.3% versus 10/1967, 0.5%; p=0.45) compared with 2019.
In the Results, replace "(1.9%; p<0.001)" with "(1.8%; p=0.12)" and drop "significantly". Replace "(n=6, 0.3% versus n=10, 0.5%; p<0.001)" with "(n=6, 0.3% versus n=10, 0.5%; p=0.45)" and "(n=15, 65.2% versus n=15, 41.6%; p<0.001)" with "(n=15, 65.2% versus n=15, 41.7%; p=0.11)" (Fisher's exact test, two-sided). The Discussion and Conclusions statements that hospitalisation and mortality were lower, and the attribution of this to remote interfacing, would need to be reworded to say that no significant difference was observed. The authors may also wish to report all-cause mortality including the nine COVID-19 deaths (15/1922, 0.8% versus 10/1967, 0.5%) next to the non-COVID figure, and to check the 66.7% given for the share of in-person visits in WHO functional classes III–IV (158/250 = 63.2%).