← Back to the plain-language case
By the paper's own model, odds of death rise 2.7-fold per decade of age, not 11-fold
Brain (2022) · doi:10.1093/brain/awab466 · PMC9336587
Summary
The abstract and Results state that ageing by 10 years increased the odds of death in intensive care after traumatic brain injury 11-fold. The same Results sentence gives the model's estimate as an odds ratio of 1.10 per year of age (95% CI 1.05–1.16), and the authors' R output in the supplement gives the coefficient behind it: 0.09914 log-odds per year. In a logistic model, odds ratios compound over years, so 10 years corresponds to exp(10 × 0.09914) = 2.70 (95% CI 1.59–4.57). The 11-fold figure, which lies far outside that interval, equals 10 × 1.104: the per-year odds ratio multiplied by 10 rather than raised to the 10th power. The direction and significance of the age effect are unchanged, but the abstract overstates its size about fourfold, and Fig. 5D plots the same overstated value.
What the paper reports
Abstract:
A warmer mean brain temperature was associated with survival (P = 0.035), however, and ageing by 10 years increased the odds of death 11-fold (P = 0.0002).
Results, section "Daily brain temperature rhythms predict patient survival":
Applying a generalized linear mixed model (Fig. 5), we found that lack of a daily TBr rhythm, or an age increase of 10 years, increased the odds of death in intensive care 21-fold and 11-fold, respectively (odds ratio for death with rhythm 0.05; 95% CI 0.004–0.57, P = 0.016 and odds ratio for death with ageing by 1 year 1.10; 1.05–1.16, P = 0.0002).
Materials and methods, "Statistical analysis", the model behind both statements:
For the final analysis of patient data, a generalized linear mixed model for logit binomial distribution of patient outcome was chosen
where fixed effects include: Age (patient age in intensive care);
Fig. 5 legend:
(D) Odds of death in intensive care transformed from the data in A–C; the results for these three predictors are significant since the 95% CIs (double-ended error bars) do not include 1.
Fig. 5D itself (an image, read from the archived file awab466f5.jpg) has a row labelled "Age (per decade)" on a logarithmic "Odds of death" axis. Its marker sits at about 11, with a narrow interval.
Supplementary File016 (the authors' R code with its output) fits glmer(Outcome ~ Age +Sex + BrainMean +BrainRange +Daily + (1|Subject), ..., family=binomial) on 98 patients. Its data listing describes Age as "Patient age in years" (integer). It reports:
Age 0.09914 0.02696 3.677 0.000236 ***
exp(0.09914) # calculating Age odds for death [1] 1.104221
exp(c(0.0462984, 0.1519816)) [1] 1.047387 1.164139
What the paper's own numbers show
Method. In a logit-link model, the coefficient for age, β, is the change in log-odds per year. The odds ratio for a k-year difference is therefore exp(k × β) = (per-year odds ratio)^k, and its Wald 95% CI is exp(k × (β ± 1.96 × SE)). Rescaling age from years to decades multiplies β and SE by the same factor, so z and P do not change. I used the authors' unrounded coefficient and SE from Supplementary File016. As a check, I also used the rounded values printed in the Results, and the two agree. To read Fig. 5D, I calibrated its log x-axis from the six major tick marks on the axis line (80.07 px per decade; largest residual 0.24 px; the minor ticks at 2 and 3 fall within 0.2 px of where a log scale puts them). I then took the centre of the Age ring marker and its two interval end caps. Every number below is printed by recompute.py.txt.
| Quantity | Location | Reported | Recomputed from the paper's own numbers |
|---|---|---|---|
| Odds ratio per 1 year of age | Results | 1.10 (1.05–1.16), P = 0.0002 | exp(0.09914) = 1.104 (1.047–1.164); z = 3.677, P = 0.000236 (File016) |
| Internal consistency of the rounded per-year figures | Results | 1.10 (1.05–1.16), P = 0.0002 | P implied by the CI = 0.00018: consistent |
| Odds ratio per 10 years of age | Abstract; Results | 11-fold | exp(10 × 0.09914) = 2.70 |
| 95% CI per 10 years | not reported | — | 1.59–4.57 (from the rounded text: 1.63–4.41) |
| Per 10 years, from the rounded 1.10 | Results | — | 1.10^10 = 2.59; any value from 1.095 to 1.105 gives 2.48–2.71 |
| Per-year odds ratio that 11-fold over 10 years would need | derived | — | 11^(1/10) = 1.271, i.e. β = 0.240, 5.2 SE above the fitted β |
| Per-year odds ratio multiplied by 10 | derived | — | 1.10 × 10 = 11.00; 10 × 1.104 = 11.04 |
| Per-year CI multiplied by 10 | derived | — | 10.47–11.64 |
| "Age (per decade)" marker and interval | Fig. 5D | plotted, no number given | ≈11.1 (10.4–11.7) digitized; matches 10 × the per-year values, not 2.70 (1.59–4.57) |
| P per decade | Abstract | 0.0002 | unchanged by rescaling (z = 3.677): consistent |
| Stated / recomputed per 10 years | — | — | 11 / 2.70 = 4.1 (4.2 using 1.10^10) |
| Lack of a daily rhythm, fold increase in odds | Abstract; Results | 21-fold (OR 0.05; 0.004–0.57; P = 0.016) | 1/exp(−3.03024) = 20.7 (95% CI 1.76–243); P from the CI = 0.016: consistent |
| Mean brain temperature, OR per 1 °C | Results | 0.42 (0.18–0.94), P = 0.035 | exp(−0.87808) = 0.416, P = 0.035 (File016): consistent |
Only the 11-fold age figure, in the text and in Fig. 5D, disagrees with the model output. Every other odds ratio, interval and P value in this paragraph reproduces.
Figure
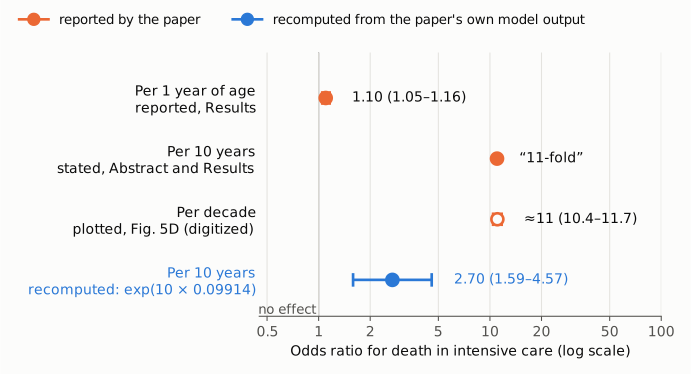
Figure 1. Odds ratios for death in intensive care on one logarithmic axis; the thin vertical line marks no effect (1). Orange: values the paper reports. These are the per-year odds ratio in the Results (filled; its interval of 1.05–1.16 is narrower than the marker), the "11-fold" per 10 years in the Abstract and Results (filled; no interval is given), and the "Age (per decade)" marker in Fig. 5D as digitized from the archived image (open ring, ≈11 with interval 10.4–11.7). Blue: the 10-year odds ratio recomputed from the authors' own coefficient, exp(10 × 0.09914) = 2.70, with its 95% CI of 1.59–4.57. The printed values lie well outside the recomputed interval.
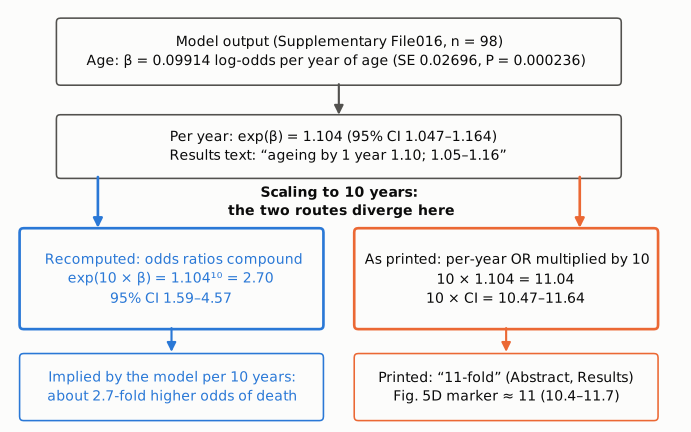
Figure 2. The arithmetic chain. Both routes start from the same model output and the same per-year odds ratio of 1.104. Compounding over 10 years (blue, left) gives 2.70 (1.59–4.57). Multiplying the per-year odds ratio and its interval by 10 (orange, right) gives 11.04 (10.47–11.64), which matches both the printed "11-fold" and the position and narrow interval of the Fig. 5D marker. All values are printed by recompute.py.txt.
Why it matters
- The abstract states the wrong magnitude. Age is one of the three outcome predictors whose effects the abstract reports. A reader of the abstract alone will take away an 11-fold rise in the odds of death per decade of age. The paper's model supports about 2.7-fold (95% CI 1.6–4.6).
- Fig. 5D shows the same overstated value. The legend presents panel D as the odds of death "transformed from the data in A–C". The age row is plotted at about 11 with an interval of roughly 10.4–11.7, both 10 times the per-year values. Its interval is therefore also misstated (correct: 1.59–4.57), although it still excludes 1.
- The comparison between predictors changes. As printed, lack of a daily rhythm (21-fold) and a decade of age (11-fold) look similar in size, a ratio of about 1.9. With the corrected age figure the ratio is 20.7 / 2.70 = 7.7. The paper's description of the rhythm as "one of the strongest single predictors of survival" is, if anything, strengthened.
- What is unaffected. The direction of the age effect (older patients at higher risk), its significance (P = 0.0002; rescaling does not change the test), the per-year odds ratio, the rhythm result in the title and the mean-temperature result are all unaffected. The statement that "Older TBI patients lacking a daily TBr rhythm are at greatest risk of death" still holds qualitatively.
Explanations considered
- Age entered per decade, or in other units. Not supported. The supplementary R listing describes
Ageas "Patient age in years" (integer values such as 57, 65, 62), the Methods define it as "patient age in intensive care" with no rescaling, and the Results label 1.10 as the odds ratio "with ageing by 1 year". If 1.10 were per decade, the 10-year figure would be 1.10, not 11. - Rounding of 1.10. Not able to explain it. The unrounded estimate, 1.104, gives 2.70. Every per-year value that rounds to 1.10 gives 2.48–2.71, and even the upper confidence limit, 1.164, gives only 4.57 over 10 years. Reaching 11 needs 1.271 per year, 5.2 standard errors above the estimate.
- The per-year estimate is the wrong number. Not supported. The per-year odds ratio, its CI and its P agree with each other (P from the rounded CI = 0.00018, against 0.0002 reported) and agree exactly with the R output in File016 (exp(0.09914) = 1.104221; CI 1.047387–1.164139; P = 0.000236).
- Probability rather than odds, or a different contrast such as oldest versus youngest. Not supported. Both statements say "odds" and "10 years", and Fig. 5D says "Age (per decade)". No other contrast is described.
- A different model or population. Not supported. The abstract, the Results sentence and Fig. 5D all refer to the same generalized linear mixed model on 98 patients, with the same P = 0.0002.
- A conversion or typesetting artifact. Not possible here. The publisher's version of record carries the same wording in the Abstract and Results, and the figure image plots the same value.
- Other fold changes computed the same way. No. The companion "21-fold" for lack of a rhythm was obtained correctly: File016 shows 1/0.04830404 = 20.7022. Only the age conversion reproduces as 10 × the per-year odds ratio.
- A correction already issued. None found (see Status).
Status
- Version of record. The DOI resolves to the publisher's article page (academic.oup.com/brain/article/145/6/2031/6604351). It carries the same Abstract sentence ("ageing by 10 years increased the odds of death 11-fold") and the same Results sentence and numbers. The PMC HTML page and the Europe PMC full-text XML match. Every quotation above was checked verbatim against the PMC-archived text with
src/show.py. The Fig. 5D values were read from the published figure imageawab466f5.jpg. - Supplements. I downloaded the Europe PMC supplementary bundle (
awab466_Supplementary_Data.zip). It contains videos, the participant information sheet, the study, scan and case-report protocols, File016 (analytic R code with model output), File017 (the 30-page Supplementary Material), File018 (a spreadsheet of rhythm analyses) and an investigator list. File016 contains the outcome model's coefficient table and the authors' own exp() conversions quoted above. Neither File016 nor File017 mentions "10 years", "decade" or "11-fold". The supplement does not resolve the discrepancy in favour of 11-fold; it confirms the per-year coefficient from which 2.70 follows. - Corrections and comments. As of 2026-10-24 I found no correction, erratum, retraction or expression of concern.
src/known.pyreturned no Crossref update relations, no PMC notices and no Europe PMC notices. The Crossref record has no update-to or updated-by relations. The PubMed record (PMID 35691613) lists no linked comments or errata, and the publisher page shows no notice. Retraction Watch has no entry for the paper, and a web search found no erratum or PubPeer thread. PubPeer's site returned HTTP 403 to automated requests, and the Europe PMC search endpoint returned HTTP 503 on four attempts, so those two checks are incomplete. A web search also found the medRxiv preprint (doi:10.1101/2021.01.23.21250327), which reportedly gives the same 11-fold figure; I did not check its wording myself. - Sources. PMC article PMC9336587; Europe PMC full-text XML and supplementary files for PMC9336587 (File016
brain-2021-00914-File016.pdf, File017brain-2021-00914-File017.pdf); figure imageawab466f5.jpg; Crossref; PubMed; Retraction Watch; PubPeer; https://doi.org/10.1093/brain/awab466.
Suggested correction
In the Abstract, replace
ageing by 10 years increased the odds of death 11-fold (P = 0.0002)
with
ageing by 10 years increased the odds of death 2.7-fold (P = 0.0002)
In the Results, replace "increased the odds of death in intensive care 21-fold and 11-fold, respectively" with "increased the odds of death in intensive care 21-fold and 2.7-fold, respectively", and optionally add the 10-year interval (95% CI 1.6–4.6). In Fig. 5D, either plot the "Age (per decade)" row at 2.70 (1.59–4.57), or relabel the row "per year" and plot 1.10 (1.05–1.16). The per-year odds ratio, its confidence interval and all P values need no change.