← Back to the plain-language case
Table 4 brain-volume T values contradict their p values and the table's own means and SDs
Hum Brain Mapp (2022) · doi:10.1002/hbm.25798 · PMC9057088
Summary
Table 4 compares regional brain volumes between 49 healthy children and 53 children with ADHD by a two-independent-samples t test, and in 9 of its 10 rows the printed T value implies a p at least 50 times smaller than the printed p (for whole brain, T = 9.872 sits with p = .995, although no t of that size can have p above .064 at any degrees of freedom). Recomputed from the table's own means and SDs, only the hippocampus row matches its T (7.50 vs 7.401); every other row gives |t| between 0.41 and 1.42, none significant. As a result, lower frontal-lobe volume in ADHD, stated in the Abstract (table p = .008), recomputes to t = 1.42, p = .16, and lower total brain volume, stated in the Results (p < .05), has p = .995 in the table itself and p = .68 on recomputation. The paper's main finding, lower brain iron measured by QSM, rests on other tables and is not affected, but its volume findings and the Discussion built on them are.
What the paper reports
Methods, "Patient information" (group sizes):
53 children with ADHD were included in the study
49 children were included in the study
Methods, "Statistical analysis":
Two independent samples t test was used to compare the brain volume of children between the study group and the control group (p < .05 means the difference is statistically significant).
Table 4, caption and selected rows. The columns are Control group | Study group | T value | p value:
Volume values of brain regions in children [ x ¯ ± s, volume (cm3)]
Frontal | 189.77 ± 27.65 | 182.56 ± 23.53 | 12.871 | .008
Temporal | 138.32 ± 15.25 | 140.47 ± 18.34 | 10.132 | .213
Hippocampus | 12.37 ± 1.28 | 10.24 ± 1.56 | 7.401 | .002
TH | 14.97 ± 2.56 | 14.59 ± 2.39 | 8.601 | .804
Whole brain | 1452.89 ± 179.43 | 1437.96 ± 187.31 | 9.872 | .995
Abstract:
The volume of frontal lobe and hippocampus of children with ADHD was lower than that of healthy children (p < .05).
Results, "Brain volume comparison results":
The brain areas of the frontal lobe and hippocampus of children with ADHD are lower than healthy children (p < .05); the total brain volume of children with ADHD is lower than that of healthy children (p < .05) (Table 4).
Discussion, where the volume results are interpreted:
children with ADHD only have abnormal brain areas such as the frontal lobe and hippocampus (lower than healthy children)
The number of brain areas with abnormal iron content is more than the number of brain areas with abnormal volume
suggesting that the reduced volume of frontal and hippocampal brain regions may be due to decreased iron content in brain regions
the decrease in the volume of the frontal and temporal lobes and other brain regions may be due to
What the paper's own numbers show
Method. For every Table 4 row, I recomputed the two-sample t test from the printed means and SDs with n = 49 (control) and n = 53 (ADHD), using scipy.stats.ttest_ind_from_stats, both pooled-variance (Student) and Welch. I then made three checks. (i) The two-sided p each reported T implies on 100 df, the df of the stated test. (ii) The largest p any reported T could have at all, which occurs at df = 1. (iii) The |t| each reported p implies. As a control, the same procedure applied to Table 1 (age, weight, BMI and serum iron, which the Methods say were tested with the same test on the same groups) reproduces the published T and p values: t = 0.259, −0.904, −0.486 and 0.676 against 0.255, −0.904, −0.486 and 0.676. This confirms the group sizes and that "±" is the SD. Every number below is printed by recompute.py.txt.
| Quantity | Location | Reported | Recomputed from the paper's numbers |
|---|---|---|---|
| Frontal volume, T / p | Table 4 | 12.871 / .008 | t = 1.422, p = .158 (Welch 1.413, p = .161). T = 12.871 implies p = 6.1 × 10⁻²³ |
| Temporal volume, T / p | Table 4 | 10.132 / .213 | t = −0.641, p = .523 (ADHD mean is larger). T = 10.132 implies p = 5.1 × 10⁻¹⁷ |
| Hippocampus volume, T / p | Table 4 | 7.401 / .002 | t = 7.503, p = 2.6 × 10⁻¹¹. T matches; T = 7.401 implies p = 4.3 × 10⁻¹¹, not .002 |
| Thalamus (TH) volume, T / p | Table 4 | 8.601 / .804 | t = 0.775, p = .440. T = 8.601 implies p = 1.1 × 10⁻¹³ |
| Globus pallidus (GP) volume, T / p | Table 4 | 1.354 / .193 | t = −1.194, p = .235. The only row where T and p agree with each other (T implies p = .179) |
| Substantia nigra (SN) volume, T / p | Table 4 | 4.457 / .643 | t = −1.158, p = .249. T = 4.457 implies p = 2.2 × 10⁻⁵ |
| Putamen (PU) volume, T / p | Table 4 | 3.871 / .109 | t = 1.248, p = .215. T = 3.871 implies p = 1.9 × 10⁻⁴ |
| Red nucleus (RN) volume, T / p | Table 4 | 7.422 / .127 | t = 1.128, p = .262. T = 7.422 implies p = 3.9 × 10⁻¹¹ |
| Caudate nucleus (CN) volume, T / p | Table 4 | 3.214 / .566 | t = 0.977, p = .331. T = 3.214 implies p = .0018 |
| Whole-brain volume, T / p | Table 4 | 9.872 / .995 | t = 0.410, p = .682 (difference 14.93 cm³, SE 36.3). T = 9.872 implies p = 1.9 × 10⁻¹⁶ |
| Largest p possible for |t| = 9.872 | Table 4, whole brain | .995 | .064, even at df = 1 |
| |t| implied by p = .995 on 100 df | Table 4, whole brain | 9.872 | 0.006 |
| Whole-brain effect size | Table 4 | — | Cohen's d = 0.081. Reaching t = 9.872 at this d would need about 29 466 children per group |
| Frontal volume significance | Abstract; Results; Table 4 | lower in ADHD, p < .05 (table p = .008) | not significant, p = .158 |
| Total brain volume significance | Results | lower in ADHD, p < .05 | table p = .995; recomputed p = .682 |
| Hippocampus volume significance | Abstract; Results; Table 4 | lower in ADHD, p < .05 | confirmed, p = 2.6 × 10⁻¹¹ |
| Control check, Table 1 t values | Table 1 | 0.255 / −0.904 / −0.486 / 0.676 | 0.259 / −0.904 / −0.486 / 0.676 |
Table 4 therefore has two separate problems. First, the T column and the p column cannot both be correct in 9 of 10 rows. Second, the T column does not follow from the printed means and SDs. In 8 of 10 rows the printed T is 3.1 to 24 times the recomputed |t|. GP is close in size (1.354 vs 1.194) but, like temporal and SN, is printed as positive although the control mean is the smaller one. Only hippocampus agrees (ratio 0.99). The p column is closer to the summary data (all rows except frontal and hippocampus are non-significant in both), but it still does not reproduce them. Frontal is the decisive row: p = .008 is printed, and p = .158 follows from the table's own data.
A related observation. Table 3 (left vs right iron content within the ADHD group, n = 53) shows the same mismatch between its T and p columns. For example, SN has T = 4.872 with p = .993, and no t statistic of 4.872 can have a p above .129. For six of its nine rows, the reported T is also larger than a paired t test on those means and SDs could produce at any left–right correlation. Its conclusion of no left–right difference agrees with the printed p values and with an unpaired recomputation (all |t| ≤ 0.72), so this does not change a finding. It does show that the T columns in more than one table do not correspond to the stated tests. Table 2 (ANCOVA for iron content) is internally consistent: its F values reproduce its p values on F(1, 99), for example F = 1.013 gives p = .317 and F = 0.056 gives p = .813.
Figure
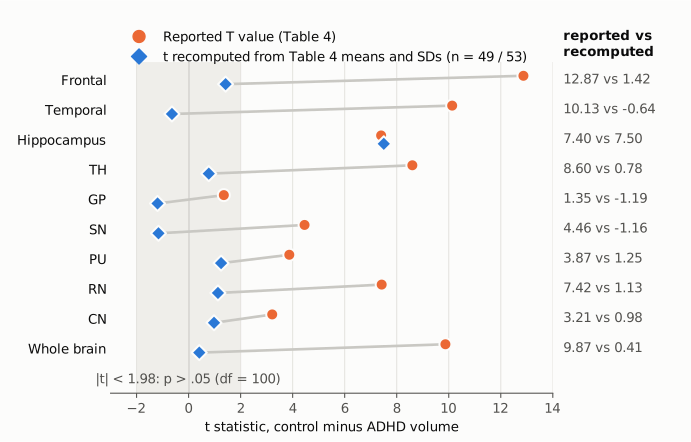
Figure 1. For each Table 4 row, the orange circle is the printed T value. Table 4 prints all T values without a sign, so they are drawn as positive. The blue diamond is the t statistic recomputed from the same row's means and SDs, with n = 49 controls and 53 children with ADHD, using a pooled-variance two-sample t test; positive means the control group is larger. The shaded band is |t| < 1.98, the region where p > .05 on 100 df. The two markers are offset vertically so that they stay visible where they coincide. Only the hippocampus row agrees. In every other row except GP, the printed T lies far outside the band while the recomputed t lies inside it. That includes frontal, which the Abstract reports as significantly smaller in ADHD.
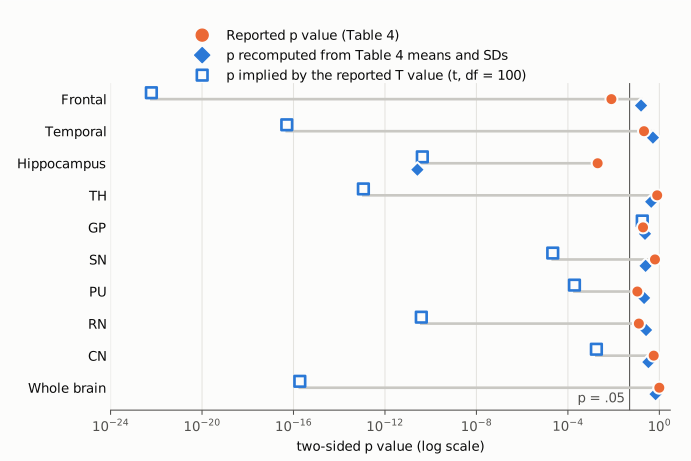
Figure 2. Three two-sided p values per row on one log axis. The orange circle is the p printed in Table 4. The filled blue diamond is p recomputed from the row's means and SDs. The hollow blue square is the p that the printed T value implies on 100 df. The thin vertical line marks p = .05. If the table were internally consistent, the three markers would coincide in every row. They do so only for GP. For whole brain, the printed T implies p = 1.9 × 10⁻¹⁶, while the printed p is .995 and the recomputed p is .68. For frontal, the printed p (.008) lies on the significant side of .05 and the recomputed p (.158) on the other.
Why it matters
The paper's primary result is lower regional brain iron on quantitative susceptibility mapping in children with ADHD (Tables 2 and 3, and the ROC analysis in Table 5). Table 4 does not bear on it, and this write-up does not question it.
Table 4 is, however, the only source of the paper's volume findings, and two of them do not survive recomputation.
- Frontal-lobe volume. The Abstract, the Results and the Discussion all state that frontal volume is lower in ADHD (p < .05). The printed means differ by 7.21 cm³ against a pooled SD of 25.59 cm³ (d = 0.28). This gives t = 1.42, p = .16, which is not significant at the paper's own threshold.
- Total brain volume. The Results state that total brain volume is lower in ADHD (p < .05) and cite Table 4. The table itself prints p = .995 for whole brain, and recomputation gives p = .68 for a 1% difference.
- The Discussion's interpretation. The Discussion proposes that reduced iron delays development and so reduces the volume of the frontal (and temporal) lobes and hippocampus. It also contrasts the number of regions with abnormal iron against the number with abnormal volume. On the table's own data, only the hippocampal volume difference holds (t = 7.50). The frontal and whole-brain volume differences, and the temporal difference mentioned in the Discussion, have no support in Table 4.
Because the T column does not follow from the summary data in 9 of 10 rows, a reader also cannot use Table 4's T values for meta-analysis or to judge effect sizes. The means and SDs, which reproduce the Table 1 pattern, are the more usable part of the table, assuming they are correct.
Explanations considered
- The "±" values are standard errors, not SDs. This does not explain the table. The caption gives "x̄ ± s", and the Methods say data are shown as mean ± s. Treating them as SEMs would make every recomputed t smaller (whole brain t = 0.058), not larger. The Table 1 check reproduces only with "±" read as the SD.
- Different group sizes. This does not explain it. Table 1 reproduces exactly with n = 49 and 53. At the whole-brain effect size (d = 0.081), a t of 9.872 would need about 29 466 children per group.
- Welch (unequal-variance) t test. This does not explain it. Welch t values differ from the pooled values only in the second or third decimal (whole brain 0.411, frontal 1.413).
- An adjusted analysis, such as one for age, sex or intracranial volume. The Methods name covariate adjustment (ANCOVA for age) only for iron content, and they describe the volume comparison as a two-independent-samples t test. An adjusted model could in principle give a frontal p different from .16. It cannot make a test statistic of 9.872 sit with p = .995, or 10.132 with p = .213, under any t distribution: the largest p possible for |t| = 9.872 is .064, at df = 1. So an adjustment could explain at most one of the two columns, and the paper does not describe one.
- The T column holds a different statistic, for example Levene's F for equal variances, which SPSS prints next to the t test. Read as F(1, 100), the printed values give p = .0022 for whole brain, .0019 for temporal and .0042 for TH. These do not match the printed p values either, and a variance test on SDs as similar as 179.43 and 187.31 (variance ratio 1.09) would be unlikely to give F = 9.872. This reading does not account for the numbers.
- Rows or columns shifted during typesetting. No reordering of the printed values can match the recomputed ones. Nine recomputed |t| values lie between 0.41 and 1.42, but only one printed T (1.354) is below 3.2. Likewise, no printed p is near the recomputed hippocampus p of 2.6 × 10⁻¹¹ (the smallest printed p is .002). The PMC rendering and the Europe PMC XML have the same cells in the same order. The cells are plain text, with no lost minus signs, superscripts or decimal marks. So a conversion artifact is unlikely. The publisher's own HTML and PDF could not be opened (see Status).
- A typographical error in a single cell. This does not fit the pattern: 9 of 10 rows are affected, and the same T/p mismatch also appears in Table 3.
None of these explanations accounts for the table. The published material does not show how the T and p columns were produced.
Status
- Version of record. Wiley's article pages (onlinelibrary.wiley.com, /doi/full and /doi/pdfdirect) and the PMC PDF returned HTTP 403 or a bot challenge to automated access, so they were not read. I checked the publisher-deposited full text in two places, the PMC article (https://pmc.ncbi.nlm.nih.gov/articles/PMC9057088/) and the Europe PMC full-text XML (PMID 35107194). Table 4 is identical in both. Every quotation above was confirmed verbatim against the PMC-archived text.
- Supplements and data. The article has no supplementary-material files. The Data Availability Statement links to a private figshare item (https://figshare.com/s/1c22e32887bff32467eb). When it was opened in a browser, it was titled "ADHD DATA" and showed "No file added yet". No individual-level data were available to check Table 4 against.
- Corrections and comments. As of 2026-10-23, I found no correction, erratum, expression of concern or retraction. The Crossref work record has no update-to or updated-by entries. The Crossref filter
updates:10.1002/hbm.25798returns 0 items (re-run on 2026-10-23), and Crossref includes the Retraction Watch database. PMC lists no related notice. The Europe PMC record has no comment/correction list. Earlier web searches found no PubPeer thread or published comment on the article. On 2026-10-23, PubPeer's search page returned HTTP 403 to automated access and the web-search quota was exhausted, so a PubPeer thread could not be ruled out directly. - Sources. PMC full text (PMC9057088); Europe PMC REST API; Crossref REST API (api.crossref.org/works/10.1002/hbm.25798); the figshare link given in the article.
Suggested correction
- Re-run the volume comparisons from the source data with the test stated in the Methods, and replace the T and p columns of Table 4. If the analysis was adjusted (for example for age, sex or intracranial volume), say so in the Methods and the table footnote, and report the matching statistic and degrees of freedom.
- If the printed means and SDs are correct, revise the Abstract, the Results ("Brain volume comparison results") and the Discussion: lower frontal-lobe volume (recomputed p = .16) and lower total brain volume (table p = .995, recomputed p = .68) are not supported, and lower hippocampal volume is. Remove or qualify the Discussion passages that attribute reduced frontal and temporal volume to reduced iron.
- Check Table 3 the same way. Its T values are inconsistent with its p values, and in six rows with any paired test on the printed means and SDs. Report signed t statistics in Tables 3 and 4, as Table 1 does.
- Deposit the data in the figshare record named in the Data Availability Statement, which at the time of checking contained no files.