← Back to the plain-language case
Figure 3 legend calls a transduction P value of 0.096 statistically significant
Proc Natl Acad Sci U S A (2022) · doi:10.1073/pnas.1910844119 · PMC8812682
Summary
The Figure 3 legend reports a Friedman/exact test of CAR transduction across three activation conditions (CD3, CD3/CD28, CD3/CD28/CD81) and states that the data "reject the null hypothesis, indicating a statistically significant difference in transduction (P = 0.096)". At the conventional 0.05 level, which the paper's parallel Figure 2 statement also uses (P = 0.038, called significant), a P value of 0.096 does not reject the null hypothesis. No other significance level, one-sided test or adjustment is stated anywhere in the article. This P value is the only inferential statistic the article gives for any transduction comparison, and transduction is the outcome named in the title. The observed direction of the effect is unaffected, but its stated statistical significance is not supported by the number printed.
What the paper reports
Figure 3 legend ("CD81 costimulation improves CAR transduction efficiency"):
These data are representative of three experiments, with transduction efficiency across experiments illustrated. For CAR transduction, we employed the nonparametric Friedman test and exact test for repeated-measures experiments. Our null hypothesis (H0) is that there is no difference in median transduction between groups. Our data reject the null hypothesis, indicating a statistically significant difference in transduction (P = 0.096) for cells treated with additional CD81 costimulation.
Figure 2 legend ("CD81 costimulation enhances activation of isolated naive T cells"), the parallel statement for activation:
These data are representative of four experiments with average CD69 expression prior to CAR transduction across experiments illustrated. For activation, we employed the nonparametric Friedman test and exact test for repeated-measures experiments. Our null hypothesis (H0) is that there is no difference in median activation between groups. Our data reject the null hypothesis, indicating a statistically significant difference in activation (P = 0.038) for cells treated with additional CD81 costimulation.
Results, "CD81 Costimulation Enhances CAR Transduction in Naive T Cells":
In specific, activating naive T cells with additional CD81 costimulation achieved greater transduction efficiency as compared with CD3 or CD3/CD28 activation conditions (Fig. 3A and SI Appendix, Fig. S2A).
Abstract (Significance statement):
We show that CD81 costimulation of naive T cells prior to CAR transduction can lead to enhanced CAR expression in this T cell subset.
Discussion, second paragraph:
Importantly, the T cell product derived from these CD81-costimulated naive T cells achieved greater transduction efficiency, with greater levels of CD19 CAR expression.
The article has no statistics subsection in its Methods and states no significance level. The only P values in the article are the two above and the three in the Figure 1C legend (CD4 "<0.0001", CD8 "<0.0002", naive "<0.0001"; seven experiments; no test named).
What the paper's own numbers show
Method. I compared each reported P value with the conventional significance level of 0.05, checked whether rounding, halving (a one-sided reading) or a 0.10 level would change the comparison, and confirmed that the parallel Figure 2 statement follows the same template with a P value below 0.05. To see whether a P value below 0.05 was reachable with the stated design, I enumerated the exact null distribution of the Friedman statistic for three conditions and three, four and seven experiments (all (3!)^n equally likely within-experiment rankings, assuming no ties). The per-experiment transduction values are not in the article, so the test itself cannot be recomputed. Every number below is printed by recompute.py.txt.
| Quantity | Location | Reported | Recomputed from the paper's numbers |
|---|---|---|---|
| Transduction P value | Fig. 3 legend | P = 0.096, "reject the null hypothesis", "statistically significant" | 0.096 > 0.05, so H0 is not rejected at 0.05; P is 1.92 times the threshold |
| Unrounded range of the transduction P value | Fig. 3 legend | 0.096 | any value in [0.0955, 0.0965) rounds to 0.096; all are above 0.05 |
| One-sided reading | derived | not stated | 0.096 / 2 = 0.048 (< 0.05), but the legend prints 0.096 as the P it calls significant |
| 0.10 level | derived | not stated | 0.096 ≤ 0.10, but no 0.10 level is stated anywhere in the article |
| Activation P value | Fig. 2 legend | P = 0.038, "statistically significant" | 0.038 < 0.05, so H0 is rejected at 0.05; consistent |
| Smallest attainable exact Friedman P, 3 experiments × 3 conditions | Fig. 3 design | not stated | 0.0278 (6/216), reached only when all three experiments rank the conditions identically; the next value is 0.1944 |
| Is 0.096 an attainable exact P for 3 × 3? | Fig. 3 design | 0.096 | no; the nearest chi-square-approximation P is 0.0970 (Q = 4.667), whose exact P is 0.1944 |
| Smallest attainable exact Friedman P, 4 experiments × 3 conditions | Fig. 2 design | not stated | 0.0046; 0.038 is not attainable exactly (nearest: exact 0.0417, chi-square 0.0388 at Q = 6.5) |
| Smallest attainable exact Friedman P, 7 experiments × 3 conditions | Fig. 1C design | "<0.0001", "<0.0002", "<0.0001" | 0.000021, so values below 0.0001 are attainable; consistent if the same test was used |
The central finding needs no reconstruction: the legend's own P value is above 0.05, and the legend's own conclusion is that the null hypothesis is rejected. The attainability rows are a secondary observation. Neither 0.096 nor 0.038 matches the exact Friedman distribution for the simplest reading of the stated designs, which suggests that the printed values come from a different computation (for example the chi-square approximation, ties, or a different number of blocks) or contain a transcription slip. The article does not give enough detail to tell which.
Figure
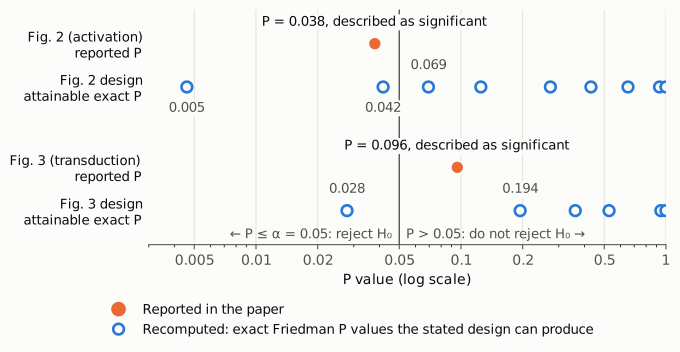
P values on a log scale, with the 0.05 level as a vertical reference line. Filled orange points are the P values printed in the Figure 2 (activation, four experiments) and Figure 3 (transduction, three experiments) legends; both legends describe their result as statistically significant. Open blue points are the exact Friedman P values that three conditions and the stated number of experiments can produce (no ties), computed by recompute.py.txt. The Figure 2 value falls to the left of the line, where H0 is rejected. The Figure 3 value falls to the right of it, where H0 is not rejected. For the Figure 3 design an exact P below 0.05 (0.028) was attainable, and 0.096 itself is not one of the attainable values.
Why it matters
The article's title states that CD81 costimulation "skews CAR transduction toward naive T cells", and the Significance statement and Discussion describe enhanced transduction and CAR expression. The Figure 3 legend contains the only inferential test the article reports for any transduction comparison: the transduction results in Figures 4 and 5 carry no P values. The legend presents that test as a rejection of the null hypothesis. Read at the conventional 0.05 level, the test does not reject it. With three experiments the result is better described as a non-significant difference in the stated direction. The observed direction and size of the transduction difference are unchanged, and the activation results (Fig. 1C; Fig. 2, P = 0.038) are not affected. The paper calls itself a proof of principle, and its qualitative message survives. What does not survive is the claim that the transduction difference in Figure 3 is statistically significant. A reader or a meta-analyst taking the legend at its word would count as significant a result that is not significant by the paper's own figure.
Explanations considered
- Rounding. Any unrounded value that prints as 0.096 lies between 0.0955 and 0.0965, all above 0.05. Rounding does not account for it.
- A one-sided test. Halving gives 0.048, which is below 0.05. But the legend prints 0.096 as the value it calls significant, and it states a non-directional null ("no difference in median transduction between groups"). The Friedman statistic is an omnibus test across three groups whose P is already an upper-tail probability, so it has no natural one-sided version. A one-sided convention would have been reported as 0.048. This does not account for the sentence as written.
- A significance level of 0.10. P = 0.096 would meet a 0.10 level. No such level is stated anywhere in the article, and the parallel Figure 2 sentence uses the same wording for P = 0.038. A 0.10 level would make the sentence consistent only if it had been declared, and it was not.
- Multiplicity adjustment. Adjustment can only raise a P value, so an adjusted or unadjusted reading cannot bring 0.096 below 0.05.
- A different quantity or population. A P value has no units. The 0.038 in Figure 2 belongs to a separate test of activation in four experiments, not to an alternative reading of the transduction result.
- Significance at 0.05 unreachable with three experiments. This is ruled out by enumeration. With three conditions and three experiments, the exact Friedman test can produce P = 0.028 when every experiment orders the conditions the same way, so a significant result was possible with this design.
- A misprinted P value. This cannot be excluded. Because 0.096 is not an attainable exact P for three experiments and three conditions, the printed value may not be the value the stated test produced. If the experiments all ranked the conditions identically, the exact P would be 0.028 and the significance statement would be correct with a misprinted number. If they did not, the exact P would be 0.194 or larger, and the result would be further from significance. The per-experiment values (cited as SI Appendix Fig. S2A) are not reproduced in the retrievable text, so this cannot be resolved from the article. Either way, the published sentence pairs a conclusion with a number that does not support it, and only the authors can say which of the two is right.
Status
- Version of record. As of 2026-10-23, the sentence appears verbatim in the Figure 3 legend of the PubMed Central version (PMC8812682), in the Europe PMC full-text XML, and in the local PMC archive used here. The value 0.096 occurs only in the Figure 3 legend. The legend is published as text, not as part of an image, and all three copies agree, so a conversion artifact is not plausible.
- Supplement. The SI Appendix is cited for the transduction data (Fig. S2A). Per-experiment transduction measurements or ranks are not available in the retrievable text. They would settle the misprint question above, but they would not change the inconsistency between the printed P value and the printed conclusion.
- Corrections and comments. The Crossref record for the DOI has no update-to, updated-by or relation entries. PMC and Europe PMC list no correction, erratum, expression of concern or retraction, and the PMC page has no notice. Searches of PubPeer and Retraction Watch found no entry.
- Sources checked. The PMC article page and archive (
src/show.py PMC8812682),src/known.py 10.1073/pnas.1910844119(Crossref, PMC and Europe PMC notices: none), the Crossref works API, the Europe PMC full-text XML and core search, PubPeer and Retraction Watch.
Suggested correction
Either correct the conclusion or correct the number, whichever the underlying data support:
- If P = 0.096 is the correct result of the stated test, the Figure 3 legend could read: "Our data do not reject the null hypothesis at the 0.05 level (P = 0.096); the difference in transduction with additional CD81 costimulation was not statistically significant." Any statement elsewhere implying a statistically demonstrated transduction advantage in Figure 3 should be worded descriptively to match.
- If 0.096 is a misprint, the corrected P value should be given, together with the number of experiments (blocks) and conditions entering the test, whether the exact or the chi-square P is reported, and the per-experiment transduction values (or ranks) so that readers can verify it.
In either case, stating the significance level used for all tests (presumably 0.05, as in Figure 2) would remove the ambiguity.