← Back to the plain-language case
Abstract reports reliable cannabis-related subcortical reductions that the paper's own FDR-corrected Table 3 does not support
Hum Brain Mapp (2020) · doi:10.1002/hbm.25114 · PMC8675406
Summary
This ENIGMA-Addiction meta-analysis compares subcortical volumes and cortical thickness in alcohol use disorder (AUD) and cannabis use disorder (CUD) with published results for other psychiatric disorders. The Abstract states that the CUD meta-analysis "indicated reliable reductions in amygdala, accumbens and hippocampus volumes". The paper's own Table 3 gives FDR-adjusted p-values of .1608, .3623 and .1608 for these three regions. The Methods set significance at pFDR < .05, and the accumbens is not significant even before correction (p = .207; 95% CI −0.3787 to 0.0821). The Results, the Figure 2 caption and the Conclusion all say that no CUD subcortical difference survived correction. Recomputing the p-values from the table's effect sizes and standard errors, and applying Benjamini–Hochberg across the seven regions, reproduces the table. So the table is internally consistent, and the Abstract's CUD sentence is the part that disagrees with it. The paper's AUD findings are not affected.
What the paper reports
Abstract:
Meta-analysis of CUD case–control studies indicated reliable reductions in amygdala, accumbens and hippocampus volumes, with the former effect size comparable to, and the latter effect size around half of that reported for alcohol and SCZ.
Abstract, the next sentence, on CUD cortical thickness:
CUD was associated with lower cortical thickness in the frontal regions, particularly the medial orbitofrontal region, but this effect was not significant after correcting for multiple testing.
Abstract, last sentence:
Although modest, CUD results overlapped with findings reported for AUD and other psychiatric conditions, but appear to be most robustly related to reduce thickness of the medial orbitofrontal cortex.
Methods, "Statistical framework of meta-analysis":
Significance level was determined with a p FDR < .05 for all regions of interest.
Results, second paragraph (in full):
Figure 2 presents the case control comparisons for CUD, showing non-significant case–control differences after correcting for multiple comparisons.
Results, Figure 3 paragraph:
The effects reported for CUD in the amygdala and accumbens appear comparable to those reported for AUD and SCZ, but due to large CIs, these effects were not shown to significantly differ from non-effect line and the other disorders.
Results, Figure 4 paragraph (how the paper itself uses "reliable"):
However, the temporal pole for CUD did not survive FDR correction, so it is not a reliable finding.
Figure 2 caption (CUD subcortical forest plot):
All results are non-significant following false discovery rate correction.
Conclusion and Context:
No significant subcortical volume or cortical thickness variation was observed in cannabis-dependent subjects.
The absence of significant variations that survived FDR correction in CUD participants is interesting given the debate on the potential neurotoxic impact of cannabis dependence on the hippocampus and the medial orbitofrontal cortex
Table 3 (CUD vs controls), subcortical rows named in the Abstract, as printed (ROI | ES | SE | 95% CI.LB | 95% CI.UB | I² | p | p FDR):
Hippocampus | −0.2416 | 0.1071 | −0.4515 | −0.0318 | 0.00 | .024 | .1608
Amygdala | −0.2638 | 0.1322 | −0.5229 | −0.0048 | 29.6 | .0459 | .1608
Accumbens | −0.1483 | 0.1175 | −0.3787 | 0.0821 | 14.28 | .207 | .3623
Table 3 footer (excerpt):
p FDR, adjusted p-value for the seven sites following a BH correction
The footer also says "PFDR less than 0.05 are bolded". According to the version-of-record check (see Status), no cell in the CUD table is bold.
What the paper's own numbers show
Method. The paper reports random-effects meta-analytic Cohen's d (ES) with its standard error (SE), a 95% CI, an uncorrected p and a Benjamini–Hochberg (BH) adjusted pFDR for each region. For each of the seven CUD subcortical regions in Table 3, I computed z = ES/SE, the two-sided normal p = 2·(1 − Φ(|z|)) and the Wald interval ES ± 1.96·SE. I then applied BH across the seven reported uncorrected p-values, as the table footer describes. As controls for the method, I applied the same BH step to the seven AUD subcortical p-values in Table 2 and to the 34 CUD cortical p-values in Table 3. Every number below is printed by recompute.py.txt.
| Quantity | Location | Reported | Recomputed from the paper's numbers |
|---|---|---|---|
| CUD hippocampus, uncorrected p | Table 3 | .024 | z = −2.26, p = 0.0241 |
| CUD hippocampus, pFDR | Table 3 | .1608 | BH = 0.1607 (not < .05) |
| CUD amygdala, uncorrected p | Table 3 | .0459 | z = −2.00, p = 0.0460 |
| CUD amygdala, pFDR | Table 3 | .1608 | BH = 0.1607 (not < .05) |
| CUD accumbens, uncorrected p | Table 3 | .207 | z = −1.26, p = 0.2069 (not < .05) |
| CUD accumbens, 95% CI | Table 3 | [−0.3787, 0.0821] | [−0.3786, 0.0820]; includes 0 |
| CUD accumbens, pFDR | Table 3 | .3623 | BH = 0.3622 (not < .05) |
| Smallest CUD subcortical pFDR | Table 3 | .1608 | 0.1607; no region has pFDR < .05 |
| Uncorrected p the top-ranked region would need for pFDR < .05 | derived | .024 (hippocampus) | p < 0.0071 |
| CUD subcortical findings | Abstract | "reliable reductions in amygdala, accumbens and hippocampus volumes" | none survives FDR; accumbens is not significant uncorrected either |
| CUD/AUD effect-size ratio: amygdala, hippocampus | Abstract ("former … comparable to, latter … around half") | — | 0.67 and 0.48 (point estimates only) |
| CUD medial orbitofrontal thickness, pFDR | Table 3; Abstract last sentence | .0672 | BH over 34 cortical ROIs = 0.0680 (p printed to 3 decimals); not < .05 |
| Control: AUD subcortical BH | Table 2 | .0279, .6844, .0105, .1961, .0010, .0031, .0031 | 0.0279, 0.6844, 0.0105, 0.1961, 0.0007, 0.0030, 0.0030 (hippocampus p is printed as .0001; p = .00014 gives 0.0010) |
| Control: CUD cortical BH, 34 ROIs | Table 3 | — | largest difference from the reported pFDR 0.0065, explained by 3-decimal p-values |
| Side finding: CUD thalamus 95% CI upper bound | Table 3 | 0.0821 | ES + 1.96·SE = 0.2993; 0.0821 is the accumbens upper bound |
The recomputed p-values and intervals match Table 3 to the fourth decimal, and BH across the seven regions reproduces the reported pFDR. The same BH step reproduces the AUD pFDR values in Table 2, where five regions are significant. The CUD table is therefore consistent with the paper's stated method, and under that method no CUD subcortical region is significant. Two regions, hippocampus and amygdala, are nominally significant before correction. The accumbens is not significant at any level.
Figure
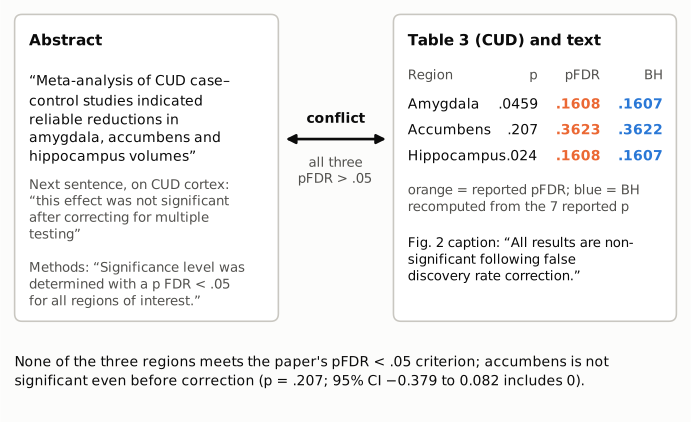
Figure 1. Left: the Abstract's CUD subcortical claim, the next Abstract sentence (which applies the multiple-testing standard to CUD cortex) and the Methods' significance criterion. Right: the Table 3 uncorrected p and pFDR for the three regions the Abstract names, with the reported pFDR in orange and the BH value recomputed from the seven reported p-values in blue, and the Figure 2 caption. All excerpts are verbatim. All three pFDR values are above the paper's .05 criterion, and the accumbens p = .207 is above .05 before any correction.
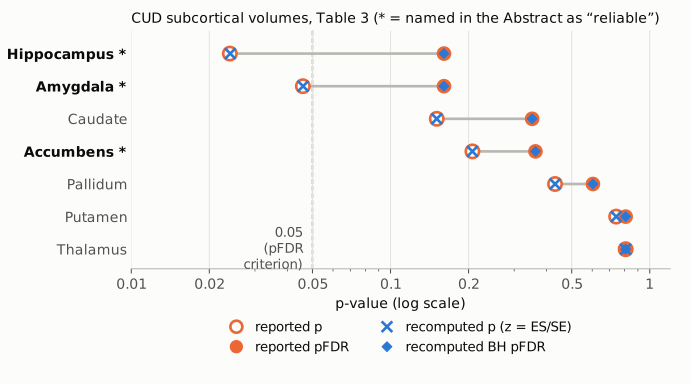
Figure 2. For each CUD subcortical region in Table 3, the open orange circle is the reported uncorrected p and the filled orange circle the reported pFDR, joined by a gray segment. Blue crosses are p-values recomputed from ES/SE, and blue diamonds are BH values recomputed across the seven regions. They sit on top of the reported values. The axis is logarithmic, and the dashed line marks 0.05, the paper's pFDR criterion. The three regions named in the Abstract are marked with an asterisk. Every filled marker lies to the right of the line, and the accumbens lies to the right of it even before correction.
Why it matters
The Abstract is the part of the paper most often read, indexed and cited. Its CUD sentence presents three subcortical volume reductions as "reliable" and goes on to scale them against alcohol and schizophrenia ("comparable to", "around half of"), which reads as a description of established effects. Under the paper's own criterion, which is stated in the Methods and applied throughout the body, none of these effects is established. The amygdala and hippocampus are nominally significant before correction. The accumbens is not significant even then, and its interval includes zero. A reader who relied on the Abstract would conclude that this ENIGMA meta-analysis found cannabis-related subcortical volume loss. The full text concludes the opposite: "No significant subcortical volume or cortical thickness variation was observed in cannabis-dependent subjects."
The Abstract's closing sentence has a related, milder problem. It says that CUD results "appear to be most robustly related to reduce thickness of the medial orbitofrontal cortex". The medial orbitofrontal pFDR is .0672, and the preceding Abstract sentence itself states that this effect was not significant after correction. "Most robustly" is therefore true only as a ranking of the CUD cortical effects, none of which is significant.
The direction of the point estimates (smaller volumes in CUD for hippocampus, amygdala and accumbens) is unaffected, and so are the effect-size ratios against AUD as point estimates. What changes is the strength of evidence: these are imprecise estimates consistent with no difference after correction, not reliable reductions. All AUD results are unaffected, as are the comparisons of AUD with schizophrenia, major depression and bipolar disorder, which form the paper's main conclusion.
Explanations considered
- Table 3 is wrong and the Abstract is right. This does not hold. The uncorrected p-values recomputed from ES/SE match the table to four decimals. BH across the seven regions reproduces the reported pFDR (0.1607, 0.1607, 0.3622 vs .1608, .1608, .3623). The same procedure reproduces the AUD table, so the method is the one the paper used. The intervals match ES ± 1.96·SE, except for one thalamus bound (see the last item). The Results, the Figure 2 caption and the Conclusion agree with the table.
- "Reliable" means nominally significant (uncorrected p < .05, or a CI that excludes zero). This would cover the hippocampus (p = .024) and the amygdala (p = .046). It does not cover the accumbens: p = .207, and the CI [−0.3787, 0.0821] includes zero. The paper also uses "reliable" to mean surviving FDR correction ("the temporal pole for CUD did not survive FDR correction, so it is not a reliable finding"). The Methods define significance as pFDR < .05, and the next Abstract sentence applies the correction standard to CUD cortex. So this reading does not account for the Abstract's three-region claim.
- The Abstract describes a different analysis, such as the sensitivity analysis without the adolescent sites. This is not supported. The Methods say that the Results report the analysis with the adolescent sites included. The supplement (Data S1) contains only Supplementary Figures 1–5, and none of them reports a CUD subcortical analysis in which amygdala, accumbens or hippocampus survives FDR correction (see Status). Supplementary Figure 4 is a leave-site-out analysis of the CUD caudate, not of the three regions in the Abstract.
- A different multiple-comparison family (for example, no correction across regions). The footer and Methods specify BH across the seven subcortical regions, and the AUD results in the same Abstract are described as significant "After correcting for multiple comparisons". Even with no correction at all, the accumbens is not significant.
- A conversion or typesetting error in the archived text. This is excluded. The PMC text, the publisher-supplied JATS XML in Europe PMC and the PubMed abstract carry the same Abstract sentence and the same Table 3 values (see Status).
- A separate copy error in Table 3 (side finding, not the claim under review). The CUD thalamus row prints CI upper bound 0.0821, but ES −0.0425 + 1.96 × 0.1744 = 0.2993. The printed value equals the accumbens upper bound in the same table. The thalamus p (.8074) and lower bound (−0.3844) fit ES and SE, so this looks like a copied cell. It does not affect any significance call.
Status
- Version of record. The Wiley article pages (doi.org redirect, /doi/pdf and /doi/full-xml) returned HTTP 403 to automated access, and the PMC HTML page returned a reCAPTCHA. I used the publisher-supplied JATS XML in Europe PMC (fullTextXML for PMC8675406; Hum Brain Mapp 43(1):399–413; first published online 2020-07-09) and the PubMed record (PMID 32643841). Both carry the Abstract sentence quoted above, and the XML carries the same Table 3 values, the same Figure 2 caption and the same Conclusion. The Table 3 footer says that values with pFDR < 0.05 are bolded, and no cell in the CUD table is bold. Every quotation above was confirmed verbatim against the PMC-archived text with
src/show.py. - Supplements. Data S1 (HBM-43-399-s001.docx), from the Europe PMC supplementary-files endpoint, holds Supplementary Figures 1–5 and supplementary references. Figures 1–2 show cortical thickness with and without the adolescent sites; Figure 3 an AUD accumbens leave-site-out analysis; Figure 4 a CUD caudate leave-site-out analysis; Figure 5 CUD site variability in two cortical regions. None reports a CUD subcortical result that survives FDR correction. The Data Availability statement says no new data are shared, so there is no site-level data to reanalyse.
- Corrections and comments. As of 2026-10-24 I found no correction, erratum, expression of concern or retraction. Crossref lists no update relations for the DOI, and PMC and Europe PMC list no notices. A web search for the DOI with "PubPeer", "erratum" or "correction" found nothing about this article. The PubPeer API refused automated access (HTTP 403), so PubPeer could not be checked directly.
- Sources. PMC article PMC8675406; Europe PMC full-text XML and supplementary files for PMC8675406; PubMed 32643841; Crossref metadata for 10.1002/hbm.25114.
Suggested correction
- Revise the Abstract's CUD subcortical sentence to match Table 3 and the Conclusion. For example: "Meta-analysis of CUD case–control studies showed no subcortical volume differences that survived FDR correction; hippocampus and amygdala volumes were nominally smaller in CUD (uncorrected p = .024 and .046), with point estimates about half (hippocampus) and two-thirds (amygdala) of those for AUD."
- Remove the accumbens from any statement of CUD volume reduction, or describe it as a non-significant point estimate (d = −0.15, 95% CI −0.38 to 0.08, p = .207).
- Revise the Abstract's last sentence so that the medial orbitofrontal result is described as the largest but non-significant CUD cortical effect (pFDR = .0672), not as the most robust one.
- Correct the CUD thalamus 95% CI upper bound in Table 3 from 0.0821 to 0.2993 (ES + 1.96·SE), or to the value in the original analysis output.