← Back to the plain-language case
Abstract and Results print an employment-disruption confidence interval that excludes its own odds ratio
Psychol Med (2021) · doi:10.1017/S0033291721004293 · PMC8523967
Summary
The abstract reports that serious psychological distress (SPD) before the pandemic predicted employment disruption with "OR 4.5, 95% CI 1.4–3.8", and the Results text gives the same estimate as "OR 4.45, 95% CI 1.44–3.75". In both places the upper confidence limit is below the odds ratio, which no 95% interval for an estimate can be. Table 2 reports the same contrast from the same model as 4.5 (1.4–13.8). On the log scale the Results-text OR and lower limit imply an upper limit of 4.45² / 1.44 = 13.75, so the printed upper limits appear to have lost a leading "1". The direction and statistical significance of the association are unchanged (p ≈ 0.01). However, the abstract understates the upper limit by a factor of about 3.7, which matters to anyone who takes the interval from the abstract.
What the paper reports
Every quotation below was checked verbatim against the PMC-archived text with src/show.py.
Abstract, Results:
SPD at T1 predicted disruption of employment (OR 4.5, 95% CI 1.4–3.8) and health care (OR 3.2, 95% CI 1.4–7.1) at T2.
Results, second paragraph (multinomial regression):
After adjustment for gender, age, race/ethnicity, and household income, SPD at T1 was associated with higher odds of employment disruption among those employed at T2 (OR 4.45, 95% CI 1.44–3.75) and with health care disruption among those with health conditions at T2 (OR 3.15, 95% CI 1.41–7.05). The association between SPD at T1 and disruption of childcare at T1 among those with children in the household was elevated but did not reach statistical significance (OR 2.16, 95% CI 0.58–8.09).
Table 2, "Association of pre-pandemic sociodemographic characteristics and serious psychological distress with experience of stressors early in the pandemic", row "High v. low". The columns are employment (not working; working, no job loss = reference; working with job loss), health care and childcare:
High v. low | 1.4 | (0.7–2.8) | 1 | 4.5 | (1.4–13.8) | 0.5 | (0.2–1.2) | 1 | 3.2 | (1.4–7.1) | 2.4 | (1.0–5.9) | 1 | 2.2 | (0.6–8.1)
Table 2 footer:
OR, odds ratio; NH, Non-Hispanic. ORs estimated in multinomial logistic regression models.
Methods, statistical analysis:
All analyses were conducted using survey procedures in SAS or Stata to account for the ALP sample design and weights.
What the paper's own numbers show
Method. The models are survey-weighted logistic and multinomial logistic regressions. For these, the 95% CI is the Wald interval exp(b ± 1.96·SE), which is symmetric on the log scale. Two consequences can be checked from the printed numbers alone. First, the OR must lie inside its interval. Second, it must equal the geometric midpoint √(L·U), up to rounding. Equivalently, U = OR² / L. I applied both checks to every odds ratio with a 95% CI in the abstract and the Results text, and to the three "High v. low" intervals in Table 2. That is 14 intervals in all. Every number below is printed by recompute.py.txt.
| Quantity | Location | Reported | Recomputed from the paper's own numbers |
|---|---|---|---|
| Employment disruption, SPD high v. low | Abstract | OR 4.5, 95% CI 1.4–3.8 | upper limit < OR; √(1.4 × 3.8) = 2.31, not 4.5 |
| Employment disruption, SPD high v. low | Results text | OR 4.45, 95% CI 1.44–3.75 | upper limit < OR; √(1.44 × 3.75) = 2.32, not 4.45 |
| Employment disruption, SPD high v. low | Table 2 | 4.5 (1.4–13.8) | contains OR; √(1.4 × 13.8) = 4.40 (consistent given one-decimal rounding) |
| Upper limit implied by the text's OR and L | derived | — | 4.45² / 1.44 = 13.75 (13.8 at one decimal, as in Table 2) |
| Check of the implied interval 1.44–13.75 | derived | — | √(1.44 × 13.75) = 4.450; log-SE 0.576 on both sides |
| Wald test implied by OR 4.45, L 1.44 | derived | — | z = 2.59, two-sided p = 0.0095 (from Table 2 alone: p = 0.0100) |
| Health care disruption | Abstract / Results / Table 2 | 3.2 (1.4–7.1) / 3.15 (1.41–7.05) / 3.2 (1.4–7.1) | consistent; √(L·U) = 3.153 |
| Childcare disruption | Results / Table 2 | 2.16 (0.58–8.09) / 2.2 (0.6–8.1) | consistent; √(L·U) = 2.166 / 2.205 |
| SPD at T3: the six Results-text ORs (serious and moderate T1 distress, job change, care disrupted, income < $35K, age 20–39) | Results text, Table 3 paragraph | e.g. 10.24 (4.5–23.3), 3.21 (1.4–7.6) | all consistent; √(L·U) / OR between 0.968 and 1.016 |
| Correct upper limit ÷ printed upper limit | Abstract and Results | 3.8 and 3.75 | 13.8 / 3.8 = 3.63; 13.75 / 3.75 = 3.67 |
The text interval cannot be rescued by assuming that the OR rather than the interval is wrong. Taken alone, 1.44–3.75 implies OR 2.32 and log-SE 0.244. But the OR is printed as 4.5 in the abstract and in Table 2, and as 4.45 in the text, and Table 2's interval agrees with it. The other 12 intervals all satisfy √(L·U) ≈ OR to within 3.2%. The two employment intervals in the abstract and Results text are the only exceptions, with ratios of 0.51 and 0.52 (Figure 2). Prefixing a "1" to each printed upper limit (3.75 → 13.75, 3.8 → 13.8) restores consistency exactly.
Figure
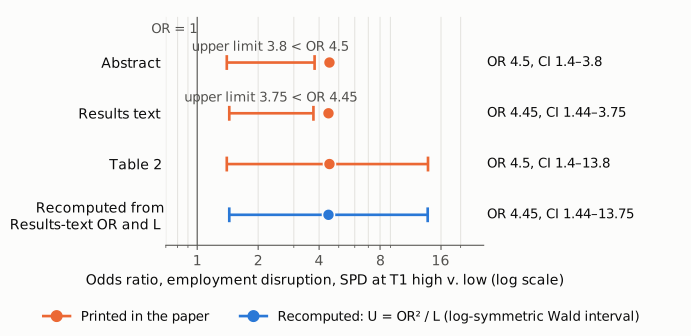
Figure 1. The odds ratio for employment disruption (working with job loss v. working, no job loss) in people with high v. low distress at T1, on a log scale. Orange rows are printed in the paper: the abstract (OR 4.5, CI 1.4–3.8), the Results text (OR 4.45, CI 1.44–3.75) and Table 2 (OR 4.5, CI 1.4–13.8). In the first two the point estimate lies to the right of the interval's upper limit. The blue row is the interval recomputed from the Results-text OR and lower limit under the log-symmetric Wald construction (U = OR² / L = 13.75). It coincides with Table 2. The thin vertical line marks OR = 1. All versions exclude 1, so significance is unaffected; what differs is the upper limit.
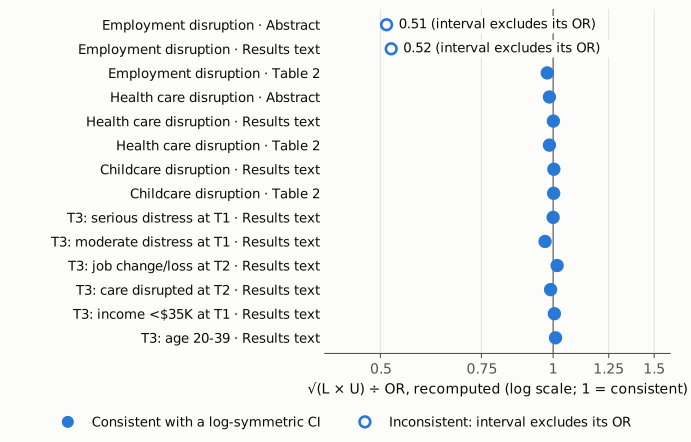
Figure 2. For each odds ratio with a 95% CI in the abstract and Results text, and for the three "High v. low" intervals in Table 2, the geometric midpoint of the printed interval divided by the printed OR (log scale; 1 means the interval is centred on its OR as a Wald interval should be). Twelve intervals lie between 0.968 and 1.016, which is what rounding produces. The abstract and Results-text intervals for employment disruption (open markers) lie at 0.51 and 0.52. This shows that the paper's intervals otherwise follow the log-symmetric convention used for the recomputation, and that the discrepancy is confined to this one estimate as printed in the text.
Why it matters
- The interval as printed is impossible, and it sits in the abstract. An estimate cannot lie outside its own 95% CI. A reader of the abstract alone cannot tell which number is wrong, the OR or the interval, without turning to Table 2.
- The precision of the association is overstated. The correct interval, about 1.4 to 13.8, is compatible with anything from a 1.4-fold to an almost 14-fold increase in the odds of job change or loss. The printed 1.4–3.8 suggests a much narrower range: on the log scale the correct interval is 2.36 times wider, and its upper limit is about 3.7 times higher.
- Evidence synthesis is the most exposed use. A meta-analyst who back-calculates a standard error from the abstract's interval would get log-SE 0.244 from its width, against 0.576 from the OR and lower limit. That would give the study far too much weight, or the entry would have to be discarded as unusable.
- The paper's conclusions are not affected. The direction of the association, its significance (p ≈ 0.01) and the point estimate are unchanged. The Discussion's qualitative statement that people with pre-pandemic SPD "were more likely than other people who were employed at the beginning of the pandemic to experience a job change" still holds. The headline T3 results (OR 10.2 for T1 SPD, 3.2 for employment disruption, 3.3 for health care disruption) and the policy conclusion are separate estimates, and their intervals are consistent.
Explanations considered
- A different model, population or contrast in the text than in Table 2. Not supported. The text describes the adjusted multinomial model of Table 2 (adjusted for gender, age, race/ethnicity and household income), among those employed, for SPD high v. low. That is the Table 2 contrast. The two other text intervals in the same sentence and paragraph (health care 3.15, 1.41–7.05; childcare 2.16, 0.58–8.09) are the Table 2 values at two decimals, so the text reports the same model.
- A non-Wald or asymmetric interval (profile likelihood, bootstrap, design-based). Not able to explain it. Any of these may be somewhat asymmetric, but none produces a 95% interval that excludes its own point estimate. The other 12 intervals in the paper are log-symmetric to within rounding.
- The OR, not the interval, is wrong. Not supported. The OR is printed three times (4.5, 4.45, 4.5), and Table 2's interval is centred on it. The text interval would imply OR 2.32, which appears nowhere in the paper.
- Rounding. Not able to explain it. Rounding changes the second decimal, not the leading digit. Rounding does account for the small gap between 13.75 (from the text's two-decimal values) and 14.46 (from 4.5² / 1.4 at one decimal); Table 2's 13.8 is 13.75 rounded.
- A text-conversion artifact in the PMC copy. Ruled out. The publisher's HTML on Cambridge Core and the typeset publisher PDF print the same numbers: 1.4–3.8 in the abstract, 1.44–3.75 in the Results and 1.4–13.8 in Table 2. Europe PMC's full-text XML matches them as well.
- Side observation, not part of the main finding. The Results sentence on childcare says "disruption of childcare at T1", whereas the stressor is measured at T2 elsewhere in the paper (abstract, Methods, Table 2 title). This is a wording slip with no numerical consequence.
Status
- Version of record. doi.org resolves to the Cambridge Core article page. The Cambridge Core HTML and the publisher PDF (9 pages; Psychological Medicine vol. 53, pp. 2418–2426, first published online 11 October 2021) print the quoted passages with the same numbers, including Table 2's "4.5 (1.4–13.8)". The Europe PMC full-text XML and the PMC page also match.
- Supplements. None exist. The Cambridge Core record lists no supplementary material, Europe PMC marks the record as having none, and the JATS XML has no supplementary-material element. Supplements therefore cannot resolve the discrepancy; Table 2 in the main text already does.
- Corrections and comments. As of 2026-10-24 I found no correction, erratum, retraction or expression of concern.
src/known.pyreturned no Crossref update relations, no PMC notices and no Europe PMC notices. The Crossref record has no update-to or updated-by entry, and a Crossref query for updates to this DOI returned none. The Cambridge Core page data lists no corrections, retractions or addenda. The PubMed record (PMID 34629132) has no CommentsCorrections entry. A web search for a correction, erratum or PubPeer discussion found nothing for this article. PubPeer itself could not be queried directly, because its site and API refused automated requests (HTTP 403). - Sources. PMC article PMC8523967; Europe PMC full-text XML for PMC8523967; Cambridge Core article page and publisher PDF via https://doi.org/10.1017/S0033291721004293; Crossref; PubMed; Europe PMC; web search.
Suggested correction
In the abstract, replace
SPD at T1 predicted disruption of employment (OR 4.5, 95% CI 1.4–3.8)
with
SPD at T1 predicted disruption of employment (OR 4.5, 95% CI 1.4–13.8)
and in the second paragraph of the Results, replace "(OR 4.45, 95% CI 1.44–3.75)" with "(OR 4.45, 95% CI 1.44–13.75)", or with the unrounded upper limit from the fitted model. These values follow from Table 2 and from the text's own OR and lower limit. The authors may also wish to change "disruption of childcare at T1" in the same paragraph to "at T2".