← Back to the plain-language case
Reported two-tailed p = 0.046 for t(18) = 1.75; that statistic gives p = 0.097
J Neurosci (2021) · doi:10.1523/JNEUROSCI.3216-18.2021 · PMC7984597
Summary
The paper reports that a high-fat diet reduced surface expression of the insulin receptor β subunit (IRβ) in the nucleus accumbens (NAc) by 21.7%, tested with a "two-tailed unpaired t test: t(18) = 1.75, p = 0.046". For t = 1.75 with 18 degrees of freedom, the two-tailed p is 0.097, and no t that rounds to 1.75 gives less than 0.096. The printed 0.046 is close to the one-tailed value (0.049), but the paper calls this test two-tailed in the Results, in the Fig. 6 legend and in the Methods. If t and df are correct, the reduction is not significant at the conventional 0.05 threshold that the figure legends use ("p < 0.05"), yet the abstract reports it as a finding and the Discussion uses it as a possible mechanism for the loss of insulin's effect after obesity.
What the paper reports
Results, section "Diet-induced obesity blunts insulin receptor-mediated increases in excitatory transmission and reduces NAc insulin receptor surface expression", second paragraph:
One potential explanation for the loss of insulin-induced increases in excitatory transmission is a reduction in NAc insulin receptor expression.
In NAc tissue from chow and high-fat groups, we found a 21.7% (±7.6%) reduction in IRβ surface expression in high-fat versus chow-fed groups (Fig. 6D; two-tailed unpaired t test: t(18) = 1.75, p = 0.046) without any changes in total IRβ (Fig. 6E).
This suggests that reductions in NAc insulin receptor expression may contribute to the loss of insulin-induced increases in eEPSC amplitude in the high-fat group.
Fig. 6 legend, title and last sentence:
High-fat diet-induced obesity results in a loss of insulin-induced increases in excitatory transmission and a reduction in NAc IRβ surface expression.
Statistical differences were determined by two-tailed unpaired t tests (A,B: **p < 0.001), two-way repeated-measures ANOVA comparing BL and treatment conditions (C: *chow group, main effect of treatment; #high-fat group, main effect of treatment, p < 0.05), and two-tailed unpaired t test (D: p = 0.046).
Materials and Methods, "Experimental design and statistical analysis":
Two-tailed t tests, one-way or two-way repeated measures ANOVAs, and Sidak's post hoc multiple comparisons tests were conducted using Prism 6-8 software (GraphPad).
Fig. 1 legend:
Data in all figures are shown as the mean ± SEM.
Abstract:
Furthermore, obesity resulted in a loss of insulin receptor-mediated increases in excitatory transmission and a reduction in NAc insulin receptor surface expression, while preserving reductions in transmission mediated by IGF receptors.
Introduction, third paragraph:
Finally, diet-induced obesity resulted in a loss of insulin-induced increases in NAc excitatory transmission and a reduction in NAc insulin receptor surface expression.
Discussion, "Loss of insulin-receptor mediated effects following obesity":
The loss of insulin-induced increases may be due in part to modest reductions in NAc insulin receptor expression, as surface expression of IRβ was reduced following high-fat diet (Fig. 6D).
A reduction in insulin receptor expression is consistent with the development of insulin resistance in the face of chronic elevations in circulating insulin resulting from obesity
What the paper's own numbers show
Method. The paper gives the test (unpaired, two-tailed), the statistic (t = 1.75) and the degrees of freedom (18). From these alone, the two-tailed p is 2·P(T₁₈ ≥ 1.75), computed with scipy.stats.t. To allow for rounding, I repeated the calculation for every t that rounds to 1.75 (1.745 to 1.755). I also computed the |t| that a two-tailed p of 0.046 would need, and the lowest two-tailed p that t = 1.75 can give at any df (the normal limit). As a check on the method, I recomputed the p values of all 36 other t and F statistics printed in the Results. Every number below is printed by recompute.py.txt.
| Quantity | Location | Reported | Recomputed |
|---|---|---|---|
| Two-tailed p, t(18) = 1.75 | Results §"Diet-induced obesity…", para 2; Fig. 6 legend (D) | p = 0.046 | 0.0971 (0.0963 to 0.0980 for t of 1.745 to 1.755) |
| One-tailed p, t(18) = 1.75 | same | not reported | 0.0486 (0.0481 to 0.0490) |
| Lowest two-tailed p for t = 1.75 at any df | derived | — | 0.0801 (df → ∞) |
| Two-tailed p for t = 1.75 at df = 9 (smallest Welch df if the 20 samples were split 10 + 10; unequal splits give lower df and higher p) | derived | — | 0.1140 |
| Absolute t needed for two-tailed p = 0.046 at df = 18 | derived | t = 1.75 | 2.143 |
| Absolute t needed for two-tailed p = 0.05 at df = 18 (critical value, α = 0.05) | derived | — | 2.101 |
| t needed for one-tailed p = 0.046 at df = 18 | derived | — | 1.780 |
| Reported p ÷ recomputed two-tailed p | derived | — | 0.474 |
| SE of the difference implied by 21.7 / 1.75 | Results | "±7.6%" | 12.40 percentage points |
| t if ±7.6 were the SE of the difference (21.7 / 7.6) | Results | t = 1.75 | 2.855 (two-tailed p = 0.0105) |
| t if both group SEMs were 7.6 | Results | t = 1.75 | 2.019 (two-tailed p = 0.0586) |
| Same comparison in bioRxiv v1 (2019) and v2 (2020) | Results, both versions | "two-tailed unpaired t-test t18 =1.75, p=0.05" (v2: "t18=1.75") | 0.0971 |
| Other 34 t and F statistics in Results | Results, Figs. 1–6 | various | all agree with the printed p after rounding |
| Fig. 3J, mEPSC amplitude with HNMPA, t(5) = 7.75 | Results, "Insulin-induced changes…" | p = 0.006 | 0.00057 (p = 0.006 would need t = 4.57) |
| Fig. 5F, (–)-naloxone alone, t(9) = 0.53 | Results, "Insulin-induced increases… disinhibition" | p = 0.53 | 0.61 (p = 0.53 would need t = 0.65) |
Rounding of t cannot close the gap: the whole rounding range gives two-tailed p of 0.096 to 0.098. Nor can any choice of degrees of freedom: with t = 1.75 the two-tailed p never falls below 0.080. The reported 0.046 is not exactly the one-tailed value either (0.049; a one-tailed 0.046 would need t = 1.78), but it is far closer to it than to the two-tailed value. Of the paper's other 36 t and F statistics, 34 match their printed p after rounding. The remaining two (Fig. 3J and Fig. 5F) have printed p values that differ from the recomputed ones, but neither difference changes whether the result is significant.
The "±7.6%" cannot settle which of t, p or the test description is wrong. The paper does not say what ±7.6% is. If it were the SE of the group difference, t would be 2.86, which does not match the printed t either. If it is the SEM of one group, expressed as a percentage of the chow mean, the other group's SEM would have to be 9.80 for t = 1.75, which is plausible. The group sizes (they must total 20 for df = 18) and the group means are not given, and there are no supplementary data.
Figure
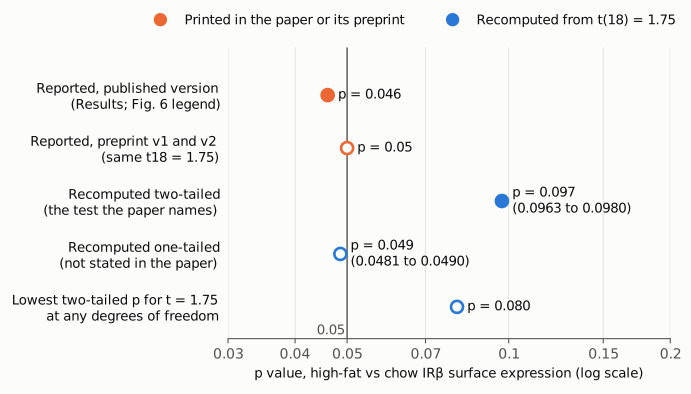
Figure 1. p values for the high-fat vs chow comparison of NAc IRβ surface expression, on a log scale. The vertical line marks 0.05. Orange: the values printed for this test, p = 0.046 in the published article (filled) and p = 0.05 in both bioRxiv versions (open), all with the same t18 = 1.75. Blue: values recomputed by recompute.py.txt from t = 1.75 and df = 18. These are the two-tailed p that the paper's stated test gives (filled), the one-tailed p (open), and the lowest two-tailed p that t = 1.75 can give at any degrees of freedom (open). The ranges in brackets cover every t that rounds to 1.75; they are narrower than the markers.
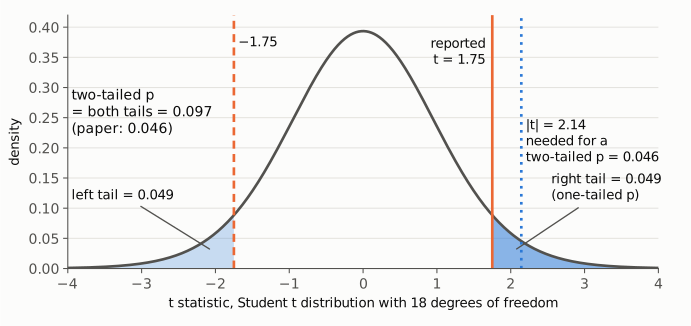
Figure 2. Where the two p values come from. The curve is the Student t density with 18 degrees of freedom. The orange solid line is the reported t = 1.75, and the orange dashed line is its mirror, −1.75. Each shaded tail beyond ±1.75 holds 0.049. The right tail alone is the one-tailed p, and both tails together are the two-tailed p, 0.097. The blue dotted line marks |t| = 2.14, the value a two-tailed p of 0.046 would need. All areas and positions come from recompute.py.txt.
Why it matters
- A finding in the abstract rests on this test. The abstract and the Introduction both list "a reduction in NAc insulin receptor surface expression" among the results of diet-induced obesity. The Results section heading and the Fig. 6 title say the same. With the stated test, t(18) = 1.75 gives p = 0.097, which does not meet the p < 0.05 criterion the figure legends use. Elsewhere the paper treats p values up to 0.04 as significant and those of 0.14 or more as not.
- It is offered as a mechanism. The Results say the reduction "may contribute to" the loss of insulin-induced increases in eEPSC amplitude after high-fat diet. The Discussion adds that it is "consistent with the development of insulin resistance". Both statements treat the reduction as established.
- The paper's other conclusions do not depend on it. The bidirectional effects of insulin receptor and IGF receptor activation, the opioid receptor-dependent disinhibition, and the loss of insulin-induced eEPSC increases after high-fat diet (Fig. 6C) all rest on separate experiments and statistics, which recompute correctly. The Discussion itself frames the receptor reduction as "modest" and as one possible cause among others ("concomitant reductions in signaling downstream of the receptor could also contribute").
- The direction is unchanged. The data still show a 21.7% lower mean in the high-fat group. Only the claim that the difference is statistically significant fails, and with it the strength of the evidence for that part of the mechanism.
Explanations considered
- Rounding of t. Does not explain it. Every t from 1.745 to 1.755 gives a two-tailed p between 0.0963 and 0.0980.
- A different degrees of freedom, or a Welch test. Does not explain it. A Welch correction can only lower df below 18, and that raises p (0.114 at df = 9, the smallest Welch df if the 20 samples were split 10 + 10; unequal splits give lower df and higher p). Even at infinite df, t = 1.75 gives a two-tailed p of 0.080.
- A one-tailed test labelled as two-tailed. This fits the numbers best: the one-tailed p is 0.049. The Results text does state a directional expectation ("One potential explanation … is a reduction"). But the paper calls this test two-tailed in three places, and a one-tailed 0.046 would need t = 1.78, so even this reading leaves a small mismatch. If the test was one-tailed, the result is significant at 0.05 only under a one-sided hypothesis that the paper never states.
- A typo in t rather than in p. Possible. A two-tailed p of 0.046 at df = 18 would need |t| = 2.14. Both bioRxiv versions print the same t18 = 1.75 with "p=0.05", and the published version changes only the p, to 0.046. So t = 1.75 appears in all three versions, while p differs between them. Without the group data this cannot be settled.
- The ±7.6% recovers the test. It does not. Read as the SE of the difference, it implies t = 2.86, which matches neither the printed t nor the printed p. Read as one group's SEM, it is compatible with t = 1.75. The paper does not say which.
- A conversion or typesetting artifact. Ruled out. The PMC text and the Europe PMC JATS XML both give "t(18) = 1.75, p = 0.046", with 18 as a subscript and ordinary decimal points, in running text rather than a table. The Fig. 6 legend repeats p = 0.046 independently. The statistic has no sign, so a lost minus could not matter for a two-tailed test.
- A general pattern of p-value errors. Not the case. The other 34 t and F statistics all recompute to their printed p. The two other mismatches (Fig. 3J and Fig. 5F, both also in bioRxiv v2; Fig. 5F's also in v1, as Figure 5D) do not change significance.
Status
- Version of record. The publisher's site (jneurosci.org, reached through the DOI) returned HTTP 403 to automated requests on 2026-10-24. The publisher-deposited full text archived in PMC (PMC7984597) and the Europe PMC JATS XML were checked instead, and both carry the same Results sentence and Fig. 6 legend. Every quotation above was checked verbatim against the PMC-archived text with
src/show.py. - Preprint. bioRxiv doi:10.1101/517797, v1 (2019-01-11) and v2 (2020-09-01). The JATS XML of v1 gives "two-tailed unpaired t-test t18 =1.75, p=0.05" for the same comparison, and v2 gives "t18=1.75, p=0.05"; both have the same "21.7% (± 7.6%)" and also call the test two-tailed.
- Supplements. The PMC record lists no supplementary material other than the article PDF. The Europe PMC XML has no supplementary-material element, and the Europe PMC record lists none. No group-level data for Fig. 6D are available, so the t test cannot be rebuilt independently.
- Corrections and comments. As of 2026-10-24 I found no correction, erratum, retraction or expression of concern.
src/known.pyreturns no Crossref update relations, no PMC notices and no Europe PMC notices. The Crossref record has no update-to or updated-by relation, and the PMC page shows no correction notice. PubPeer's search API returned HTTP 403 to automated requests, and a web search for the title together with "PubPeer" found no thread for this article. - Sources. PMC article PMC7984597; Europe PMC full-text XML for PMC7984597 (PMID 33514676); bioRxiv JATS XML for 10.1101/517797 v1 and v2; Crossref; Europe PMC; PubPeer; https://doi.org/10.1523/JNEUROSCI.3216-18.2021.
Suggested correction
The authors should check the original analysis of Fig. 6D and correct whichever element is wrong. There are three possibilities:
- If t(18) = 1.75 is correct and the test was two-tailed, the Results should read "t(18) = 1.75, p = 0.097", and the Fig. 6 legend "(D: p = 0.097)". The abstract, the Introduction summary, the Results section heading, the Fig. 6 title and the Discussion should then describe the reduction in IRβ surface expression as a non-significant trend rather than an established effect.
- If the test was one-tailed, the Results, the Fig. 6 legend and the Methods ("Two-tailed t tests") should say so, give the one-tailed p (0.049 for t = 1.75), and state the directional hypothesis in advance.
- If t was misreported, the correct t and p should be given.
In every case, the group sizes for Fig. 6D and the meaning of "±7.6%" (SEM of which quantity) should be stated. Separately, the p values for Fig. 3J (t(5) = 7.75 gives p = 0.0006, not 0.006) and Fig. 5F (t(9) = 0.53 gives p = 0.61, not 0.53) could be corrected at the same time.