← Back to the plain-language case
Abstract reports phantom-sensation scores as phantom range of motion in degrees
PNAS (2021) · doi:10.1073/pnas.2019555118 · PMC7936324
Summary
The abstract states that subjects with an agonist–antagonist myoneural interface below-knee amputation (AB, n = 15) reported "significantly greater phantom range of motion" than subjects with a traditional below-knee amputation (TB, n = 7), quantified as "AB: 12.47 ± 2.41, TB: 10.14 ± 1.45 degrees". In the body of the paper, 12.47 ± 2.41 and 10.14 ± 1.9 are the group means of the phantom sensation score, a unitless sum of 1–3 grades over foot regions. The per-subject scores in Fig. 1B reproduce these values exactly (recomputed 12.47 ± 2.42 and 10.14 ± 1.95). Phantom range of motion is a different measure: the paper reports it as a percentage of the contralateral limb, separately for each direction, and never as a single value in degrees. The abstract therefore attaches another outcome's numbers, a unit and a TB standard deviation (1.45) that none of the paper's data reproduce to one of its headline comparisons. Readers of the abstract would take the difference as about 2.3 degrees of phantom motion. It is in fact a 23% higher sensation score.
What the paper reports
The abstract:
"AB subjects reported significantly greater phantom range of motion postamputation (AB: 12.47 ± 2.41, TB: 10.14 ± 1.45 degrees) when compared to TB subjects (P < 0.05)." (Abstract)
The Results give the same means, with a different label and a different TB SD:
"AB subjects reported significantly higher phantom sensations (12.47 ± 2.41, P = 0.03) compared to TB subjects (10.14 ± 1.9) (P < 0.05, Student’s t test)." (Results, "Phantom Sensations and Pain")
The Methods define the phantom sensation score as a grade per foot region:
"Subjects were then specifically asked to relate the level of perception of their lateral and medial malleoli, heel pad, arch of the foot, balls of the footpad, and toes. The more thorough and tangible the phantom limb felt to subjects, the greater the phantom sensation scored. Responses were independently graded on a 1 to 3 scale" (Methods, "Phantom Limb Sensation")
Fig. 1B is a per-subject table. It has five region columns (Malleoli, Heelpad, Arch of foot, Balls of feet, Toes), a "Phantom Sensation Score" column and a "Phantom Pain Score" column, with summary rows:
"Average Std Dev 12.47 +/- 2.4" (AB) and "Average Std Dev 10.14 +/- 1.9" (TB) (Fig. 1B, Phantom Sensation Score column; transcribed from the version-of-record PDF)
"Phantom sensations in the AB cohort (n = 15) are significantly greater than those in the TB cohort (n = 7) (P < 0.05, Student’s t test)." (Fig. 1 legend, panel B)
Phantom range of motion (ROM) is measured and reported differently:
"Data were processed through custom scripts in MATLAB (Mathworks) to identify the maximum amplitude for each movement and normalized as a percentage of the amplitude of the contralateral limb." (Methods, "ROM Percepts")
"The demonstrated ROM of the phantom limb in each direction (PF, DF, IN, EV) were normalized as a percentage of the unaffected joints’ ROM (Fig. 2C)." (Results, "ROM Percepts")
"Further, AB subjects experienced significantly greater ROM than TB subjects following amputation for PF, DF, and EV (P < 0.05, Student’s two-tailed t test)." (Results, "ROM Percepts")
What the paper's own numbers show
Method. The 22 per-subject phantom sensation scores and pain scores were transcribed from Fig. 1B of the publisher's PDF into recompute.py.txt:
- AB scores: 14, 11, 8, 13, 15, 14, 14, 8, 13, 14, 10, 14, 14, 15, 10.
- TB scores: 8, 8, 11, 12, 13, 9, 10.
The script computes each group's mean, its sample SD (n − 1), its population SD (n) and its SEM, and runs Student’s and Welch's two-sample t tests on the raw scores and on the reported summary statistics. It also derives the possible range of the score from the number of graded regions. The Methods, the Results ("ROM Percepts") and the Fig. 2 legend were searched for any phantom ROM value expressed in degrees.
| Quantity | Location | Reported | Recomputed |
|---|---|---|---|
| AB value in the "phantom range of motion" sentence | Abstract | 12.47 ± 2.41 degrees | Equals the AB phantom sensation score: Fig. 1B mean 12.467 (187/15), SD 2.416 |
| TB value in the "phantom range of motion" sentence | Abstract | 10.14 ± 1.45 degrees | Mean equals the TB phantom sensation score: Fig. 1B mean 10.143 (71/7). SD is 1.952, not 1.45 |
| AB phantom sensation score | Results; Fig. 1B | 12.47 ± 2.41 (Fig. 1B: ± 2.4) | 12.467 ± 2.416 |
| TB phantom sensation score | Results; Fig. 1B | 10.14 ± 1.9 | 10.143 ± 1.952 |
| TB dispersion statistics that could produce 1.45 | Abstract | 1.45 | Sample SD 1.95, population SD 1.81, SEM 0.74: none equals 1.45 |
| Possible range of the phantom sensation score | Methods; Fig. 1B | 1–3 per region; 5 region columns | 5–15, with no unit (6–18 if the two malleoli were graded separately). Observed scores run from 8 to 15, and 2 AB subjects score 15 |
| Phantom ROM, the measure the abstract names | Methods and Results, "ROM Percepts"; Fig. 2C | % of the contralateral limb, per direction (PF, DF, IN, EV) | No pooled value and no value in degrees appears anywhere in the paper |
| AB − TB difference as stated in the abstract | Abstract | 12.47 − 10.14 "degrees" | 2.33 score points; ratio of the means 1.230 (23% higher score) |
| Phantom sensation test, raw Fig. 1B scores | Results | P = 0.03 (Student’s t test) | Student t = 2.220, P = 0.038; Welch t = 2.405, P = 0.030 |
| Phantom sensation test, summary statistics with TB SD 1.9 | Results | P = 0.03 | Student t = 2.243, P = 0.036; Welch P = 0.027 |
| Phantom sensation test, summary statistics with TB SD 1.45 | Abstract | P < 0.05 | Student t = 2.349, P = 0.029; Welch P = 0.011 |
Whichever SD is used, the phantom-sensation comparison remains significant at P < 0.05. (The reported P = 0.03 matches Welch's test on the raw scores, 0.030. Student's test, which the paper names, gives 0.038. Both are below 0.05.) The discrepancy lies in what the abstract's numbers are said to measure, in their unit and in the TB SD. It does not affect whether the comparison is significant.
Other observations (outside the main finding). The pain values in the text do not match Fig. 1B either. The pain score column of Fig. 1B gives AB 3.467 ± 4.96 and TB 9.286 ± 10.23 (printed summary rows: 3.46 ± 4.9 and 9.28 ± 10.2). The Results give 12.25 ± 4.9 and 17.29 ± 10.22: the SDs agree with Fig. 1B but the means do not. The abstract gives the AB pain SD as 5.37 rather than 4.9. Fig. 1B lists 7 AB subjects with a pain score of 0, and the Results say 6 of the 15 "indicated zero pain in all categories". From the reported summary statistics, the AB versus TB pain comparison gives Student P = 0.128 (SD 4.9) or 0.141 (SD 5.37), against the reported P = 0.08. The paper does not describe enough of how the pain score was built to resolve these differences, so they are listed here only for completeness.
Figure
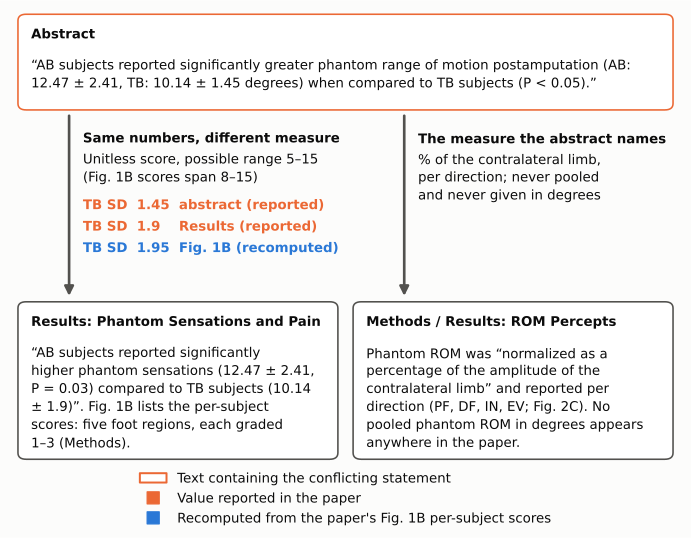
Figure 1. The abstract sentence (top, orange outline) gives "12.47 ± 2.41" and "10.14 ± 1.45 degrees" as phantom range of motion. The same means appear in the Results (bottom left) as phantom sensation scores, which are sums of 1–3 grades over the five foot regions of Fig. 1B. The possible range is 5–15 and the score has no unit. The TB SD there is 1.9, and the Fig. 1B per-subject scores give 1.95 (blue, recomputed in recompute.py.txt). Phantom range of motion, the measure the abstract names (bottom right), is reported only as a percentage of the contralateral limb, separately for each direction, and never in degrees. Orange text marks values printed in the paper, blue text marks values recomputed from the paper's own per-subject data.
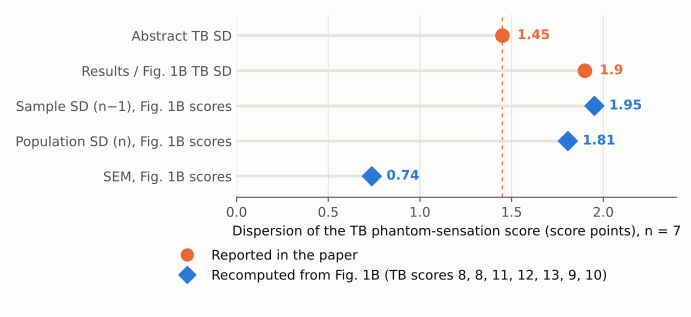
Figure 2. Dispersion of the seven TB phantom sensation scores listed in Fig. 1B (8, 8, 11, 12, 13, 9, 10). Orange circles: SDs printed in the abstract (1.45) and in the Results and Fig. 1B (1.9). Blue diamonds: the sample SD (1.95), population SD (1.81) and SEM (0.74) recomputed from the per-subject scores. The dashed line marks the abstract's 1.45. None of the recomputed statistics equals it, so the abstract's SD cannot be explained as a different summary of the same data.
Why it matters
The sentence is the abstract's only quantitative statement about phantom perception, and the paper's Significance statement and Discussion present phantom perception as a main benefit of the procedure. Read as written, the sentence tells the reader that AB subjects could perceive about 2.3 degrees more phantom joint motion than TB subjects. That would be a very small absolute range for whole-ankle motion. It would also conflict with the paper's own ROM method, which expresses ROM as a percentage of the unaffected limb. The numbers actually describe something else: AB subjects' summed phantom sensation grades were about 23% higher than TB subjects'. The abstract also gives a TB SD (1.45) smaller than the one in the Results (1.9) and the one the data support (1.95), which makes the TB group look less variable than it was.
The direction and statistical significance of both underlying findings are unaffected. In the Results, AB subjects have higher phantom sensation scores (P < 0.05 under every recomputation above), and significantly greater phantom ROM in three of the four directions (PF, DF, EV). The error is in how the abstract reports these findings. It merges two outcomes into one sentence, gives the magnitude of one under the name and a unit of the other, and leaves the actual ROM result (percent of contralateral ROM by direction) unquantified in the abstract. Anyone extracting effect sizes from the abstract, for example in a systematic review or meta-analysis of phantom limb outcomes after amputation, would record a degree-valued ROM difference that the study did not measure.
Explanations considered
- A separate pooled phantom-ROM measure in degrees exists. It does not. The Methods ("ROM Percepts") normalize goniometer amplitudes "as a percentage of the amplitude of the contralateral limb". The Results ("ROM Percepts") and Fig. 2C report ROM separately for PF, DF, IN and EV as a percentage of the unaffected joint. The paper gives no pooled mean ± SD for ROM and no value in degrees. The values 12.47 and 10.14 occur only in the phantom-sensation sentence of the Results and in Fig. 1B, apart from the abstract.
- The numbers coincide by chance. Both means match to two decimals, and so does the AB SD (2.41). Fig. 1B's per-subject phantom sensation scores reproduce them exactly (187/15 = 12.467, 71/7 = 10.143). Two measures agreeing by chance on three statistics is not a plausible explanation.
- "Degrees" is used loosely to mean "levels" or "grades". This would explain the unit but not the label. The sentence still names range of motion rather than sensation, and in this paper range of motion is a percentage. The TB SD of 1.45 would also remain unexplained.
- 1.45 is a different dispersion statistic (population SD, SEM) for the same data. The seven TB scores give a sample SD of 1.95, a population SD of 1.81 and an SEM of 0.74. None equals 1.45 (Fig. 2), and the AB SD in the same sentence (2.41) is the ordinary sample SD.
- A different time point or subgroup. Both the abstract and the Results describe the postamputation AB versus TB comparison with n = 15 and n = 7. The paper reports no other phantom-sensation or ROM summary with these means.
- A conversion or typesetting artifact in PMC. Ruled out: the publisher's typeset PDF (cover sheet: "Final published version") has the identical abstract and Results wording, and Europe PMC's full-text XML matches.
- The supplement holds the degree values. The SI Appendix (7 pages) covers methods figures, Fig. S4 (pain scores before and after surgery), Fig. S5 (correlations of fascicle strain with ROM and with phantom sensation) and Fig. S6 (F-test P values). It gives no group phantom-ROM values in degrees and no TB SD of 1.45. The five supplementary movies show ultrasound and fascicle dynamics and contain no summary numbers.
Status
- Version of record: checked. pnas.org returned HTTP 403 to automated access. The publisher's own typeset PDF was read from MIT DSpace (hdl.handle.net/1721.1/134133, marked "Version: Final published version"). Its abstract (p. 1) and Results (p. 3) wording is identical to the PMC archive, and Fig. 1B (p. 3 of 8) supplied the per-subject scores used here.
- Supplementary material: SI Appendix PDF checked (see above). Movies S1–S5 not opened, as they contain no tabulated values.
- Corrections: none found. Crossref lists no update relations, and PMC and Europe PMC list no correction, erratum, retraction or expression of concern linked to the article.
- PubPeer: not checked. pubpeer.com refused automated requests (HTTP 403 / human-verification challenge), and a web search for PubPeer threads could not be run in this session. Whether the issue has been raised there is therefore unknown.
- Sources: PMC7936324 (PubMed Central archive); doi:10.1073/pnas.2019555118 (publisher PDF via MIT DSpace); Crossref and Europe PMC metadata.
- As of: 2026-10-23.
Suggested correction
In the abstract, replace
"AB subjects reported significantly greater phantom range of motion postamputation (AB: 12.47 ± 2.41, TB: 10.14 ± 1.45 degrees) when compared to TB subjects (P < 0.05)."
with a sentence that keeps the two outcomes separate and reports the values given in the Results and Fig. 1B, for example:
"AB subjects reported significantly higher phantom sensation scores (AB: 12.47 ± 2.41, TB: 10.14 ± 1.9; P < 0.05) and significantly greater phantom range of motion, as a percentage of the unaffected limb, for plantarflexion, dorsiflexion and eversion (P < 0.05) when compared to TB subjects."
If the authors intended a different TB SD or a phantom-ROM summary in degrees, the source of 1.45 and of any degree values should be stated, since neither can be derived from the data presented. Separately, the authors could clarify how the text pain values (12.25 ± 4.9 and 17.29 ± 10.22, with 5.37 in the abstract) relate to the Fig. 1B pain scores (3.46 ± 4.9 and 9.28 ± 10.2).