← Back to the plain-language case
Hospital-stay estimate of 8.4 days lies outside its own reported 95% CI of 4.4–6.7
Kidney Int (2021) · doi:10.1016/j.kint.2021.02.026 · PMC7927648
Summary
This retrospective cohort of 152 children hospitalized with acute COVID-19 or MIS-C reports, in the Abstract, the Results and Table 4, that acute kidney injury (AKI, stages 1–3) was associated with an 8.4-day longer hospital stay, with a 95% CI of 4.4 to 6.7 and P < 0.0001, from unadjusted simple linear regression. The point estimate lies 1.7 days above the upper bound of its own interval. A regression CI is centred on its coefficient, and the stated interval is centred on 5.55. Every other row of Table 4 except one is centred on its estimate. At least one of the three printed numbers is therefore wrong, and the paper does not contain enough information to say which. The direction and statistical significance of the association survive every reconstruction considered, but the precision is overstated or the size is misstated. A second Table 4 row, for length of mechanical ventilation, is also not centred on its estimate.
What the paper reports
Abstract:
In unadjusted models, patients with acute kidney injury had 8.4 days longer hospitalizations compared to patients without acute kidney injury (95% confidence interval, 4.4-6.7).
Results, "Clinical course and outcomes", third paragraph:
In addition, patients with AKI had a significantly greater length of hospital stay of 8.4 days compared with patients without AKI (95% CI, 4.4–6.7; P < 0.0001).
Table 4, "Association of AKI with hospital outcomes", under the column header "β (95% CI)" (columns: outcome by AKI stage | β (95% CI) | P value):
Length of hospital stay, d AKI stage 1 + 2 + 3 | 8.4 (4.4 to 6.7) | <0.0001 AKI stage 2 + 3 | 5.2 (0.07 to 10.2) | 0.047 Length of PICU stay, d AKI stage 1 + 2 + 3 | 5 (0.86 to 9.1) | 0.02 AKI stage 2 + 3 | 2.3 (–3.7 to 8.3) | 0.45 Length of mechanical ventilation, d AKI stage 1 + 2 + 3 | –3.9 (–9.4 to 12.7) | 0.15 AKI stage 2 + 3 | –1.08 (–7.4 to 5.3) | 0.71
The same table gives mortality as a hazard ratio: "AKI stage 1 + 2 + 3 | 0.57 (0.03 to 11.8) | 0.72".
Methods, "Statistical analysis":
Multiple imputation was used for missing values in regression analysis. Subsequently, simple linear regression analysis was performed to assess the relationship between AKI and continuous outcomes, including PICU and hospital length of stay and length of time on mechanical ventilation.
The conclusions that draw on this result. Discussion, first paragraph:
AKI, in unadjusted models, was significantly associated with longer PICU and hospital length of stay.
Discussion, "Conclusions":
Pediatric COVID-19–related AKI, similar to reports in larger AKI studies, was associated with poor outcomes, such as increased PICU and hospital length of stay.
What the paper's own numbers show
Method. For simple linear regression the 95% CI of a coefficient is β ± t(0.975, df) × SE. It always contains β and is centred on it. A CI pooled across multiply imputed data sets with Rubin's rules has the same form, so the same holds. For each Table 4 row I checked whether the estimate lies inside its interval and computed the centre of the interval, the SE implied by its width (df = 150, from N = 152), and the P value implied by β/SE. For the hazard ratio I did the same on the log scale with a normal critical value. I then rebuilt the hospital-stay row under each assumption about which number is correct. Every number below is printed by recompute.py.txt.
| Quantity | Location | Reported | Recomputed from the paper's numbers |
|---|---|---|---|
| Hospital stay, AKI 1–3: is β inside its CI? | Abstract; Results; Table 4 | 8.4 (4.4 to 6.7) | No. 8.4 is 1.7 d above the upper bound 6.7 |
| Hospital stay, AKI 1–3: centre of the CI | Table 4 | 8.4 | 5.55 (half-width 1.15; SE from width 0.582) |
| Same row, if 8.4 and the lower bound 4.4 are right | derived | upper bound 6.7; P < 0.0001 | upper bound 12.4; SE 2.024; t = 4.15; P = 5.6 × 10⁻⁵ (consistent with P < 0.0001) |
| Same row, if 8.4 and the upper bound 6.7 are right | derived | — | lower bound 2 × 8.4 − 6.7 = 10.1, above the estimate: impossible |
| Same row, if the CI 4.4–6.7 is right | derived | β = 8.4 | β = 5.55; t = 9.54; P = 3.8 × 10⁻¹⁷ (also < 0.0001) |
| SE under the 4.4–12.4 reconstruction vs SE implied by the printed width | derived | — | 2.024 / 0.582 = 3.48 times larger |
| Hospital stay, AKI 2–3 | Table 4 | 5.2 (0.07 to 10.2), P = 0.047 | centre 5.135; P from β/SE 0.044: consistent |
| PICU stay, AKI 1–3 | Table 4 | 5 (0.86 to 9.1), P = 0.02 | centre 4.98; P 0.018: consistent |
| PICU stay, AKI 2–3 | Table 4 | 2.3 (–3.7 to 8.3), P = 0.45 | centre 2.30; P 0.45: consistent |
| Mechanical ventilation, AKI 1–3 | Table 4 | –3.9 (–9.4 to 12.7), P = 0.15 | inside, but centre +1.65; arms 5.5 below and 16.6 above; P from β/SE 0.49 (0.45 if only the 11 ventilated patients in Table 3 were analysed, df = 9): inconsistent |
| Mechanical ventilation, AKI 2–3 | Table 4 | –1.08 (–7.4 to 5.3), P = 0.71 | centre –1.05; P 0.74: consistent |
| Mortality hazard ratio, AKI 1–3 | Table 4 | 0.57 (0.03 to 11.8), P = 0.72 | geometric centre 0.595; P 0.71: consistent |
| Median hospital stay, without vs with AKI | Table 3 | acute COVID-19 2.8 vs 22.2 d; MIS-C 4.6 vs 8.2 d | differences 19.4 and 3.6 d (medians by subgroup, so they cannot reproduce the pooled β) |
Five of the seven Table 4 rows are centred on their estimates to within rounding, and their printed P values agree with the P implied by their intervals. The hospital-stay row for AKI stages 1–3 is the only one whose estimate falls outside its interval. The mechanical-ventilation row for AKI stages 1–3 is the only other row that is not centred on its estimate, and its printed P = 0.15 does not match the P implied by its interval.
A few smaller inconsistencies turned up during the comparison. None of them affects a conclusion:
| Quantity | Location | Reported | Recomputed |
|---|---|---|---|
| PICU stay, AKI 1–3 | Results text vs Table 4 | text "95% CI, 0.86–9; P = 0.025"; table "0.86 to 9.1", 0.02 | same estimate, different rounding of the bound and P |
| Acute COVID-19 group size | Table 3 vs Table 1 and Abstract | Table 3 "No AKI (N = 88)", "AKI (N = 8)" | 88 + 8 = 96; Table 1 gives 97 overall and No AKI N = 89 |
| Mechanical ventilation, acute COVID-19 with AKI | Table 3 | 2 (33.3) of N = 8 | 2/8 = 25.0% |
| Vasopressors, acute COVID-19 with AKI | Table 3 | 5 (32) of N = 8 | 5/8 = 62.5% |
Figure
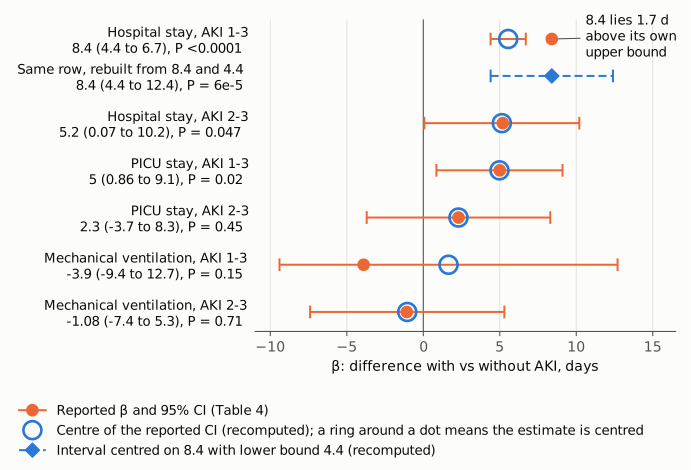
Figure 1. The six day-scale rows of Table 4 on one axis, with no effect (0 days) as the thin vertical line. Orange dots and bars are the reported β and 95% CI. Blue rings mark the centre of each reported interval, computed from its printed bounds; where the orange dot sits inside the blue ring the estimate is centred, as it must be for a linear-regression CI. For hospital stay with AKI stages 1–3 the estimate 8.4 lies outside the interval, 1.7 days above its upper bound, and the interval's centre is 5.55. The dashed blue row below it is one possible reconstruction, not a correction: the interval centred on 8.4 that keeps the printed lower bound 4.4 (4.4 to 12.4, P = 6 × 10⁻⁵). The mechanical-ventilation row for AKI stages 1–3 contains its estimate, but its centre (+1.65) is 5.55 days from the estimate.
Why it matters
The result appears in the Abstract as one of the study's main findings, in the Results text and in Table 4, and it supports the Discussion and Conclusions statements that AKI was associated with longer hospital stays. As printed, the interval is impossible. A reader cannot tell whether the effect is about 8.4 days with a wide interval (for example 4.4 to 12.4) or about 5.6 days with the narrow interval printed. The two readings differ in effect size by almost 3 days and in standard error by a factor of about 3.5.
What does not change: every reconstruction leaves the lower bound well above zero and gives P < 0.0001, so the qualitative statement that AKI was associated with a significantly longer unadjusted hospital stay is not overturned. Table 3 medians (2.8 vs 22.2 days in acute COVID-19, 4.6 vs 8.2 days in MIS-C) and the PICU-stay result (5 days, 0.86 to 9.1) point the same way. Length of stay is a secondary outcome. The paper states that "The primary outcome of this study was the incidence rate of AKI" (11.8% overall), and that result, the albumin and white-cell odds ratios, the MIS-C systolic-dysfunction comparison and the mortality result do not depend on this row.
The mechanical-ventilation row for AKI stages 1–3 is a second, smaller problem: the printed estimate, interval and P value cannot all come from one symmetric interval. It is reported as non-significant, and every value implied by its interval is non-significant too, so the paper's statement that there was no significant association with length of mechanical ventilation is not affected.
Explanations considered
- The interval is on a transformed scale (log days) and was back-transformed. This does not account for the numbers. The Methods describe simple linear regression of length of stay, Table 4 heads the column "β (95% CI)" under "Length of hospital stay, d", and no transformation is mentioned. A back-transformed interval would also still contain its back-transformed estimate. The other day-scale rows are symmetric on the raw scale.
- A bootstrap or other asymmetric interval. No such method is described, and even a percentile bootstrap interval would almost never exclude the point estimate. The other rows are symmetric, which points to Wald-type intervals.
- Multiple imputation. The Methods state that multiple imputation was used for missing values. Rubin's rules give a pooled estimate and a t-based interval centred on it, so pooling cannot place the estimate outside the interval.
- The estimate and interval were taken from different rows or models. No other row in Table 4 has the interval 4.4 to 6.7 or the estimate 8.4. The same pair appears together in the Abstract, the Results text and Table 4, so they were not misaligned in one place only.
- A conversion or typesetting artifact. This is excluded. The PMC page and the Europe PMC full-text XML, which comes from the publisher's deposit, give the same plain decimals in all three places, with no minus signs, superscripts or mid-dots that could have been lost. The table cell holds the estimate and the interval together.
- A mistyped upper bound. This is plausible but cannot be proved. If 8.4 and 4.4 are correct, the upper bound would be about 12.4, the implied SE (about 2.0) is similar to those of the PICU-stay rows (2.1 and 3.0), and the implied P (5.6 × 10⁻⁵) fits the printed P < 0.0001. The alternative reading (estimate 5.55, interval as printed) is also compatible with P < 0.0001. The published material does not distinguish them.
- For the mechanical-ventilation row, a small analysed sample. Table 3 lists only 11 ventilated patients, so the regression may have used far fewer than 152 observations. That changes the critical value but not the centre of a symmetric interval: with df = 9 the interval still centres on +1.65 and implies P = 0.45, not 0.15.
Status
- Version of record. The PMC article page and the Europe PMC full-text XML (publisher-supplied JATS) give the same figures in the Abstract, the Results and Table 4. The publisher's own pages could not be opened: doi.org redirects to linkinghub.elsevier.com, which served only a redirect stub, and kidney-international.org returned HTTP 403. Every quote above was confirmed verbatim against the PMC-archived text.
- Supplement. The only supplement, mmc1.pdf (4 pages, retrieved through the Europe PMC supplementary-files endpoint; its md5 matches the one in the PMC XML), contains Tables S1–S4: outcomes by AKI stage as medians, echocardiography in MIS-C, admission characteristics by unit, and logistic regression of baseline factors. It has no linear-regression output for length of stay and no individual-level data, so it does not resolve the error.
- Corrections and comments. As of 2026-10-23 I found no correction, erratum, expression of concern or retraction. Crossref lists no update relations for the DOI, the Crossref record that includes Retraction Watch data shows no updates, and PMC and Europe PMC list no correction notices. The only linked item is a commentary in Kidney Int 2021;100(1):16–19 (PMID 34154708, PMC8221810), which does not mention the hospital-stay estimate or its interval. A web search found no erratum and no PubPeer thread; PubPeer itself could not be queried directly (HTTP 403).
- Sources. PMC article PMC7927648; Europe PMC full text and supplementary files; Crossref REST API; PubMed; DOI resolver and publisher site (not reachable).
Suggested correction
- Re-run or re-extract the unadjusted linear regression of hospital length of stay on AKI (stages 1–3) and correct the estimate, the 95% CI or both in the Abstract, the Results text ("Clinical course and outcomes") and Table 4, together with the P value if it changes.
- Check the mechanical-ventilation row for AKI stages 1–3 in Table 4, whose estimate (–3.9), interval (–9.4 to 12.7) and P value (0.15) are mutually inconsistent, and state how many patients each length-of-ventilation model included.
- Minor: reconcile the PICU-stay interval and P value between the Results text and Table 4; correct the acute COVID-19 No AKI column size in Table 3 (88 vs 89); and check the percentages for mechanical ventilation (2 of 8) and vasopressors (5 of 8) in the acute COVID-19 AKI column of Table 3.