← Back to the plain-language case
Abstract reports 347 participants completing both evaluations; the paper's body and group counts give 281
Neurology (2021) · doi:10.1212/WNL.0000000000011089 · PMC7884983
Summary
The abstract says that "a total of 347 participants completed both time points of evaluation", meaning both the 1-year and the 5-year clinical evaluations. The body gives a different number three times: the Methods say 347 completed the 1-year visit, 348 the 5-year visit and 281 both; the Statistical Analysis section gives the longitudinal n as 281; and the Results group counts for both visits add up to 80 + 136 + 39 + 26 = 281. So the abstract's 347 is the 1-year completer count, and it overstates the paired cohort behind the abstract's 1-to-5-year decline percentages by 66 participants (23.5%) and obscures that 19.0% of the 1-year completers had no 5-year evaluation. The analyses themselves use the correct sample sizes, so no reported effect, percentage or conclusion changes.
What the paper reports
All quotations were checked verbatim against the PMC-archived text.
Abstract, Methods:
One-year and 5-year clinical evaluations included identical batteries for neurobehavioral, psychiatric, and cognitive outcomes. A total of 347 participants completed both time points of evaluation. Cross-sectional and longitudinal comparisons were assessed.
Abstract, Results (these are the longitudinal estimates the "both time points" cohort supports):
Both combat concussion groups also showed clinically significant decline from 1- to 5-year evaluation (66%–76% neurobehavioral NRS; 41%–54% psychiatric CAPS by group). Both control groups fared better but a subset also had clinically significant decline (37%–50% neurobehavioral NRS; 9%–25% psychiatric CAPS by group).
Methods, second paragraph:
Through these efforts, 575 participants have been prospectively enrolled and assessed at the acute (0–7 days, median 4, study 4) and subacute time points (0–30 days, median 7–9, study 2–3; 0–90 days, median 14, study 1), 347 of whom completed further clinical examination at 1 year and 348 at 5 years postinjury, with 281 completing both follow-up evaluations.
Methods, Statistical Analysis:
Five-year cross-sectional analysis considered the entire cohort that completed this follow-up evaluation (n = 348) while longitudinal analysis only considered those who completed both the 1-year and 5-year evaluations (n = 281).
Results, first paragraph:
At 5-year follow-up, 109 nonblast controls and 170 patients with concussive blast TBI, as well as 41 blast controls and 28 patients with nonblast TBI, completed evaluation, of which 80 nonblast controls, 136 patients with concussive blast TBI, 39 blast controls, and 26 patients with nonblast TBI completed both 1- and 5-year follow-up.
Figure 1 (CONSORT diagram, an image in the article) has a box labelled "Total completed 1-year follow-up (n = 347)" and another labelled "Total completed 5-year follow-up (n = 348)". It gives no count of participants with both visits. Table 1 (also an image) gives the 5-year group sizes in its column headers: nonblast CTL n = 109, blast-exposed CTL n = 41, concussive blast TBI n = 170, nonblast TBI n = 28.
What the paper's own numbers show
Method. I added up the group counts the paper gives for each cohort and compared each sum with the stated total and with the abstract. For the 1-year cohort I used the four study boxes in Figure 1. I also checked the logical bound that the number seen at both visits cannot exceed the number seen at either one, overall and within each group. Every number below is printed by recompute.py.txt.
| Quantity | Location | Reported | Recomputed from the paper's own numbers |
|---|---|---|---|
| Completed both 1- and 5-year evaluations | Abstract, Methods | 347 | 281 (Results 80 + 136 + 39 + 26) |
| Completed both, as stated in the body | Methods p2; Statistical Analysis | 281; n = 281 | 281 (same sum) |
| Completed 1-year evaluation | Methods p2; Figure 1 | 347; n = 347 | 347 (Figure 1 boxes 65 + 32 + 178 + 72) |
| Completed 5-year evaluation | Methods p2; Statistical Analysis; Figure 1 | 348; n = 348; n = 348 | 348 (Results and Table 1: 109 + 170 + 41 + 28) |
| Abstract minus both-visit n | Abstract vs body | — | 347 − 281 = 66 (23.5% of 281) |
| Largest possible both-visit n | derived | — | min(347, 348) = 347, reached only if every 1-year completer also had a 5-year visit |
| 1-year completers with no 5-year visit | derived | — | 347 − 281 = 66 (19.0% of 347); by group 23 / 34 / 6 / 3, sum 66 |
| 5-year completers with no 1-year visit | derived | — | 348 − 281 = 67 |
| Seen at 1 year, 5 years or both | derived | — | 347 + 348 − 281 = 414 of 575 enrolled |
| Both-visit n within each group ≤ 1-year and 5-year n | Figure 1; Results | 80, 136, 39, 26 | holds for all four groups (1-year: 103, 170, 45, 29; 5-year: 109, 170, 41, 28) |
Group order in the last two rows: nonblast controls, blast TBI, blast controls, nonblast TBI.
The body agrees with itself everywhere. The 1-year, 5-year and both-visit totals each match the sum of their components, and the per-group counts satisfy the bound. The abstract is the only place where the both-visit cohort is given as 347, and 347 is exactly the 1-year total. A both-visit count of 347 would mean that every 1-year completer also completed the 5-year visit. That contradicts the 281 stated in the Methods, which implies that 66 participants were seen at 1 year only.
Figure
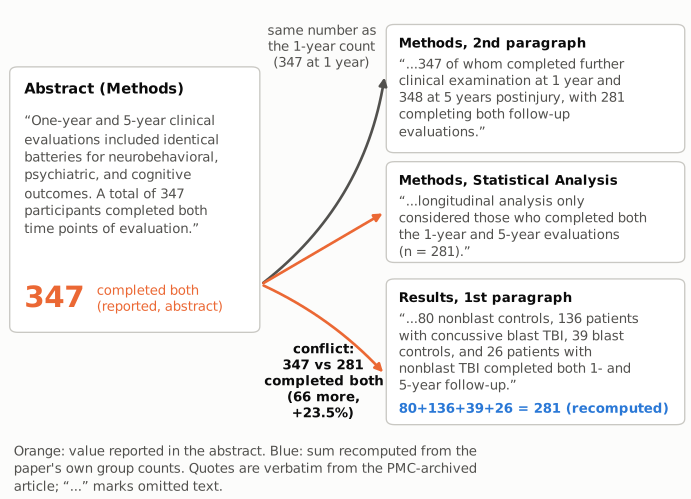
Figure 1. On the left is the abstract sentence that gives the cohort with both evaluations, with its count of 347 (orange, as reported). On the right are the three body passages that give the same cohort: the Methods study-population paragraph, the Statistical Analysis section and the first Results paragraph. The blue line is the sum of the Results group counts (80 + 136 + 39 + 26 = 281), recomputed here. The orange connectors mark the conflict: 347 in the abstract against 281 in the body, a difference of 66 participants (+23.5%). The grey connector shows that 347 is the number the Methods give for the 1-year visit alone. All quotations are verbatim, with "..." marking omitted text.
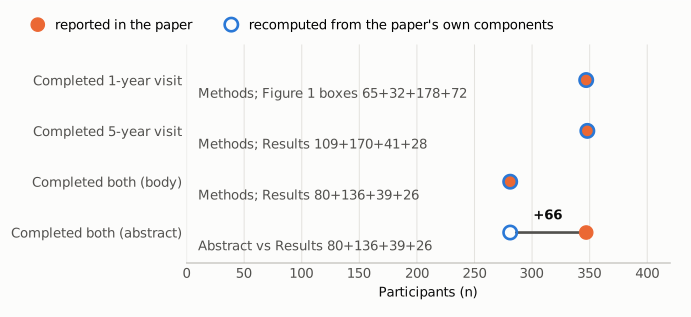
Figure 2. Cohort sizes as reported in the paper (filled orange dots) and as recomputed from the paper's own components (open blue circles), on an axis starting at zero. For the 1-year, 5-year and both-visit cohorts given in the body, the reported totals equal the sums of their parts (Figure 1 study boxes for the 1-year cohort; Results group counts for the others). The abstract's count of participants with both visits (347) sits 66 above the both-visit sum (281), at the same value as the 1-year total.
Why it matters
- The abstract misstates the size of the paired cohort. The abstract's Results give 1-to-5-year decline percentages for each group, and those percentages come from the participants seen at both visits. A reader of the abstract would take that cohort to be 347, not 281, about 23% larger than it is.
- Attrition is not visible from the abstract. With 347 "both", the abstract implies that nobody seen at 1 year was lost by year 5. In fact 66 of the 347 1-year completers (19.0%) were not in the paired cohort. Readers judging attrition bias in the longitudinal estimates need that number.
- Who could be misled. Mainly systematic reviewers and meta-analysts who take sample sizes from abstracts and could overweight the longitudinal estimates or misjudge loss to follow-up, and researchers planning follow-up cohorts. Crossref lists 17 citing works.
- What is not affected. The cross-sectional 5-year analysis used n = 348 and the longitudinal analysis n = 281, as the Statistical Analysis section states. No reported effect size, confidence interval, p value or percentage depends on the abstract's 347, and the direction and size of the findings are unchanged. The error is confined to one descriptive sentence in the abstract.
Explanations considered
- "Both time points" means a different pair of visits, such as acute and 5-year. Not supported. The sentence directly before it in the abstract names the "One-year and 5-year clinical evaluations", and the body defines the both-visit (longitudinal) cohort as the 1-year plus 5-year completers, n = 281.
- 347 is the analysed cross-sectional cohort. Not supported. The Statistical Analysis section gives the 5-year cross-sectional cohort as n = 348, which matches the Results and Table 1 group sizes (109 + 170 + 41 + 28 = 348).
- 347 is the 1-year cohort. This fits the number, but not the abstract's wording. The Methods say "347 of whom completed further clinical examination at 1 year", and the Figure 1 study boxes for the 1-year visit add up to 347. That is a count for one time point. It is not the number of participants seen at both.
- A different analysis set, population or exclusion rule. Not supported. No footnote, legend, table or Methods passage gives 347 as a both-visit count or defines an analysis set of that size. The per-group counts with both visits are given only in the Results, and they sum to 281.
- The longitudinal percentages could identify the denominator. They cannot, so they are not used as evidence here. For example, the nonblast controls' 72% / 23% / 5% (unchanged / better / worse) fits n = 80 (58 / 18 / 4) but also fits n = 109 (79 / 25 / 5).
- A text-conversion artifact. Ruled out. The number is plain text with no markup. The PMC page, the article PDF in the PMC open-access collection, the Europe PMC full-text XML and the PubMed abstract (PMID 33177226) all carry "A total of 347 participants completed both time points of evaluation."
- A correction already issued. None found (see Status).
- The 5-year counts are consistent across Figure 1, Table 1 and the Results. The 5-year total of 348 and the Table 1 group sizes include the 6 participants that Figure 1 lists as deceased before the 5-year visit (Study 1: 4 blast TBI; Study 3: 1 blast control, 1 blast TBI). The Study 2 death is marked as having occurred after the 5-year visit and is one of that study's 31. With these, the figure and table agree: blast TBI 165 + 5 = 170, blast controls 40 + 1 = 41, all groups 342 + 6 = 348.
Status
- Version of record. The publisher's page (neurology.org, reached through doi.org) returned HTTP 403 to automated requests. The check therefore rests on the publisher-deposited copies: the PMC article, the typeset article PDF in the PMC open-access collection (s3://pmc-oa-opendata/PMC7884983.1/PMC7884983.1.pdf), the Europe PMC full-text JATS XML and the PubMed abstract. All carry the passages quoted above; the PDF has the same abstract sentence ("A total of 347 participants completed both time points of evaluation") and the same Methods sentence ending "with 281 completing both follow-up evaluations". I read the Figure 1 (CONSORT) and Table 1 images from the PMC open-access copy.
- Supplements. None are attached. The JATS has no supplementary-material element, and the PMC page lists only Figures 1–4, Tables 1–2 and an author appendix table. The Data Availability statement says the data are available under data use agreements, so no public source data exist to check against. The paper's own counts are enough to settle the question.
- Corrections and comments. As of 2026-10-24 I found no correction, erratum, retraction or expression of concern.
src/known.pyreturns no Crossref update relations, no PMC notices and no Europe PMC notices. The Crossref record has empty update-to, updated-by and relation fields. The PubMed record has no CommentsCorrections entries, and a Crossref title search under the journal's prefix found only the original article. The PubPeer API returned no record (HTTP 404) for the DOI, and a web search for the title together with "PubPeer" found no thread. - Sources. PMC article PMC7884983, including the Figure 1 and Table 1 images; the article PDF in the PMC open-access collection; Europe PMC full-text XML for PMC7884983; PubMed record 33177226; Crossref; Europe PMC; PubPeer; https://doi.org/10.1212/WNL.0000000000011089.
Suggested correction
In the abstract (Methods), replace
A total of 347 participants completed both time points of evaluation.
with
A total of 281 participants completed both time points of evaluation.
The authors might instead give all three counts, as the Methods do: "347 participants completed the 1-year evaluation, 348 the 5-year evaluation, and 281 both." That wording also shows readers of the abstract how much attrition there was between visits.