← Back to the plain-language case
Adjusted odds ratio for discharge to rehabilitation, 2.45, lies outside its printed 95% CI of 0.81–1.25
Stroke (2020) · doi:10.1161/STROKEAHA.120.031217 · PMC7678670
Summary
The abstract, the Results text and Table 3 all give the adjusted odds ratio for discharge to rehabilitation among patients with stroke, with versus without COVID-19, as 2.45 (95% CI 0.81–1.25), P = 0.103. The interval does not contain its own estimate: its geometric midpoint, where a logistic-regression Wald interval puts the estimate, is 1.006. The printed estimate, lower limit and P value are consistent with each other and imply an upper limit of about 7.2–7.4, matching the width of the paper's unadjusted interval (0.75–6.38). The result stays non-significant and in the same direction, and the primary and mortality results are unaffected, but the printed interval understates the standard error about fivefold.
What the paper reports
Abstract, Results:
In patients presenting with stroke, concurrent infection with severe acute respiratory syndrome-coronavirus 2 (SARS-CoV-2) was associated with higher case-fatality (odds ratio, 10.50 [95% CI, 3.54–31.18]) and a trend towards increased occurrence of discharge to rehabilitation (odds ratio, 2.45 [95% CI, 0.81–1.25]).
Results, section "Discharge to Rehabilitation for Ischemic Stroke":
Overall, 60% (1511/2513) of patients with stroke with COVID-19 were discharged to rehabilitation, compared with 40.7% (9074/22 295) of patients with stroke without SARS-CoV-2 infection. COVID-19 was associated with a trend towards an increased frequency of discharge to rehabilitation (OR, 2.19 [95% CI, 0.75–6.38]) in unadjusted analysis. Similarly, using a logistic regression with facility fixed effects, we identified that SARS-CoV-2 infection was associated with a trend towards an increased frequency of discharge to rehabilitation (OR, 2.45 [95% CI, 0.81–1.25]), compared with noninfected individuals, albeit nonsignificant (Table 3).
Table 3, "Models Examining the Association of COVID-19 With Unfavorable Outcomes in Patients With Acute Ischemic Stroke". PMC archives this table only as a typeset image, so the values below were transcribed from that image:
Unadjusted analysis: Mortality 9.68 (3.55–26.4), P <0.001; Discharge to rehabilitation 2.19 (0.75–6.38), P 0.143
Logistic regression†: Mortality 10.50 (3.54–31.18), P <0.001; Discharge to rehabilitation 2.45 (0.81–1.25), P 0.103
†Hospital ID was used as a fixed-effects variable.
Methods, "Statistical Analysis":
For our secondary outcomes, given the limited df (relatively small number of observations), we used a step-wise logistic regression model controlling for age, sex, hypertension, hypercholesterolemia, diabetes, and peripheral vascular disease.
All results are based on 2-sided tests, and the level of statistical significance was set at 0.05.
Discussion, first paragraph:
Patients with stroke with concurrent SARS-CoV-2 infection demonstrated increased case-fatality and a trend more discharge to rehabilitation.
Conclusions:
Patients with stroke with concurrent SARS-CoV-2 infection demonstrated increased case-fatality and discharge to rehabilitation.
What the paper's own numbers show
Method. A logistic-regression Wald interval is exp(β ± 1.96·SE). It is symmetric on the log scale, so the odds ratio equals the geometric mean of the two bounds and OR² = lower × upper. I applied this check to all 20 odds ratios in Tables 2 and 3. I then rebuilt the adjusted rehabilitation interval in two ways. The first keeps the printed OR and lower bound. The second keeps the printed OR and P value. Every number below is printed by recompute.py.txt.
| Quantity | Location | Reported | Recomputed from the paper's own numbers |
|---|---|---|---|
| Does the adjusted rehabilitation CI contain its estimate? | Abstract; Results; Table 3 | OR 2.45, CI 0.81–1.25 | No: 2.45 is 1.20 above the upper limit. An OR that rounds to 2.45 is at least 2.445, and an upper limit that rounds to 1.25 is below 1.255, so rounding cannot account for the gap |
| Geometric midpoint of the printed bounds | same | (should equal 2.45) | √(0.81 × 1.25) = 1.006 |
| Upper limit implied by OR 2.45 and lower limit 0.81 | Table 3 | 1.25 | 2.45² / 0.81 = 7.41; SE 0.565; implied P = 0.113 |
| 95% CI implied by OR 2.45 and printed P = 0.103 | Table 3 | 0.81–1.25 | SE 0.550 → 0.83–7.19 |
| 95% CI if the adjusted model had the unadjusted model's SE (0.546) | Table 3 | 0.81–1.25 | 0.84–7.15 |
| Unadjusted rehabilitation OR | Results; Table 3 | 2.19 (0.75–6.38), P = 0.143 | midpoint 2.187; implied P 0.151 (consistent) |
| Unadjusted mortality OR | Results; Table 3 | 9.68 (3.55–26.4) | midpoint 9.681 (consistent) |
| Adjusted mortality OR | Abstract; Results; Table 3 | 10.50 (3.54–31.18) | midpoint 10.506 (consistent) |
| Stroke, ischemic stroke, TIA and MI ORs, 16 rows | Results; Table 2 | e.g. 0.25 (0.16–0.40); MI 0.87 (0.68–1.12), P 0.264 | all contain their estimates; midpoints match the ORs to within rounding except TIA mixed-effects (below); MI implied P values 0.274, 0.379, 0.340 vs printed 0.264, 0.382, 0.341 (MI inverse-weighted: see below) |
| Crude stroke OR | Results, "COVID-19 and Ischemic Stroke" | 0.35 (0.23–0.55) | 22/2491 vs 544/21 751 → 0.353 (0.23–0.54) |
The adjusted rehabilitation entry is the only one of the 20 checked odds ratios whose interval excludes its estimate. The two reconstructions agree closely (upper limit 7.19 vs 7.41; lower limit 0.83 vs printed 0.81), so the printed lower limit and P value fit OR 2.45, and the upper limit 1.25 is the number that does not. The reconstructed width also matches the unadjusted model's interval (0.75–6.38), as one would expect for two models fitted to the same 566 patients with few events. The exact correct upper limit cannot be fixed without the model output. A value of 7.25, which differs from 1.25 in one digit, would give a midpoint of 2.42 and an implied P of 0.109, but this is only one possibility.
Side observations (not part of the main finding).
- The abstract gives "566 (0.2%)" patients with acute ischemic stroke among 24 808 discharges. 566 / 24 808 = 2.28%.
- The rehabilitation paragraph gives 60% (1511/2513) and 40.7% (9074/22 295) "of patients with stroke". The case-fatality paragraph gives 31.8% (799/2513) and 4.6% (1026/22 295). In each case the denominators are the totals of all COVID-19-positive and COVID-19-negative discharges, not the 22 and 544 stroke patients, and every numerator is larger than the matching stroke count. The percentages fit stroke patients. For example, 7/22 = 31.8% and 25/544 = 4.6% give an unadjusted mortality OR of 9.69. Among the 15 and 519 survivors, 9/15 = 60.0% and 211/519 = 40.7% give an unadjusted rehabilitation OR of 2.19, with Wald P = 0.143 and CI 0.77–6.24. These counts are one consistent reconstruction, not the paper's data. Taken literally, the printed counts 1511/2513 vs 9074/22 295 would give OR 2.20 (2.02–2.39), an interval far narrower than the one reported.
- Table 2 and the Sensitivity Analysis give the mixed-effects TIA-only OR as 0.14 (0.10–0.38). The interval contains the estimate, but its geometric midpoint is 0.195, so it is not symmetric on the log scale the way the other rows are. Its conclusion (P < 0.001) is not in question.
- Table 2 gives the inverse-weighted MI OR as 0.84 (0.75–0.94) with P = 0.025. Across every value that rounds to the printed estimate and bounds, that interval implies a Wald P between 0.0009 and 0.0055. Both are below 0.05, so the conclusion for this row does not change.
Figure
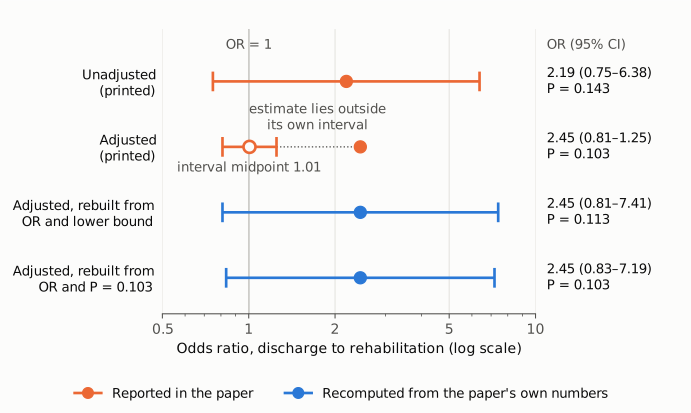
Figure 1. Odds ratios for discharge to rehabilitation, COVID-19 vs no COVID-19, among patients with ischemic stroke, with 95% CIs on a log scale. The thin vertical line marks OR = 1. Orange: the values printed in the paper. The unadjusted model is 2.19 (0.75–6.38). The adjusted model is printed as 2.45 (0.81–1.25): the filled dot is the printed estimate, the bar is the printed interval, and the open circle is the interval's geometric midpoint (1.01), where a Wald interval puts its estimate. Blue: the adjusted interval rebuilt from the paper's own numbers. The first is rebuilt from OR 2.45 and the lower limit 0.81 by log symmetry (0.81–7.41, implied P = 0.113). The second is rebuilt from OR 2.45 and the printed P = 0.103 (0.83–7.19). Both rebuilt intervals have about the same width as the unadjusted one and both include 1.
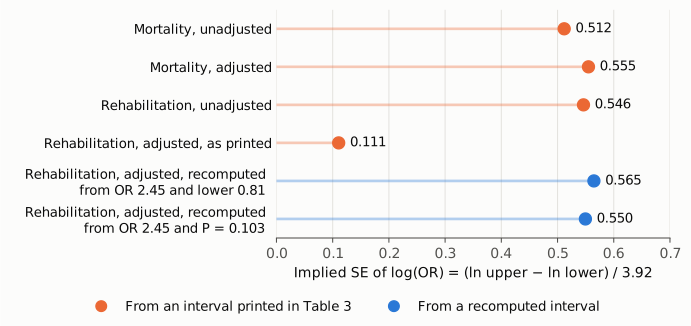
Figure 2. The standard error of log(OR) implied by each 95% CI in Table 3, computed as (ln upper − ln lower) / 3.92. Orange: intervals as printed. Blue: the two reconstructed adjusted rehabilitation intervals from Figure 1. Of the four models fitted to the same 566 stroke patients (22 with COVID-19), three imply SEs between 0.512 and 0.555; the printed adjusted rehabilitation interval implies 0.111. The reconstructed intervals imply 0.565 and 0.550, in line with the other three. The axis starts at zero.
Why it matters
- A value in the abstract is impossible as printed. The pair 2.45 (0.81–1.25) appears identically in the abstract, the Results and Table 3. A reader cannot tell from the paper which of the three numbers is wrong.
- The printed interval misstates precision. Taken at face value, 0.81–1.25 describes a fairly precise estimate close to no effect. The reconstructed interval, roughly 0.8 to 7.2–7.4, is wide and fits a comparison with only 22 COVID-19-positive stroke patients. Anyone pooling this estimate in a meta-analysis, or deriving an SE from the printed bounds, would get an SE of 0.111 instead of about 0.55–0.57, giving this study about 25 times its proper inverse-variance weight (24.7 to 26.0).
- The paper's qualitative statements on this outcome do not change. Both the printed and the reconstructed intervals include 1, and the printed P = 0.103 is above the paper's 0.05 threshold, so the abstract's "trend" wording holds. The Conclusions sentence, which says that patients "demonstrated increased case-fatality and discharge to rehabilitation", drops the word "trend". That sentence overstates a non-significant result whichever interval is correct, independent of this error.
- The main results are not affected. The primary finding (adjusted OR 0.25, 0.16–0.40, for stroke with COVID-19) and the case-fatality results (9.68 and 10.50) have internally consistent intervals and do not depend on this value.
Explanations considered
- Text-conversion or typesetting artifact in the archive. Ruled out. The same three numbers appear in the abstract, in the Results text and in the typeset image of Table 3 deposited by the publisher. No minus signs, superscripts, decimal commas or column shifts are involved.
- Rounding. Ruled out. Rounding moves a value by at most 0.005, and the gap between the estimate and the upper limit is 1.20.
- An interval method that is not symmetric on the log scale (profile likelihood, exact, bootstrap). Ruled out. In an ordinary logistic fit these methods give intervals that contain the estimate, and the printed interval does not. Of the paper's other 19 intervals, 18 are symmetric on the log scale to within rounding, so they appear to be Wald intervals.
- The interval belongs to a different model or quantity (for example, the sensitivity model with tPA and thrombectomy, or a risk difference). This does not fit the paper's own numbers. The Methods say the sensitivity models "did not change" direction and are "not reported any further". The printed P = 0.103 fits OR 2.45 with an SE of about 0.55, not the interval 0.81–1.25, which implies an SE of 0.111 and a midpoint of 1.006. An OR of 1.006 with that SE would give P = 0.96, not 0.103.
- The estimate 2.45 is the wrong number and the interval is right. Unlikely. In that case both the estimate and P = 0.103 would be wrong, since the printed interval implies P = 0.96 at its own midpoint of 1.006. The printed lower limit, the P value and the unadjusted model all agree with an OR near 2.4 and an interval about as wide as 0.8–7.3. A single mistyped upper limit accounts for every printed number.
- The supplement or a later correction gives the correct value. No. The Data Supplement contains no secondary-outcome models, and no correction was found (see Status).
Status
- Version of record. The publisher's site (ahajournals.org, full text and PDF) refused automated access (HTTP 403). The text checked is the publisher-deposited version in PubMed Central and Europe PMC (PMC7678670), including the typeset Table 3 image (str-51-3570-g004). That image was opened directly and shows "2.45 (0.81–1.25)" with P = 0.103. The abstract and the Results carry the same values.
- Supplement. The Data Supplement (str-51-3570-s001.pdf, 5 pages, from the Europe PMC supplementary-files bundle) contains Table A-I (ICD-10 definitions), Figure A-I (flowchart), Figure A-II (forest plot for the stroke-occurrence model) and Figure A-III (weekly scatterplot). It has no secondary-outcome models and does not resolve the discrepancy. No source data are deposited. The Methods say data "will be made available by contacting the corresponding author".
- Corrections and notices. None found. Crossref has no update-to or updated-by records and no relations for the DOI. PMC and Europe PMC list no correction, erratum, expression of concern or retraction for this article. The PMC record does link to an expression of concern and a retraction, but both concern a different article that this paper cites (N Engl J Med, doi:10.1056/NEJMoa2007621). They are not notices about this paper.
- PubPeer and the web. PubPeer's search endpoint refused automated access (HTTP 403). Web searches for the title and the DOI together with PubPeer, correction and erratum found no PubPeer thread or published correction. No preprint version with these results was found.
- Checked as of 2026-10-24.
Suggested correction
The adjusted odds ratio for discharge to rehabilitation should be reported with its correct 95% confidence interval in the abstract, in the Results ("Discharge to Rehabilitation for Ischemic Stroke") and in Table 3. If the printed estimate (2.45), lower limit (0.81) and P value (0.103) are right, the upper limit should be about 7.2–7.4, not 1.25. The exact value should be taken from the original model output. If another of the three numbers is the one in error, all three should be checked against that output. The Conclusions sentence "Patients with stroke with concurrent SARS-CoV-2 infection demonstrated increased case-fatality and discharge to rehabilitation" could be aligned with the abstract and Discussion, which call the rehabilitation result a non-significant trend. Separately, the denominators in the rehabilitation and case-fatality paragraphs (2513 and 22 295) and the abstract's "566 (0.2%)" (566/24 808 = 2.3%) could be checked.