← Back to the plain-language case
Zarnekow fen 2018 CO2 components imply a net source; the paper reports a net sink
Philos Trans R Soc Lond B Biol Sci (2020) · doi:10.1098/rstb.2019.0685 · PMC7485093
Summary
The paper reports eddy-covariance CO2 budgets for two rewetted fens, Hütelmoor (Hte) and Zarnekow (Zrk), during the 2018 drought and the year after. Its Abstract states that the drought "stopped the persistent net CO2 emissions of Zrk", which rests on a reported 2018 net balance (NEE) of −0.03 kg CO2 m⁻², a small net sink. The paper defines NEE as the sum of gross ecosystem productivity (GEP, negative) and ecosystem respiration (Reco), and its own Zrk 2018 sums give 3.88 − 3.72 = +0.16 kg CO2 m⁻², a net source. The Zrk 2019 sums do not add up either (+0.33 against a reported +0.06), while the Hte budget closes exactly, and the curves in Figure 3 show the same mismatch as the text. So the reported Zrk numbers cannot all be right, and which ones are wrong decides whether Zrk was a sink or a source in 2018, and how much its emissions fell in 2019.
What the paper reports
Abstract:
Altogether, the drought reduced the net CO2 sink in Hte, while it stopped the persistent net CO2 emissions of Zrk.
Methods, "Data acquisition" (the definitions that link the three quantities):
The measured net ecosystem exchange of CO2 (NEE) was partitioned into the two opposed component fluxes gross ecosystem productivity (GEP, here indicated with a negative sign) and ecosystem respiration (Reco) by modelling. Reco, the CO2 released by autotrophic and heterotrophic respiration into the atmosphere, was obtained from night-time NEE fluxes. GEP, the photosynthetic sequestration of CO2 from the atmosphere into the canopy, was then calculated from the difference between NEE and Reco.
Results, "Drought effects on carbon dioxide and methane exchange", first paragraph:
The summer drought 2018 caused new maxima in annual GEP sums of 3.58 and 3.72 kg CO2 m-2 in Hte and Zrk (figure 3a,b). These exceeded the average annual GEP totals of the reference years 2014–2017 by 22 and 86%, respectively.
GEP in Zrk, on the other hand, remained high in 2019, reaching annual sums of 3.39 kg m-2.
Same section, second paragraph:
The warm and dry conditions in 2018 also induced new maxima in the annual Reco sums, which amounted to 3.19 and 3.88 kg CO2 m-2 in Hte and Zrk (figure 3c,d). This corresponded to an increase of 35 and 56%, respectively, in comparison to reference years.
In Zrk, Reco remained at the same level in 2019 (3.72 kg CO2 m-2).
Same section, third paragraph (the net balances):
In Hte, the resulting net CO2 balance amounted to -0.39 kg CO2 m-2. Hence, Hte remained a CO2 sink though net CO2 uptake was 0.18 kg m-2 lower than in previous years (figure 3e). In Zrk, photosynthetic CO2 sequestration almost doubled in 2018 and thereby offset respiratory CO2 losses by 0.03 kg CO2 m-2 (figure 3f). Indeed, net CO2 uptake was comparatively low, but the fen had previously acted as a net CO2 source with average NEE balances of +0.34 kg CO2 m-2 [14]. In 2019, Zrk became a net CO2 source of 0.06 kg m-2 again, though CO2 emissions were considerably lower than in the years before the drought.
Same section, last paragraph:
In addition, the year after the drought revealed marked carry-over effects in Zrk: here, the newly formed vegetation persisted under climate-normal conditions with beneficial consequences for GEP and the net CO2 balance.
Figure 3 caption (excerpt):
Cumulative fluxes of CO2 and CH4 for the year of drought 2018, the post-drought year 2019 and the reference period 2014–2017. Negative signs indicate CO2 uptake from the atmosphere into the ecosystem.
Conclusion:
The drought-induced spread in vegetation can increase photosynthetic CO2 sequestration and thereby move the net CO2 budget closer towards a sink.
What the paper's own numbers show
Method. With GEP negative, the Methods' definition "GEP … calculated from the difference between NEE and Reco" means GEP = NEE − Reco, so annual NEE = GEP + Reco = Reco − |GEP|. I applied this identity to every site-year for which the text gives all three annual sums, and used Hte as a control. Each value is printed to 0.01, so rounding can move GEP + Reco − NEE by at most 3 × 0.005 = 0.015. I also back-calculated the reference-period (2014–2017) means implied by the stated percentage increases. To check whether the text matches the figure, I read the end-of-year values of the cumulative GEP, Reco and NEE curves in Figure 3 from the publisher's image (PMC open-access copy, rstb20190685-g3.jpg). I calibrated each panel's y axis from its tick marks and recorded the pixel row of each curve at its last drawn column. One pixel is 0.017 (GEP), 0.019 (Reco) and 0.009 (NEE) kg CO2 m⁻², so the summed reading error is about ±0.045. Every number below is printed by recompute.py.txt. Units are kg CO2 m⁻² yr⁻¹, and negative values mean net uptake.
| Quantity | Location | Reported | Recomputed from the paper's numbers |
|---|---|---|---|
| Hte 2018 NEE (control) | Results, 3rd para.; Fig. 3a,c,e | GEP −3.58, Reco 3.19, NEE −0.39 | 3.19 − 3.58 = −0.39; closes exactly |
| Hte 2018 drop in uptake vs reference (control) | Results, 3rd para. | 0.18 lower | reference NEE −0.571 (from +22% and +35%), so 0.181 lower; consistent |
| Zrk 2018 NEE | Results, 1st–3rd para.; Fig. 3b,d,f; Abstract | GEP −3.72, Reco 3.88, NEE −0.03 (sink) | 3.88 − 3.72 = +0.16 (source); gap +0.19 |
| Zrk 2018, rounding range | derived | — | GEP + Reco between +0.15 and +0.17; cannot round to −0.03 |
| Zrk 2018, value needed to give NEE −0.03 | derived | Reco 3.88 or GEP −3.72 | Reco 3.69 (with GEP −3.72), or GEP −3.91 (with Reco 3.88) |
| Zrk 2019 NEE | Results, 1st–3rd para. | GEP −3.39, Reco 3.72, NEE +0.06 | 3.72 − 3.39 = +0.33; gap +0.27 |
| Zrk 2019, rounding range | derived | — | +0.32 to +0.34 |
| Zrk 2019, value needed to give NEE +0.06 | derived | Reco 3.72 or GEP −3.39 | Reco 3.45 (with GEP −3.39), or GEP −3.66 (with Reco 3.72) |
| Zrk reference GEP and Reco implied by +86% and +56% | Results, 1st–2nd para. | "almost doubled" | reference |GEP| 2.000, reference Reco 2.487; 2018 GEP is ×1.86 (consistent with "almost doubled") |
| Zrk reference NEE implied by the percentages | derived | +0.34 (cited from ref. [14]) | +0.487; ref. [14] was published in 2016, so its period cannot be the full 2014–2017 reference |
| Zrk 2018 Reco if the reference NEE were +0.34 | derived | 3.88 (+56%) | reference Reco 2.340, so +56% gives 3.65, and 3.88 would be +66% |
| Figure 3 end-of-year values, Hte 2018 | Fig. 3a,c,e | — | GEP −3.59, Reco +3.18, sum −0.41; NEE curve −0.41; non-closure 0.00 |
| Figure 3 end-of-year values, Hte 2019 | Fig. 3a,c,e | GEP −2.56 (text) | GEP −2.56, Reco +2.40, sum −0.16; NEE curve −0.14; non-closure −0.02 |
| Figure 3 end-of-year values, Zrk 2018 | Fig. 3b,d,f | GEP −3.72, Reco 3.88, NEE −0.03 | GEP −3.71, Reco +3.87, sum +0.16; NEE curve −0.03; non-closure +0.19 |
| Figure 3 end-of-year values, Zrk 2019 | Fig. 3b,d,f | GEP −3.39, Reco 3.72, NEE +0.06 | GEP −3.39, Reco +3.70, sum +0.32; NEE curve +0.04; non-closure +0.28 |
| Zrk 2019 vs the earlier average of +0.34 | Results, 3rd para. | "considerably lower" | stated +0.06 is 0.28 lower; GEP + Reco +0.33 is 0.01 lower (0.16 lower than the percentage-implied reference +0.49) |
The 2019 dashed curves in Figure 3 end about one to two weeks before 31 December, so the 2019 readings are slightly early. The Zrk 2019 NEE curve is still rising at that point, which is why it reads +0.04 rather than the stated +0.06.
The Hte budget closes to within 0.02: in 2018 in both the text and the figure, and in 2019 in the figure (the text gives no 2019 Hte Reco or NEE). The Zrk budget fails to close by about 0.2 to 0.3 kg CO2 m⁻² in both years, and Figure 3 reproduces the same mismatch as the text. The mismatch is therefore not a misprint in one sentence: the cumulative Zrk GEP and Reco curves, as drawn, do not add up to the Zrk NEE curve drawn below them.
Figure
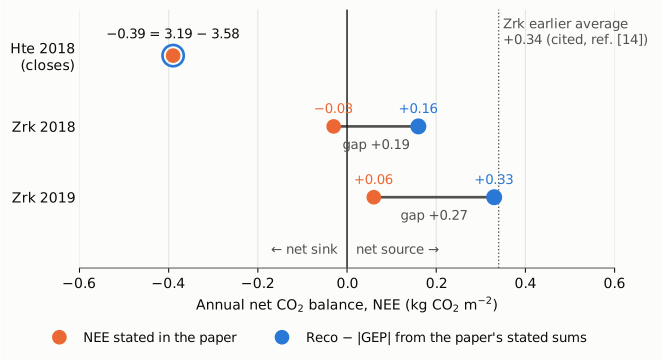
Figure 1. For each site-year in which the text states all three annual sums, the orange dot is the net CO2 balance (NEE) stated in the paper. The blue dot is Reco − |GEP| computed from the GEP and Reco sums stated in the same section. The vertical black line at zero separates a net sink (left) from a net source (right). The dotted line is the earlier Zrk average of +0.34 kg CO2 m⁻² that the paper cites from ref. [14]. For Hte 2018 the two values coincide (−0.39), so the paper's identity holds there. For Zrk 2018 the stated −0.03 is a small sink, but the stated components give +0.16, a source. For Zrk 2019 the stated +0.06 is well below the earlier average, but the stated components give +0.33, close to it.
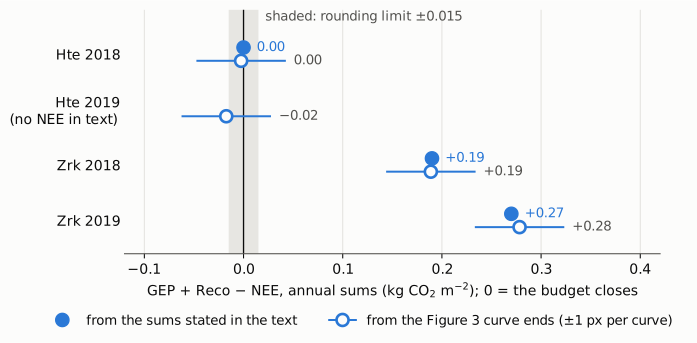
Figure 2. The non-closure GEP + Reco − NEE for each site-year, which is zero when the budget adds up. Filled blue dots use the annual sums stated in the text, where all three are given. Hollow blue dots use the end-of-year values read from the cumulative curves of the paper's Figure 3, with a ±1-pixel reading error on each curve, summed over the three. The grey band marks ±0.015, the most that rounding to two decimals can explain. Hte closes in both years. Zrk misses by +0.19 (2018) and +0.27 to +0.28 (2019), and the text and the figure agree on this.
Why it matters
The Zrk 2018 result is one of the paper's two headline CO2 findings. The Abstract says the drought "stopped the persistent net CO2 emissions of Zrk", and the Results say the GEP gain "offset respiratory CO2 losses by 0.03 kg CO2 m-2". These statements hold only if the stated NEE of −0.03 is the correct annual balance. If the stated GEP and Reco sums are correct, Zrk stayed a net CO2 source in 2018 (+0.16), although a weaker one than the +0.34 the paper cites for earlier years. The 0.19 difference changes the sign of the balance, and so whether the drought "stopped" Zrk's emissions or only reduced them.
The 2019 statement is affected by more. The paper says Zrk "became a net CO2 source of 0.06 kg m-2 again, though CO2 emissions were considerably lower than in the years before the drought", and describes "beneficial consequences for GEP and the net CO2 balance" as a carry-over effect. With the stated 2019 components (+0.33), the 2019 balance is almost equal to the cited earlier average of +0.34. Compared with the reference implied by the paper's own percentages (+0.49), it is still 0.16 lower. Which Zrk numbers are correct therefore decides whether there is a post-drought reduction in net emissions at Zrk, and how large it is.
The direction of the broader conclusion is not affected. Both candidate 2018 values (−0.03 and +0.16) lie below the earlier Zrk average, so the drought moved the Zrk budget "closer towards a sink", as the Conclusion says. The Hte results, the GEP and Reco percentage changes and the CH4 results are not affected.
Explanations considered
- Sign convention. This does not account for the numbers. The Methods give GEP a negative sign, and the Figure 3 caption says negative values mean uptake. Under either reading, NEE = Reco − |GEP| = 3.88 − 3.72 = +0.16 for Zrk 2018. The same identity reproduces the Hte 2018 balance exactly (3.19 − 3.58 = −0.39).
- Rounding. This does not account for the numbers. Rounding three values to 0.01 can explain at most 0.015, not the gaps of 0.19 and 0.27.
- A typographical error in one sentence. This does not account for the numbers. Figure 3 shows the same values as the text: the Zrk 2018 curves end at about GEP −3.71, Reco +3.87 and NEE −0.03. The mismatch also occurs in a second year (2019), in both text and figure.
- A conversion or typesetting error in the archived copy. This is excluded. The PMC-archived text, the Europe PMC full-text XML and the publisher PDF deposited in PMC all carry the same numbers, and Figure 3 is the publisher's image.
- Annual sums that do not close because of how gaps were filled. This is possible, but the paper does not say so. Supplement S1 says NEE gaps were filled with artificial neural networks (ANNs): per-year ANNs for gaps under 24 h and a single day-aggregated ANN over 2009–2018 for longer gaps. A separate ANN predicted Reco from night-time NEE, and GEP was calculated "from the difference between the measured daytime NEE and modelled Reco". If the gap-filled NEE series and the modelled Reco differ systematically at night, or if GEP is not defined over gap periods in the same way as NEE, annual GEP + Reco need not equal annual NEE. This could produce a non-closure of this size at one site. Three things count against it as a full account. The main-text Methods define GEP as the difference between NEE and Reco, which implies closure. Hte, processed in the same way, closes to within 0.02 in both years. And no legend, footnote or supplement mentions any non-closure. Even if this is the cause, the paper presents numbers that do not add up without saying so, and the difference is large enough to change Zrk's 2018 source/sink status. Which estimate (gap-filled NEE or the sum of the components) is the better annual budget would then need to be stated and justified.
- The stated percentages identify the misprinted value. This is not decisive. If the reference NEE were the +0.34 cited from ref. [14], the stated +86% and +56% would imply a 2018 Reco of about 3.65, close to the 3.69 that would give the stated −0.03. That points to Reco. But the percentages taken alone imply a 2014–2017 reference NEE of +0.49, not +0.34. Ref. [14] was published in 2016 and so cannot cover the full 2014–2017 reference period. And the Figure 3 Reco curve itself ends at about 3.87. The material available does not settle which Zrk quantity is wrong.
Status
- Version of record. The publisher's site and PDF (royalsocietypublishing.org) returned HTTP 403 to automated requests, and the PMC article page returned a challenge page. I checked the text instead in the PMC-archived copy (
src/show.py), the Europe PMC full-text XML (the publisher's JATS deposit) and the article PDF in the PMC open-access dataset (PMC7485093.1.pdf). All three carry the quoted numbers, including "3.19 and 3.88", "3.58 and 3.72", "−0.39", "0.03 kg CO2 m−2", "3.39", "3.72" and "0.06 kg m−2". Every quotation above was confirmed verbatim against the PMC-archived text. Figure 3 values were read from the publisher's image in the PMC open-access dataset (rstb20190685-g3.jpg). - Supplements. The article has one supplementary file, rstb20190685supp1.docx (PMC open-access dataset; also on figshare as rstb20190685_si_001.docx, doi:10.6084/m9.figshare.12896846). I read it. It contains S1 (flux processing, gap-filling and partitioning, meteorology, vegetation maps, MODIS EVI, Fig. S1-1), S2 (temperature and precipitation figure) and S3 (seasonal flux figure). It has no table of annual sums and no source data, and it does not say whether, or how, annual NEE, GEP and Reco are reconciled.
- Corrections and comments. As of 2026-10-24 I found no correction, erratum, expression of concern or retraction. Crossref lists no update relations for the DOI, and PMC and Europe PMC list no correction notices. A web search for corrections or comments found none. PubPeer could not be checked directly: its API returned HTTP 404 for the DOI query and its search page returned HTTP 403.
- Sources. PMC article PMC7485093; Europe PMC full-text XML for PMC7485093; PMC open-access dataset (s3://pmc-oa-opendata/PMC7485093.1/: PDF, Figure 3 image, supplement); figshare item 10.6084/m9.figshare.12896846; Crossref; Europe PMC.
Suggested correction
- Recheck the Zrk annual sums for 2018 and 2019 (GEP, Reco and NEE in the Results text and the cumulative curves in Figure 3b, d and f), and publish a consistent set. If the components are correct, the 2018 balance is about +0.16 and the 2019 balance about +0.33 kg CO2 m⁻²; if NEE is correct, Reco or GEP must change, for example Reco ≈ 3.69 in 2018 and ≈ 3.45 in 2019 at the stated GEP.
- If the non-closure is a real result of gap-filling NEE separately from the modelled Reco and GEP, state that in the Methods and the Figure 3 legend. Report its size for each site-year, say which quantity is used as the annual net balance, and explain why it is preferred.
- Revise the Abstract and Results statements that depend on the Zrk balance accordingly: "it stopped the persistent net CO2 emissions of Zrk", "offset respiratory CO2 losses by 0.03 kg CO2 m-2", and the 2019 statement that emissions "were considerably lower than in the years before the drought".
- State the period and value of the pre-drought Zrk NEE used as the comparison. The cited +0.34 (ref. [14]) differs from the +0.49 implied by the stated percentage increases over 2014–2017.