← Back to the plain-language case
Prediabetes meta-analysis reports mortality risk difference 7.36 outside its own 95% CI (9.59 to 12.51)
BMJ (2020) · doi:10.1136/bmj.m2297 · PMC7362233
Summary
The abstract and the Results both give the absolute risk difference (ARD) for all cause mortality with prediabetes in the general population as "7.36 (95% confidence interval 9.59 to 12.51)" per 10 000 person years, so the estimate lies outside its own interval. The paper derives each ARD as comparator risk × (RR − 1). Its supplement gives the comparator risk as 73.6 per 10 000 person years, and the pooled relative risk is 1.13 (1.10 to 1.17), so the ARD works out to 9.57 (7.36 to 12.51). The printed estimate and the printed lower limit have swapped places. The other seven ARDs in the paper reproduce exactly by the same method. The absolute excess mortality the abstract gives is therefore about 23% too low (7.36 rather than about 9.6 per 10 000 person years), while the pooled relative risk and the paper's conclusions are unaffected.
What the paper reports
Abstract, Results, and again word for word in Results, section "All cause mortality and cardiovascular disease associated with prediabetes in the general population", third paragraph:
Compared with normoglycaemia, the absolute risk difference in prediabetes for all cause mortality, composite cardiovascular disease, coronary heart disease, and stroke was 7.36 (95% confidence interval 9.59 to 12.51), 8.75 (6.41 to 10.49), 6.59 (4.53 to 8.65), and 3.68 (2.10 to 5.26) per 10 000 person years, respectively.
Abstract, Results, with the relative risks these ARDs are derived from:
In the general population, prediabetes was associated with an increased risk of all cause mortality (relative risk 1.13, 95% confidence interval 1.10 to 1.17), composite cardiovascular disease (1.15, 1.11 to 1.18), coronary heart disease (1.16, 1.11 to 1.21), and stroke (1.14, 1.08 to 1.20) in a median follow-up time of 9.8 years.
Methods, "Statistical analysis", which defines the calculation:
We calculated the absolute risk difference for all cause mortality and cardiovascular outcomes associated with prediabetes by multiplying the assumed comparator risk of each outcome of interest by the estimated RR-1, according to the recommendation of the Cochrane guidelines.25 We used the median risks of outcomes in individuals with normoglycaemia across studies as the assumed comparator risks. Absolute risk differences were expressed as events per 10 000 person years.
Supplementary file 15 (supplement PDF, p. 54), "Men and women" row for all cause mortality. The columns are "Event rate in normoglycaemia (No of studies)" and "Absolute risk difference":
All cause mortality 73.6 (44) 7.36 (95% CI 9.59 to 12.51)
What the paper's own numbers show
Method. Under the stated method, the estimate and both 95% limits of an ARD are the comparator risk C multiplied by (RR − 1), (RR lower − 1) and (RR upper − 1), always with the same C. Two checks follow. (1) Multiply the supplement's C by the printed relative risks. (2) Divide each printed ARD number by its (RR − 1) and see whether it gives back the supplement's C. Because the RRs are printed to two decimals, each implied C carries a tolerance, worked out by moving the RR by ±0.005. I ran both checks on all eight ARD triples in the paper: four for the general population (supplementary file 15) and four for patients with atherosclerotic cardiovascular disease (ASCVD; supplementary file 21). Every number below is printed by recompute.py.txt.
| Quantity | Location | Reported | Recomputed from the paper's own numbers |
|---|---|---|---|
| Comparator risk C, all cause mortality, general population | Supplementary file 15 | 73.6 per 10 000 PY (44 studies) | input |
| RR, all cause mortality, general population | Abstract; Results | 1.13 (1.10 to 1.17) | input |
| ARD, all cause mortality, general population | Abstract; Results; Supp. file 15 | 7.36 (9.59 to 12.51) | 9.57 (7.36 to 12.51) = 73.6 × (0.13; 0.10; 0.17) |
| Is the estimate inside its own CI? | same | 7.36 < 9.59 | no; 2.23 below the printed lower limit |
| C implied by printed estimate 7.36 / 0.13 | same | — | 56.6 (rounding range 54.5 to 58.9); does not fit 73.6 |
| C implied by printed lower limit 9.59 / 0.10 | same | — | 95.9 (rounding range 91.3 to 100.9); does not fit 73.6 |
| C implied by printed upper limit 12.51 / 0.17 | same | — | 73.6; fits |
| C implied by transposed triple 9.59 (7.36 to 12.51) | — | — | 73.8 / 73.6 / 73.6; all fit |
| RR implied by 9.59 with C = 73.6 | — | — | 1.1303, i.e. an unrounded RR that prints as 1.13 |
| ARD, composite CVD, general population (C = 58.3) | Abstract; Results | 8.75 (6.41 to 10.49) | 8.74 (6.41 to 10.49) |
| ARD, coronary heart disease, general population (C = 41.2) | Abstract; Results | 6.59 (4.53 to 8.65) | 6.59 (4.53 to 8.65) |
| ARD, stroke, general population (C = 26.3) | Abstract; Results | 3.68 (2.10 to 5.26) | 3.68 (2.10 to 5.26) |
| ARD, all cause mortality, ASCVD (C = 183.8) | Abstract; Results | 66.19 (38.60 to 99.25) | 66.17 (38.60 to 99.25) |
| ARD, composite CVD, ASCVD (C = 512.9) | Abstract; Results | 189.77 (117.97 to 271.84) | 189.77 (117.97 to 271.84) |
| ARD, coronary heart disease, ASCVD (C = 270.8) | Abstract; Results | 40.62 (5.42 to 78.53) | 40.62 (5.42 to 78.53) |
| ARD, stroke, ASCVD (C = 170.7) | Results; Supp. file 21 | 8.54 (−32.43 to 61.45) | 8.54 (−32.43 to 61.45) |
| Same, as printed in the abstract | Abstract | 8.54 (32.43 to 61.45) | lower limit is −32.43; the minus sign is missing |
| Printed numbers consistent with the supplement's C | all 8 triples | 24 numbers | 22 of 24; the two exceptions are the general-population mortality estimate and lower limit |
The method reproduces 22 of the 24 printed ARD numbers to within 0.02, which confirms that the paper's ARDs were computed exactly as its Methods describe. The only two that fail are the estimate and lower limit of a single triple, and exchanging those two makes that triple consistent too.
Figure
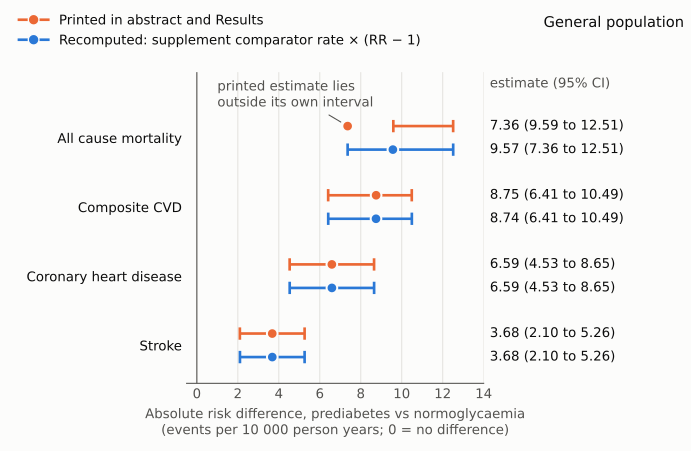
Figure 1. Absolute risk difference of prediabetes against normoglycaemia in the general population, per 10 000 person years, for the four outcomes in the abstract. Orange: the estimate and 95% CI as printed in the abstract and Results. Blue: recomputed by recompute.py.txt as the comparator event rate from supplementary file 15 × (RR − 1), using the printed relative risks and their limits. The numbers are given at the right. For composite CVD, coronary heart disease and stroke the printed and recomputed intervals coincide. For all cause mortality the printed estimate (7.36) lies to the left of its own interval, and the recomputed estimate, 9.57, lies inside the same interval, which runs from 7.36 to 12.51. The vertical line at 0 marks no difference; the axis starts at that line.
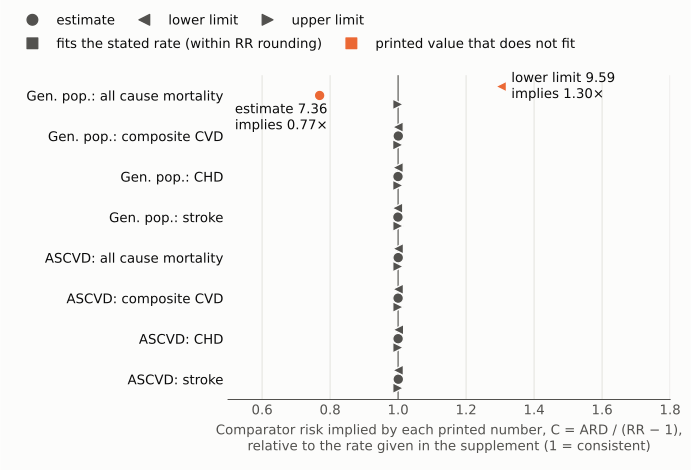
Figure 2. Each printed ARD number divided by its (RR − 1) gives the comparator risk it implies. The figure plots that implied risk as a ratio to the event rate stated in supplementary files 15 and 21, for all eight outcomes (circle: estimate; left triangle: lower limit; right triangle: upper limit). Grey markers fit the stated rate within the tolerance allowed by two-decimal rounding of the RR; all 22 of them lie at 1.00 (range 0.998 to 1.001). The two orange markers are printed values that do not fit: the general-population mortality estimate 7.36 implies 0.77 times the stated rate, and its lower limit 9.59 implies 1.30 times. Exchanging those two values puts both at 1.00.
Why it matters
- The headline absolute effect for a primary outcome is wrong in the abstract. All cause mortality is one of the two primary outcomes, and the ARD is the only absolute-scale figure the abstract gives for it. The printed estimate of 7.36 excess deaths per 10 000 person years is 23.1% lower than the 9.57 the paper's own method and inputs give. Readers who quote the absolute excess mortality from the abstract, for example in guidelines, decision aids or number-needed-to-screen calculations, will understate it.
- The printed triple cannot be used as it stands. An estimate outside its own interval shows a careful reader that something is wrong, but the text gives no way to tell which number is wrong. Two readings are plausible from the main text alone: the estimate is right and the interval is wrong (about 5.66 to 9.62), or the estimate is wrong. Only the comparator rate in supplementary file 15 settles it, in favour of the second.
- What is not affected. The pooled relative risk, 1.13 (1.10 to 1.17), its significance, and the paper's conclusions ("prediabetes was associated with an increased risk of all cause mortality and cardiovascular disease", and the remarks on screening) do not depend on this ARD. The correct interval, 7.36 to 12.51, is the one already printed, and it excludes zero.
- A second, smaller discrepancy. In the abstract, the ASCVD stroke ARD reads "8.54 (32.43 to 61.45)", which again puts the estimate outside its interval. The Results and supplementary file 21 give "−32.43", and 170.7 × (0.81 − 1) = −32.43. This one is easy to read correctly from the body text, and it matches the abstract's statement that there was "no difference" for stroke.
Explanations considered
- The estimate is right and the interval is wrong (the interval should be about 5.66 to 9.62). Not supported. This would require a comparator risk of 7.36 / 0.13 = 56.6. Supplementary file 15 gives 73.6, in the same row as the printed triple, and 56.6 lies outside the range that RR rounding allows (54.5 to 58.9).
- The estimate should be the midpoint of the printed interval (about 11.05). Not supported. ARDs are not built from symmetric intervals here, and 11.05 would require a comparator risk of 85.0, which does not match the supplement either.
- Rounding of the relative risk. Not sufficient. Varying the RR and its limits by ±0.005 moves the implied comparator risk by a few percent at most. It cannot reconcile the printed estimate (implied 56.6) or lower limit (implied 95.9) with 73.6, and the other 22 numbers fit to within 0.2%.
- A different population, model or subgroup. Not supported. The sentence and the supplement row are both "men and women" in the general population, and the sex-specific ARDs are shown separately in supplementary file 15 (men 15.80 (9.72 to 23.09); women 11.15 (6.27 to 16.03)), each with its estimate inside its interval. No other analysis in the paper reports an all cause mortality ARD of 7.36 or 9.59.
- A one-sided interval, different units or a different convention. Not supported. All ARDs are two-sided 95% CIs in events per 10 000 person years, and under the stated method an ARD for an RR above 1 lies between its limits by construction.
- A conversion artefact in the archived text. Ruled out. The same triple, without a minus sign, appears in the publisher-supplied JATS XML at Europe PMC, on the PMC page, and in the publisher's own supplement PDF. (For the ASCVD stroke value, the abstract in the publisher XML also lacks the minus sign that the Results carry.)
- Transposition of the estimate and the lower limit. This accounts for all the numbers. The triple 9.59 (7.36 to 12.51) implies comparator risks of 73.8, 73.6 and 73.6, matching the supplement. The small difference between 9.59 and 9.57 matches an unrounded RR of 1.1303, the same size as the 66.19 against 66.17 difference seen for ASCVD mortality. It describes the form the error takes; it says nothing about how it arose.
Status
As of 2026-10-24.
- Version of record. bmj.com returned HTTP 403 to automated requests, so the publisher's HTML page and PDF could not be read directly. The publisher-supplied JATS XML archived at Europe PMC (which links
bmj.m2297.pdfas its self-URI), the live PMC page and the PMC text all carry the same wording in the abstract and the Results. The same triple appears in the publisher's supplement PDF (caix056552.ww.pdf, 64 pages, from the Europe PMC supplementary-files bundle), supplementary file 15, p. 54. The error is therefore in the published source, not in conversion. - Supplements. Supplementary file 15 (p. 54) gives the general-population comparator rates, 73.6 / 58.3 / 41.2 / 26.3 per 10 000 person years, and repeats the printed ARDs. Supplementary file 21 (p. 61) gives the ASCVD rates, 183.8 / 512.9 / 270.8 / 170.7, and ARDs including stroke 8.54 (95% CI −32.43 to 61.45). The supplement resolves which number is wrong.
- Corrections. None found. Crossref shows no update-to, updated-by or relation entries, and a relation filter and a bibliographic search for a BMJ correction found nothing. PMC and Europe PMC list no notices (checked with
src/known.py), PubMed (PMID 32669282) has no CommentsCorrections entry, and the PMC page shows no correction notice. Web searches for a correction or erratum found none. - PubPeer. Web searches found no thread. The PubPeer API requires a human-verification step and could not be queried directly.
- Not checked. The bmj.com corrections and rapid-responses panels (HTTP 403), and the Europe PMC search API, which returned 503 on four attempts; the Europe PMC article XML and supplementary-file endpoints did respond. Retraction Watch was covered only through Crossref's updated-by field.
Suggested correction
In the abstract (Results) and in the Results section, "All cause mortality and cardiovascular disease associated with prediabetes in the general population", paragraph 3, and in supplementary file 15 (men and women, all cause mortality):
- Replace "7.36 (95% confidence interval 9.59 to 12.51)" with "9.59 (95% confidence interval 7.36 to 12.51)". This is the value implied by the paper's method, comparator rate 73.6 × (RR − 1) with RR 1.13 (1.10 to 1.17), which gives 9.57 from the rounded RR. The authors can confirm the exact second decimal from the unrounded RR.
In the abstract only:
- Replace "8.54 (32.43 to 61.45)" with "8.54 (−32.43 to 61.45)", matching the Results and supplementary file 21.