← Back to the plain-language case
A Discussion passage reverses the lesion–donation directions stated in the Abstract and Results
Brain (2018) · doi:10.1093/brain/awy064 · PMC7341482
Summary
The paper maps penetrating brain injuries in 94 veterans against how much money each gave away on an altruistic decision task, and its Abstract, Results, Discussion summary and Figure 3 legend agree that lesions of the dorsomedial parietal cortex (precuneus, paracentral lobule) increased donations while lesions of the right posterior middle temporal gyrus (MTG) and superior temporal sulcus decreased them. The Discussion subsection that interprets this result says the opposite for both regions ("Damage to the left medial parietal lobe decreased donations, whereas damage to the right middle temporal gyrus increased donations"), and calls left-sided a parietal effect that the Abstract calls "bilateral" and Table 3 lists for both hemispheres (12 right, 11 left subjects). The paragraph's closing interpretation follows the reversed direction, so the paper's functional reading of one of its two main findings conflicts with that finding as stated, and the figures' colour bars do not independently settle which statement is correct. No statistic depends on the wording, but no correction has been published.
What the paper reports
The direction given in the Abstract (Abstract, main finding (ii)):
altruistic donations were increased by bilateral lesions of the dorsomedial parietal cortex, whereas lesions of the right posterior superior temporal sulcus and middle temporal gyri decreased donations
The same direction in the Results (Results > Donation, paragraph 1, sentences 1–2):
Lesions that led to increased donations were restricted to the paracentral lobule and precuneus, as well as to small areas in the right dorsomedial prefrontal cortex (Fig. 3).
Injuries leading to a decrease in donations were restricted to small sectors of the right ventrolateral occipital cortex and posterior middle temporal gyrus (Fig. 3).
The same direction in the Discussion's summary of main findings (Discussion, paragraph 1):
altruistic (costly) donations were increased by bilateral lesions of the dorsomedial parietal cortex, whereas lesions of the right posterior superior temporal sulcus and middle temporal gyri had the opposite effect
The colour code of the donation map (Figure 3 legend):
Statistical β-maps of lesions that decreased (red) or increased (blue) donations on the Altruistic Decision Task.
The reversed statement (Discussion > Brain regions implicated in donations, paragraph 1, sentence 3):
Damage to the left medial parietal lobe decreased donations, whereas damage to the right middle temporal gyrus increased donations.
The interpretation that closes the same paragraph:
Overall, our findings suggest that the superomedial parietal cortex is somehow involved in the facilitation of donations, whereas the ventrolateral occipitotemporal cortex is necessary for decisions that reduce the probability of donating.
The definition of the sign of the lesion maps (Materials and methods, lesion analysis paragraph):
each with a positive or a negative sign (i.e. the variable of interest is positively or negatively correlated with the presence of a brain lesion at a specific location
What the paper's own numbers show
Method. The error concerns the direction of an effect, not a computed value. For each passage that describes the lesion–donation result, I recorded which way it says a lesion moves donations in the two regions involved: medial parietal (precuneus/paracentral) and right posterior temporal (posterior MTG, pSTS, ventrolateral occipital). I then compared each passage with Results > Donation. The closing sentence of the Discussion paragraph speaks of the function of intact regions, so I translated it with the usual lesion-deficit reading: if a region "facilitates" donations, damage to it should lower them. I checked the laterality claim against Table 3, and checked that the Table 2 subgroups add up and that their means fit their labels. To see whether the figures follow the colour code their legends give, I counted strongly red and strongly blue pixels in the relevant panels of the paper's Figs 2 and 3 as archived in PMC (the figures are not reproduced here). As a side check, I tested whether each Table 2 column sums to $60, which the task design requires (see below). Every quote and number is checked or computed in recompute.py.txt.
| Quantity | Location | Reported | Recomputed / checked |
|---|---|---|---|
| Effect of medial parietal (precuneus/paracentral) lesions on donations | Abstract (ii); Results > Donation; Discussion summary (ii) | increased | Same direction in all three passages |
| Same effect | Discussion > Brain regions implicated in donations, sentence 3 | "decreased" | Opposite to the three passages above |
| Effect of right posterior MTG/pSTS lesions on donations | Abstract (ii); Results > Donation; Discussion summary (ii) | decreased | Same direction in all three passages |
| Same effect | Discussion > Brain regions implicated in donations, sentence 3 | "increased" | Opposite to the three passages above |
| Lesion effects implied by the closing interpretation (parietal "facilitation"; occipitotemporal cortex needed to "reduce" donating) | Same paragraph, last sentence | — | Parietal lesion → fewer donations, occipitotemporal lesion → more: the same as the reversed sentence |
| Passages agreeing with Results / reversing both regions | All six passages above, Fig. 3 legend included | — | 4 agree (Results included) / 2 reverse |
| Laterality of the medial parietal effect | Abstract and Discussion summary: "bilateral"; Discussion subsection: "left" | left (subsection) | Table 3, "Dorsomedial parietal cortex (precuneus)": side R/L, 12 right / 11 left subjects (23 in all) |
| Fig. 3, medial parietal panels A, B, G: red / blue pixels | Fig. 3 | blue = increased (legend) | 0 / 562, 0 / 664, 0 / 148: blue only, so "increased" under the legend |
| Fig. 3, lateral occipitotemporal panels E, F: red / blue pixels | Fig. 3 | red = decreased (legend) | 313 / 50 and 419 / 40: mostly red, so "decreased" under the legend |
| Fig. 2 legend check: right perisylvian (A) vs medial dorsomedial prefrontal (E–G), red / blue pixels | Fig. 2; Results > Punishment (perisylvian decreased, dorsomedial prefrontal increased punishment) | red = decreased, blue = increased | 3817 / 312 and 241 / 3092: the legend code matches the Results text for punishment as well |
| Fig. 3 colour bar | Fig. 3 (labelled "Beta") | — | The end labelled 10 is dark red, RGB (140, 20, 29); the end labelled −10 is dark blue, RGB (0, 49, 96) |
| Lesion subgroup sizes (P / D / S) | Table 2 | 18+34+22+20; 43+23+28(+0); 32+25+32+5 | 94 / 94 / 94, equal to the 94 patients |
| Mean donations, D+ (n = 23) / D− (n = 28) / controls (n = 28) | Table 2 | $20.0 / $9.7 / $12.9 | D+ is 7.1 above controls and D− 3.2 below: the means fit the subgroup labels. Table 2 does not say which regions define D+ and D− |
| Side check: mean donations + punishments + savings | Table 2, P− column | 13.5 + 2.6 + 39.4 | 55.5 (55.35–55.65 under rounding), not 60 |
| Side check: same sum | Table 2, D− column | 9.7 + 4.5 + 43.8 | 58.0 (57.85–58.15), not 60 |
| Side check: same sum | Table 2, D0 and S+ columns (savings printed without decimals) | 14.7 + 4.6 + 40; 11.4 + 2.6 + 45 | 59.3 (58.70–59.90) and 59.0 (58.40–59.60): just short of 60 even allowing ±0.5 for the whole-dollar savings |
| Side check: same sum | Table 2, the other 8 columns, controls included | — | 59.6–60.0, all consistent with 60 under rounding |
Four sources agree on the direction: the Abstract, the Results, the Discussion's summary, and the Figure 3 legend read against the map colours. The Discussion subsection reverses both regions, and its closing interpretation follows that reversal.
The Table 2 sums are a separate matter and do not bear on which direction is correct. The task gives each participant $60, with 30 opportunities to donate and 30 to punish at $1 each, and pays out "$60 minus the amount you spent on donations and punishments" (supplementary instructions). Donations + punishments + savings therefore equal 60 for every participant, and so do subgroup means taken over the same participants. The P− and D− columns are well outside what rounding allows.
Figure
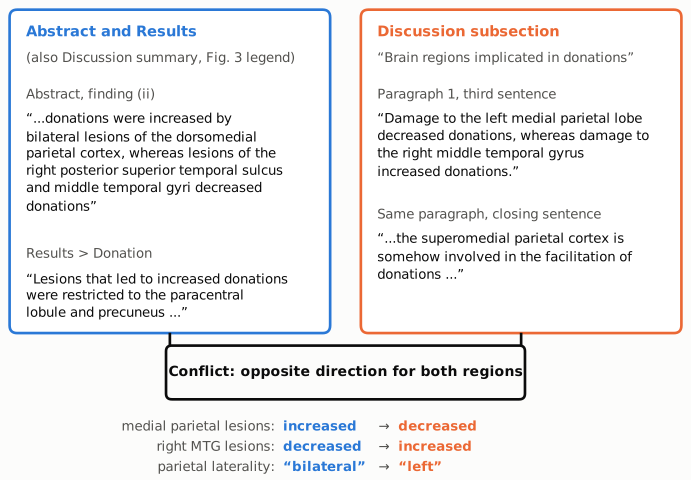
Figure 1. Short excerpts quoted from the paper. The blue panel holds the direction stated in the Abstract (finding ii) and in Results > Donation; the Discussion's opening summary and the Figure 3 legend give the same direction. The orange panel holds the Discussion subsection "Brain regions implicated in donations": its third sentence, and the closing sentence that interprets the finding. The connector names the conflict. In the subsection, lesions in both regions have the opposite effect on donations, and the parietal effect, "bilateral" in the Abstract, becomes "left".
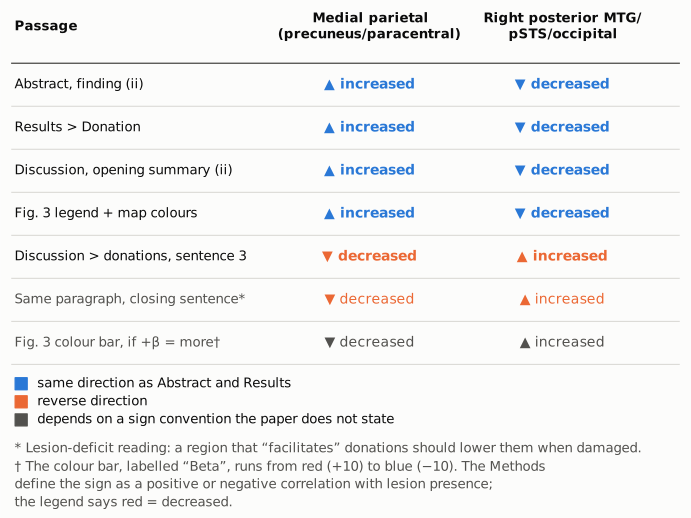
Figure 2. The direction each passage gives for the effect of a lesion on donations, by region. Blue marks the direction stated in the Abstract and Results; orange marks the reverse. The first four rows agree. The Discussion sentence reverses both regions, and so does the paragraph's closing interpretation when read in the usual lesion-deficit way (italic, because the direction is inferred rather than stated). The grey bottom row is conditional: it shows what Figure 3 would say if its colour bar (red = +10, blue = −10, labelled "Beta") were read with the Methods' definition, under which a positive sign means that a lesion goes with more donations. That reading would agree with the Discussion sentence and not with the legend. The paper does not say how β was signed for display (see Explanations considered).
Why it matters
- It concerns one of the paper's two main findings. The donation map is finding (ii) in the Abstract and in the Discussion summary. The subsection "Brain regions implicated in donations" is the only place where the paper interprets this finding, and there the reader is told the opposite of the Abstract and Results for both regions.
- The functional interpretation follows the reversed version. The closing statement, that the superomedial parietal cortex is "involved in the facilitation of donations" and the ventrolateral occipitotemporal cortex is "necessary for decisions that reduce the probability of donating", matches the reversed sentence, not the Results. If parietal lesions increase donations, as the Abstract says, the standard lesion-deficit inference is that the intact parietal region restrains giving, the opposite of facilitating it. As printed, the paper's conclusion about what these regions do and its headline result point in opposite directions, and a reader citing either one cannot tell from the text which is intended.
- The laterality also changes. The subsection calls the parietal effect left-sided. The Abstract and Discussion summary say "bilateral", and Table 3 lists the precuneus region with 12 right-hemisphere and 11 left-hemisphere subjects.
- What does not change. No statistic, p-value or effect size depends on these sentences. The paper's broader conclusion, that "altruistic punishment and donation are determined by largely non-overlapping cerebral regions", holds whichever direction is correct. The punishment findings are stated consistently in the Abstract, the Results and the Fig. 2 legend.
Explanations considered
- A different sign convention in the subsection. The reversed sentence uses the same wording as the Results ("Damage to ... decreased donations"), with the same outcome (number of donations), the same patients and the same analysis. No passage introduces a convention under which the words would change meaning, such as describing intact tissue or a deficit score. Does not account for it.
- An isolated slip in one sentence. If only one sentence were wrong, the closing interpretation in the same paragraph would be expected to follow the Results. It follows the reversed sentence instead: "facilitation of donations" by the superomedial parietal cortex implies that parietal damage lowers donations. Two statements in the subsection therefore share the reversed direction. Does not account for it as a one-word typo, although the problem is confined to this subsection.
- The figures settle which version is right. Read with their legends (red = decreased, blue = increased), Figs 2 and 3 agree with the Abstract and Results. For punishment the legend code also matches the Results text: right perisylvian clusters are red ("decreased punishment") and dorsomedial prefrontal clusters blue ("increased"). The legends of Supplementary Figs 1 and 2 use the same code ("red and blue indicate less and more, respectively"; "increased donations (blue) and decreased donations (red)"). However, the colour bars of Figs 2 and 3 are labelled "Beta" and run from red at +10 to blue at −10, and the Methods say the sign of the maps reflects whether the score "is positively or negatively correlated with the presence of a brain lesion". Read literally, that makes red mean "lesion associated with more donations", which is the opposite of the legend. On that reading the Discussion sentence would match the maps, and the Abstract, Results and legends would be reversed for donations and punishment alike. The paper does not say whether the displayed β was sign-flipped. The figures do not independently settle the question. All the text and every legend point one way; only the colour-bar label, combined with the Methods' sign definition, points the other.
- Table 2 settles it. The subgroup means fit their labels (D+ $20.0, D− $9.7, controls $12.9), but Table 2 does not say which regions define D+ and D−, and Table 3 lists the donation regions without a direction. Neither table resolves it.
- A conversion artefact in the PMC copy. The publisher's HTML and typeset PDF and the Europe PMC full-text XML all contain the same sentences. Only words are involved, so minus signs, superscripts and table alignment play no part. Does not account for it.
- For the Table 2 side observation: rounding or differing denominators. One-decimal rounding can move a three-term sum by at most 0.15, or by up to 0.6 when a savings mean is printed as a whole number. The P− (55.5) and D− (58.0) columns are outside this range. The sums could differ from 60 if some participants were missing one of the three measures, so that the means were taken over different sets of people, but the paper reports a single n per subgroup and does not mention missing data. A transcription error in one cell per affected column would also explain it; the paper gives no way to tell which cell. Not resolved by the published material.
Status
As of 2026-10-23:
- Version of record. The publisher's page (doi:10.1093/brain/awy064, which resolves to academic.oup.com/brain/article/141/5/1558/4953518) and the publisher-typeset PDF ("BRAIN 2018: 141; 1558–1569") contain the same Abstract finding (ii), Results > Donation text, Discussion summary, reversed Discussion sentence and closing interpretation as the PMC archive. Table 2 in the typeset PDF has the same values. The Europe PMC full-text XML has identical wording. The discrepancy is in the version of record.
- Supplements. The single supplementary file (task instructions, list of organisations, Supplementary Tables 1–2, legends of Supplementary Figs 1–2) does not describe the lesion–donation directions in words beyond the subgroup labels ("D + : lesions increased donations"; "D ‒ : lesions decreased donations"). Its figure legends use the same colour code as the main figures. The instructions confirm that payout equals $60 minus donations and punishments.
- Corrections. Crossref lists no update relations. PubMed Central and Europe PMC list no correction, erratum or retraction notices. The publisher's page shows none.
- PubPeer and the web. The PubPeer search page returned HTTP 403 (checked again on 2026-10-23), so PubPeer could not be checked directly. Web searches made during this audit for the title or DOI combined with "PubPeer", "correction", "erratum" or "corrigendum" returned only the article itself, institutional listings and press coverage. A further search could not be run on 2026-10-23 because the search quota was exhausted.
- Sources. PMC7341482 (archived full text, figure images); publisher HTML and typeset PDF (version of record); Europe PMC full-text XML; Crossref metadata; the supplementary PDF (awy064_brain-2017-01334-file008.pdf).
Suggested correction
Ask the authors to state the sign convention used to display the β-maps in Figs 2 and 3, check it against the underlying maps, and correct whichever passages disagree with it.
If the Abstract, Results and figure legends are correct, the Discussion subsection "Brain regions implicated in donations" could read, for example: "Damage to the medial parietal lobe (bilaterally) increased donations, whereas damage to the right posterior middle temporal gyrus decreased donations." The closing interpretation would then need to be revised to match: on the usual lesion-deficit reading, the intact superomedial parietal cortex would be associated with restraining donations, and the right ventrolateral occipitotemporal cortex with supporting them.
If instead the colour bars are correct and the legends reversed, the Abstract (findings i and ii), the Results, the Discussion summary and the figure legends would all need correcting.
Separately, the authors could check the P−, D−, D0 and S+ columns of Table 2, whose mean donations, punishments and savings should sum to $60.