← Back to the plain-language case
Results text swaps the two condition means for tic frequency, reversing the reported reduction
Curr Biol (2020) · doi:10.1016/j.cub.2020.04.044 · PMC7308804
Summary
In study 3 (16 people with Tourette syndrome), the Results say that rhythmic median nerve stimulation (MNS) "significantly reduced" tic frequency. The same sentence then gives mean tic counts of 87.6 ± 71.4 for no stimulation and 126.3 ± 94.5 for rhythmic MNS, which as printed is a 44.2% increase. The processed data the paper deposits on OSF give exactly these two values with the conditions the other way round: 87.625 ± 71.41 under MNS and 126.25 ± 94.49 without stimulation, a 30.6% reduction. The direction stated in the abstract, highlights, Figure 5 and Discussion is therefore supported, and the error is a label swap in one sentence. Recomputing the tests from the same deposited data turns up a separate problem: the printed t values (2.36, 2.41, 1.83) cannot be reproduced (1.99, 2.05, 1.41). The tic-frequency and tic-intensity effects reach p < 0.05 only under the one-tailed tests the Methods specify.
What the paper reports
Results, "Effect of Rhythmic MNS on the Occurrence of Tics and the Urge-to-Tic", second paragraph:
Quantitative analysis revealed that compared with comparable time periods of no stimulation, rhythmic MNS significantly reduced both tic frequency (i.e., total number of tics recorded over a total period of 4 min) and tic intensity (i.e., the independently, blind, rated intensity of each tic) (means for tic frequency: no stimulation = 87.6 ± 71.4, rhythmic MNS = 126.3 ± 94.5; t(15) = 2.36, p = 0.03, Figure 5 left; means for tic intensity: no stimulation = 3.0 ± 0.6, rhythmic MNS = 2.8 ± 0.6; t(15) = 2.41, p = 0.03, Figure 5 middle).
The same paragraph, next sentence:
quantitative analysis of the continuous self-estimated urge-to-tic data showed an overall reduction in the self-estimated urge-to-tic during MNS of ∼33%, the difference between rhythmic MNS and no stimulation was only marginally significant (means for self-estimated tic-to-tic intensity: no stimulation = 41.3 ± 31.7, rhythmic MNS = 29.1 ± 20.7; t(15) = 1.83, p = 0.09, Figure 5 right).
The same paragraph, on the correlation:
These analyses revealed a positive correlation (r = 0.75, R2 = 0.56, F = 12.74, p = 0.005), indicating that a reduction in tic frequency was associated with a reduction in self-estimated urge-to-tic experiences
Abstract:
it nonetheless leads to a large reduction in tic frequency and tic intensity in individuals with TS.
Highlights:
Mu-band entrainment significantly reduces motor and vocal tics in Tourette syndrome
Discussion, fourth paragraph:
This quantitative analysis clearly demonstrated that both tic frequency and tic intensity were significantly reduced by rhythmic 10 Hz MNS compared with no stimulation
STAR Methods, "Quantification and Statistical Analysis":
In all four studies, statistical analyses were performed using one-tailed paired-samples t tests.
STAR Methods, "Data and Code Availability":
Processed data of tic frequencies, tic intensities, and urge intensities are available on OSF (https://osf.io/zw93x/).
What the paper's own numbers show
Method. First I took the printed means, SDs and t values at face value and worked out the direction of change, the relative change, and the p values that t(15) implies. Then I opened the processed data the paper deposits on OSF (Study3_data.xlsx, dated 2020-04-17). It has one row per participant (n = 16) and three outcome columns, TICS, INTENSITY and SLIDER, each split into "Rhythmic" and "No Stimulation". From it I recomputed the condition means and SDs, the paired t tests (one- and two-tailed), a Wilcoxon signed-rank test, and the correlation reported in the same paragraph. The means and SDs I recomputed equal the AVERAGE and SD rows stored in the spreadsheet itself. recompute.py.txt holds the outcome values only, without participant codes or demographic columns, and prints every number below.
| Quantity | Location | Reported | Recomputed |
|---|---|---|---|
| Tic frequency, no stimulation | Results, study 3, para 2 | 87.6 ± 71.4 | 126.25 ± 94.49 (OSF data, n = 16) |
| Tic frequency, rhythmic MNS | same | 126.3 ± 94.5 | 87.625 ± 71.41 (OSF data) |
| Change, MNS minus no stimulation | same ("significantly reduced") | +38.7 tics as printed, a 44.2% increase | −38.6 tics, a 30.6% reduction (OSF data; also (126.3 − 87.6)/126.3 = 30.6% with the printed labels exchanged) |
| Medians, no stimulation vs MNS | OSF "median" row | — | 105 vs 67.5; fewer tics under MNS in 12 of 16 participants |
| Tic intensity, no stim vs MNS | Results, study 3, para 2 | 3.0 ± 0.6 vs 2.8 ± 0.6 | 2.97 ± 0.56 vs 2.76 ± 0.56 (consistent; labels correct) |
| Urge-to-tic, no stim vs MNS | Results, study 3, para 2 | 41.3 ± 31.7 vs 29.1 ± 20.7, df 15 | 43.06 ± 31.67 vs 29.10 ± 20.73, n = 13 (3 participants have no slider data); reduction 32.4% (text: "∼33%") |
| p from the printed t, df 15 | Results, study 3, para 2 | p = 0.03, 0.03, 0.09 | two-tailed 0.032, 0.029, 0.087; one-tailed 0.016, 0.015, 0.044 |
| Paired t, tic frequency | same | t(15) = 2.36 | t(15) = 1.99; one-tailed p = 0.032, two-tailed p = 0.065 |
| Paired t, tic intensity | same | t(15) = 2.41 | t(15) = 2.05; one-tailed p = 0.029, two-tailed p = 0.058 |
| Paired t, urge-to-tic | same | t(15) = 1.83 | t(12) = 1.41; one-tailed p = 0.092, two-tailed p = 0.184 |
| Wilcoxon signed-rank, tic frequency | not reported | — | one-sided p = 0.022, two-sided p = 0.044 |
| SD of paired differences, tic frequency | implied by printed t | 65.6 (= 38.7 × √16 / 2.36) | 77.5 |
| Correlation of reductions, tics vs urge | Results, study 3, para 2 | r = 0.75, R² = 0.56, F = 12.74, p = 0.005 | r = 0.748, R² = 0.560, F(1,10) = 12.74, p = 0.0051 (proportional reductions; n = 12, as one no-stimulation urge value is 0) |
Three points follow from the table.
- The tic-frequency means are attached to the wrong conditions. The printed pairs 87.6 ± 71.4 and 126.3 ± 94.5 match the deposited "Rhythmic" (87.625 ± 71.41) and "No Stimulation" (126.25 ± 94.49) values to every printed digit, but with the labels exchanged. Pairing cannot reverse the sign of a mean difference, so the printed values describe an increase and cannot support "significantly reduced". The tic-intensity and urge values carry the correct labels.
- The deposited file is the dataset the paper analysed. It reproduces the printed correlation exactly (r = 0.75, R² = 0.56, F = 12.74, p = 0.005), the "∼33%" urge reduction (32.4%), and the printed SDs of all six condition columns.
- The printed t values do not follow from the deposited data. Paired t tests on the deposited data give 1.99, 2.05 and 1.41, against the printed 2.36, 2.41 and 1.83. The printed p values (0.03, 0.03, 0.09) match the one-tailed p values of the recomputed tests (0.032, 0.029, 0.092), which is what the Methods specify. The same printed p values also happen to match the two-tailed p values of the printed t (0.032, 0.029, 0.087). As a numerical observation, and not as an account of how they arose, each printed t equals, to two decimals, the t whose two-tailed p equals the one-tailed p of the deposited data (2.36 and 2.41 at df 15, 1.83 at df 12). For the urge measure the printed degrees of freedom (15) also differ from the 12 that the 13 complete pairs allow, and the printed no-stimulation mean (41.3) differs from the deposited 43.06, although the SD (31.7) matches.
Figure
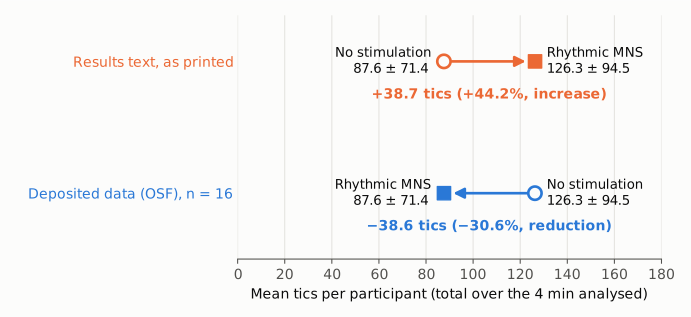
Figure 1. Mean tic count per participant (total over the 4 min of video analysed), drawn as an arrow from the no-stimulation condition (open circle) to the rhythmic MNS condition (filled square). Top row (orange): the values printed in the Results text, which put MNS 38.7 tics, or 44.2%, above no stimulation. Bottom row (blue): the same quantities recomputed from the processed data deposited on OSF (n = 16), which give the same two numbers with the conditions exchanged, so MNS is 38.6 tics, or 30.6%, below no stimulation. Labels show mean ± SD. The axis starts at zero.
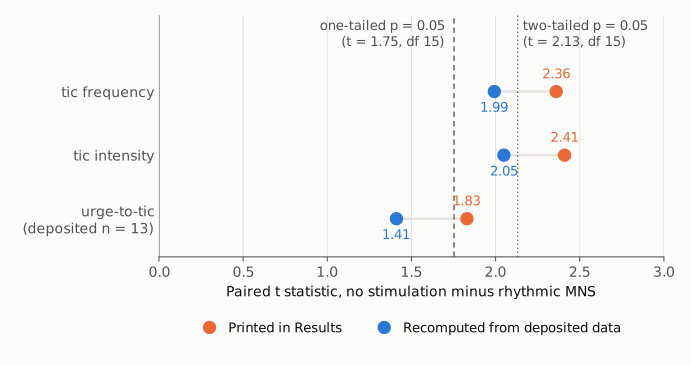
Figure 2. Paired t statistics for the three study 3 outcomes: as printed in the Results (orange), and recomputed from the deposited data with a paired t test (blue). The dashed and dotted lines mark the one-tailed and two-tailed p = 0.05 critical values at df 15. The urge-to-tic data have 13 complete pairs (df 12), with critical values 1.78 and 2.18. Recomputed, the tic-frequency and tic-intensity effects clear only the one-tailed threshold, which is the test the Methods specify. The axis starts at zero, the null value.
Why it matters
- The headline efficacy number is printed backwards. Tic frequency is the study's main clinical outcome, and it is the basis for the abstract's "large reduction in tic frequency". A reader of the Results paragraph, or anyone extracting the means for a meta-analysis or a power calculation, gets a 44% increase under MNS instead of a 31% reduction. A pooled estimate built from the printed numbers would carry the wrong sign.
- The conclusion itself stands. The deposited data, the Figure 5 legend ("Shown on the top left are data for tic frequency as measured by the total number of tics recorded in each condition (p < 0.05)") and every summary statement agree on a reduction. Correcting the labels restores agreement within the paper.
- The strength of the evidence is weaker than the printed t values suggest. Recomputed from the deposited data, the tic-frequency and tic-intensity effects are significant only one-tailed (p = 0.032 and 0.029). Two-tailed they are not (0.065 and 0.058). A nonparametric test on tic frequency gives a two-sided p of 0.044. The one-tailed choice is stated in the Methods, so the printed p values are consistent with the stated analysis, but the printed t values are 1.18, 1.18 and 1.30 times the recomputed ones. This is separate from the label swap and does not change any stated conclusion. Readers weighing the result may still want to know about it.
Explanations considered
- A different measure, in which more counts mean fewer tics. Not supported. The sentence defines tic frequency as the "total number of tics recorded over a total period of 4 min". A larger count is more tics.
- A different subset or time window. Not supported. The Methods restrict the video analysis to the last 40 s of each 60 s epoch and say this "did not change the effects observed". Both the text and the deposited file have n = 16, and the deposited values match the printed means and SDs exactly except for the labels.
- The deposited data, not the text, carry the wrong labels. Not supported. With the deposited labels, the direction agrees with the paper's own Figure 5 tic-frequency panel (the no-stimulation column lies higher), with its legend, abstract, highlights, Discussion and Conclusion, and with the correctly labelled intensity and urge columns. The deposited file also reproduces the printed correlation exactly.
- A text-conversion artifact. Ruled out. The values are plain decimals in running text, and the Europe PMC full-text XML and the PMC HTML carry the same sentence. No superscript, sign or table structure is involved that a conversion could scramble.
- Pairing or a signed t statistic. Cannot explain it. In a paired design the mean of the differences equals the difference of the means, so no pairing structure turns 87.6 → 126.3 into a reduction. The printed t is unsigned.
- For the t-value discrepancy: a one-tailed test, or a different sidedness. Sidedness cannot explain it, because it changes p and not t. The printed p values agree with one-tailed tests on the deposited data, but the printed t values do not match the paired tests on the deposited data. Unpaired Student and Welch tests give even smaller values (1.30, 1.03 and 1.33), so a different test type does not reproduce them either. I do not attempt to explain how the printed t values arose.
- A correction already issued. None found (see Status).
Status
- Version of record. The publisher's pages (doi.org → linkinghub, ScienceDirect, cell.com) returned only redirects or HTTP 403 to automated requests. The publisher-supplied full text in the Europe PMC full-text XML for PMC7308804 and in the live PMC HTML gives the sentence exactly as quoted. Every quotation above was checked verbatim against the PMC-archived text with
src/show.py. - Supplements and data. The OSF project cited in the paper (osf.io/zw93x) lists Study1_script.m, Study2_data.xlsx, Study2_scripts.zip, Study3_data.xlsx, Study4_data.zip and Study4_scripts.zip.
Study3_data.xlsxholds the study 3 tic data used above, and the other files concern studies 1, 2 and 4. I did not examine the in-article supplements (Videos S1–S3, Table S1, Figure S2). They are described as video clips and a regression on symptom severity, and none of them reports the condition means. A copy of the accepted manuscript in an institutional repository returned HTTP 403 and was not checked. - Corrections and comments. As of 2026-10-24 I found no correction, erratum, retraction or expression of concern.
src/known.pyreturns no Crossref update relations, no PMC notices and no Europe PMC notices. Crossref's only relation is a has-review link to an F1000 recommendation. PubMed (PMID 32502412) lists only a "Comment in" entry, a commentary in Curr Biol 2020;30(12):R698–R700 that is not a correction. The DOI does not appear in the Retraction Watch dataset. The PubPeer API returned no record (HTTP 404) for the DOI, and a web search for the title together with "PubPeer" found no thread. - Sources. PMC article PMC7308804; Europe PMC full-text XML; OSF project zw93x (
Study3_data.xlsx); Crossref; PubMed; Retraction Watch dataset; PubPeer; https://doi.org/10.1016/j.cub.2020.04.044.
Suggested correction
In the Results, section "Effect of Rhythmic MNS on the Occurrence of Tics and the Urge-to-Tic", replace
means for tic frequency: no stimulation = 87.6 ± 71.4, rhythmic MNS = 126.3 ± 94.5
with
means for tic frequency: no stimulation = 126.3 ± 94.5, rhythmic MNS = 87.6 ± 71.4
The authors may also wish to check the three t statistics in the same paragraph against the deposited data. Paired tests on Study3_data.xlsx give t(15) = 1.99 for tic frequency, t(15) = 2.05 for tic intensity and t(12) = 1.41 for the urge-to-tic (13 complete pairs), with one-tailed p = 0.032, 0.029 and 0.092. They may also wish to check the urge-to-tic no-stimulation mean (printed 41.3; deposited 43.06). Stating "one-tailed" next to each p value in the Results would help readers.