← Back to the plain-language case
Figure 5A's key drug-effect statistic, F(1,6) = 3.7, gives p = 0.10, not the printed 0.024
eLife (2019) · doi:10.7554/eLife.47870 · PMC6728144
Summary
The Figure 5A legend reports that the Kv1.4 antagonist UK-78,282 suppresses spiking in nucleus accumbens neurons from low-motivation (lowS) rats, with "Main drug effect: F(1,6) = 3.7, p=0.024". An F of 3.7 on (1, 6) degrees of freedom has an upper-tail P of 0.103, and p = 0.024 would need F ≈ 9.0. With 1 numerator degree of freedom, no choice of error df brings P below 0.054. The matching highS statistic in the same legend, and every other F test in the Figure 5 section, recompute correctly. This is the only statistic with values reported for the within-lowS drug effect on firing (the asterisk in Figure 5B appears to mark the lowS vs highS comparison under drug). That effect underpins the claim that the drug suppresses firing "selectively" in lowS neurons, which the Figure 5 title, a Results subheading and the Discussion all rely on.
What the paper reports
Figure 5 legend, title and panel A:
NAc neurons from lowS animals are uniquely sensitive to Kv1.4 antagonist, UK-78,282.(A) Action potential frequency was measured after application of UK-78,282 (100 nM) and expressed as percent change from frequency before UK-78,282 in the same cell (n = 7, N = 4/group). UK-72,282 suppresses firing in the lowS group to levels significantly different from baseline (Main drug effect: F(1,6) = 3.7, p=0.024, two-way RM ANOVA). In the highS group, firing after UK-72,282 application is not significantly different from baseline (Main drug effect: F(1,6) = 0.99, p=0.36, two-way RM ANOVA).
(The legend spells the compound "UK-72,282" in these two sentences and "UK-78,282" everywhere else. This looks like a separate typo and does not affect the statistics.)
Figure 5 legend, panel B:
(B) Firing frequency-current relationship highlights decreased action potential output in the lowS group after UK-78,282 application (*, p<0.05, two-way RM ANOVA).
This legend gives no F, df or exact P. The Results text (below) gives the Figure 5B statistic as a between-group effect under drug, "Main group effect: F(1,12)=5.819, p=0.032". Its error df of 12 fits 7 + 7 cells in two groups, not a within-lowS comparison of 7 cells (error df 6). So the Figure 5B asterisk most likely marks lowS vs highS in the presence of the drug, not lowS before vs after the drug. It is not a second test with reported values for the lowS drug effect.
Results, section "Kv1.4 channels modulate SPN excitability selectively in lowS animals":
The overall effect of acute application of UK-78,282 (100 nM) was to suppress action potential output in lowS, but not highS, SPNs (Figure 5A). This differential effect reversed the excitability profile of lowS relative to highS neurons such that in the presence of UK-78,282, lowS SPNs fired fewer action potentials than highS SPNs (Figure 5B, [Main group effect: F(1,12)=5.819, p=0.032] two-way RM ANOVA); cf. Figure 4A).
Discussion, "Selective effect of UK-78,282 on lowS Kv1.4":
The compound selectively suppressed action potential firing in the lowS group, but was equally efficacious at blocking the peak of A-type currents in both lowS and highS animals.
Discussion, opening paragraph:
Suppression of Kv1.4 activity by UK-78,282 selectively decreases SPN spiking and facilitates motivated behavior in subjects with a lower baseline motivation for reward.
Materials and methods, Statistics:
Data were reported as mean ± standard error of the mean and statistical significance thresholds were set at p<0.05.
What the paper's own numbers show
Method. An ANOVA F statistic on (d1, d2) degrees of freedom has P = Pr(F_{d1,d2} ≥ F), the upper tail of the F distribution. With d1 = 1 this equals the two-sided t-test P for t = √F on d2 df. The legend gives n = 7 cells per group, so a within-cell main drug effect in one group's two-way repeated-measures ANOVA has df (1, 6), which is the df printed. I computed P for every F statistic printed in Figure 5, its supplements and the Kv1.4 Results section, plus the other F tests in the paper as a check on the convention (scipy, recompute.py.txt).
| Quantity | Location | Reported | Recomputed |
|---|---|---|---|
| lowS main drug effect, F(1,6) = 3.7 | Figure 5 legend (A) | p = 0.024 | P = 0.1028 |
| Range of P for any F that rounds to 3.7 (3.65–3.75), df (1,6) | Figure 5 legend (A) | — | 0.101 to 0.105 |
| F needed for p = 0.024 at df (1,6) | Figure 5 legend (A) | F = 3.7 | F = 9.00 (8.91–9.10 for p 0.0235–0.0245) |
| Critical F(1,6) at α = 0.05 | — | — | 5.99 |
| Smallest possible P for F = 3.7 with d1 = 1, any error df | — | — | 0.0544 (chi-square limit) |
| One-sided P for F(1,6) = 3.7 | Figure 5 legend (A) | — | 0.0514 |
| highS main drug effect, F(1,6) = 0.99 | Figure 5 legend (A) | p = 0.36 | 0.358 (consistent) |
| Group effect under drug, F(1,12) = 5.819 | Results, Kv1.4 section (Fig 5B) | p = 0.032 | 0.0328 (consistent) |
| IA lowS drug effect, F(1,12) = 14.03 | Results, Kv1.4 section (Fig 5D) | p = 0.0028 | 0.0028 (consistent) |
| IA highS drug effect, F(1,13) = 17.19 | Results, Kv1.4 section (Fig 5D) | p = 0.001 | 0.00115 (consistent) |
| IA midS drug effect, F(1,6) = 6.39 | Figure 5—figure supplement 2 legend (F) | p = 0.045 | 0.0448 (consistent) |
| τ lowS, t(17) = 3.5 | Results, Kv1.4 section (Fig 5E) | p = 0.003 | 0.0027 (consistent) |
| τ highS, t(13) = 0.35 | Results, Kv1.4 section (Fig 5E) | p = 0.73 | 0.732 (consistent) |
| Firing group effect, F(1,215) = 22.52 (not part of this claim) | Results, spike-output section (Fig 4A) | p = 0.01 | 3.8 × 10⁻⁶ (inconsistent; conclusion unchanged) |
| Total K⁺ group effect, F(1,13) = 0.12 (not part of this claim) | Results, spike-output section (Fig 4F) | p = 0.31 | 0.735 (inconsistent; conclusion unchanged) |
| FR group effect, F(1,42) = 2.13 (not part of this claim) | Results, Figure 1F | p = 0.1 | 0.152 (inconsistent at printed precision; conclusion unchanged) |
The behavioural F tests for Figure 6 recompute to within rounding: breakpoints lowS F(2,21) = 9.5, P = 0.0012 (reported 0.001); midS F(2,25) = 0.198, P = 0.822 (0.82); highS F(2,21) = 0.5, P = 0.614 (0.64); interaction F(4,32) = 5.1, P = 0.0027 (0.003). Small rounding mismatches occur elsewhere: besides Figure 1F above, Figure 4E prints F(1,12) = 0.04 with p = 0.83, while any F that rounds to 0.04 gives P between 0.836 and 0.855 (recomputed 0.845). These do not change any conclusion. So the paper otherwise uses standard upper-tail F P values with the printed df, and the lowS Figure 5A pair is the outlier in its section.
Figure
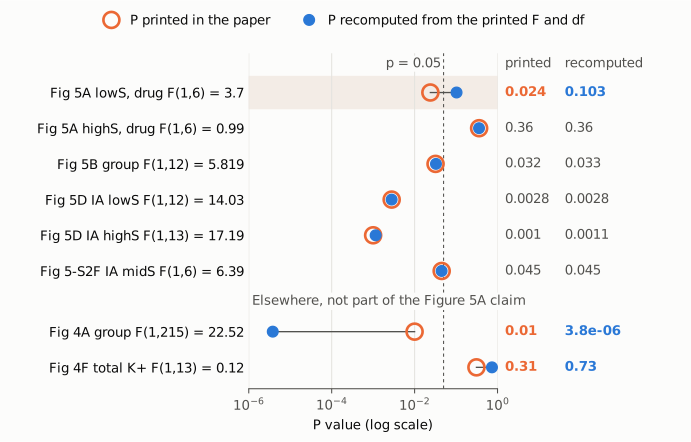
Figure 1. Each row is an F test printed in the paper. The orange ring is the P value as printed and the blue dot is the P recomputed from the printed F and degrees of freedom. The dashed line marks the paper's p < 0.05 threshold. In the top six rows (Figure 5, its supplement and the Kv1.4 Results text) the two values coincide except for the lowS main drug effect in Figure 5A, where the printed p = 0.024 sits below the threshold and the recomputed P = 0.103 sits above it. The two lower rows are other mismatches in the Figure 4 statistics. They do not change any conclusion and are shown only to complete the picture.
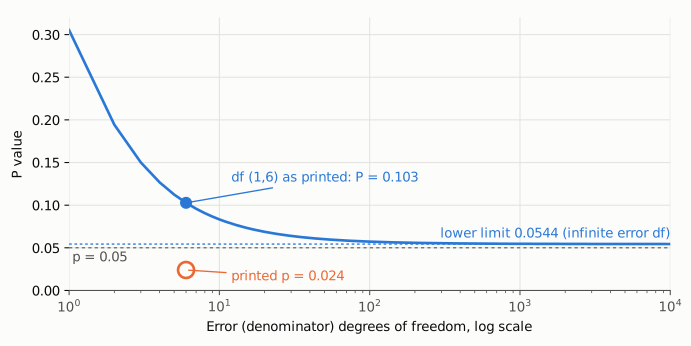
Figure 2. The blue curve is P for F = 3.7 on 1 numerator df as the error (denominator) df varies from 1 to 10,000. At the printed df (1, 6), P = 0.103. As the error df grows, P falls toward 0.0544, the chi-square limit, and it never reaches the printed p = 0.024 (orange ring). So a mistyped denominator df cannot reconcile the printed F and p.
Why it matters
The lowS statistic in Figure 5A is the only statistic with values reported for the statement that UK-78,282 significantly suppresses spiking in lowS neurons. The Figure 5B legend also mentions "decreased action potential output in the lowS group after UK-78,282 application" with an asterisk, but the only statistic the paper gives for Figure 5B is the between-group effect under drug, F(1,12) = 5.819 (see above). The lowS suppression is half of the "selective" effect that the paper draws from Figure 5. The Figure 5 title ("uniquely sensitive"), the Results subheading ("modulate SPN excitability selectively in lowS animals"), the Discussion ("selectively suppressed action potential firing in the lowS group") and the opening Discussion summary ("selectively decreases SPN spiking") all rely on it. The Abstract makes the link between low motivation and faster Kv1.4 inactivation more generally. It does not quote this value.
If F = 3.7 is the correct statistic, the drug effect in lowS neurons is not significant at the paper's own threshold (P = 0.10). The contrast "lowS, but not highS," would then compare two non-significant within-group results. The paper reports no group × drug interaction test for firing. Some supporting evidence does not depend on this statistic: the between-group difference under drug in Figure 5B (F(1,12) = 5.819, P = 0.033), the lowS-only change in IA inactivation time constant in Figure 5E (t(17) = 3.5, P = 0.003), and the behavioural microinfusion results in Figure 6. So the paper's broader conclusion about Kv1.4 and motivation does not stand or fall on this one number. But as printed, the specific claim that the drug significantly suppresses lowS firing rests on a statistic whose F and P cannot both be right.
Explanations considered
- Different denominator df. n = 7 cells per group gives error df 6 for a within-group main drug effect, which is what is printed. The highS test next to it, F(1,6) = 0.99, p = 0.36, recomputes exactly (0.358) with the same df. Even if the error df were 12 (both groups pooled), 60 or effectively infinite, F = 3.7 on 1 df gives P = 0.079, 0.059 or 0.054. No error df gives 0.024 (Figure 2). This does not explain the numbers.
- Post hoc P printed next to the main-effect F. The Methods say the two-way RM ANOVAs were "followed by Bonferroni post hoc tests". p = 0.024 could in principle be a post hoc comparison, for example at one current step. The label "Main drug effect" and its pairing with F(1,6) argue against this, and the highS statistic beside it is a matching main-effect pair. Even if it were a post hoc P, the legend would still attribute it to the main drug effect, and the main-effect P for F(1,6) = 3.7 would be 0.10. This would not rescue the main-effect claim as printed.
- One-sided test. Halving gives P = 0.051. That is not 0.024, and it is still above 0.05. The Methods do not mention one-sided tests. This does not explain the numbers.
- Interaction term reported in place of the main effect. The label says "Main drug effect". I scanned df (k, 6k) for a drug × current-step interaction within one group and (k, 12k) for both groups pooled, for k = 1 to 15. Only df (3, 36) comes within 0.004 of 0.024, at P = 0.020. That still does not round to 0.024, and it contradicts both the printed df and the label. This is unlikely to explain the numbers.
- Mistyped F value. If the true F were about 9.0 (8.9–9.1), p = 0.024 would be correct at df (1, 6). A typo such as 3.7 for 8.7 gives P = 0.026, close but not exact. This explanation is possible and would leave the significance claim intact. Only the underlying analysis can show it. In that case the error is in the F value, and the printed record still needs correcting.
- Mistyped P value. If F = 3.7 is correct, the true P is about 0.10 and the lowS drug effect is not significant. This explanation is equally possible from the published numbers.
- Text-conversion artefact. The same values appear in the eLife HTML version of record, the publisher PDF, the PMC page and the Europe PMC XML, where the subscript holds only the df. This is not a conversion error.
- Computation from the supplements. No source data are provided for Figure 5. The only source-data file (Figure 3—source data 1) holds RNA-seq gene lists, so the ANOVA cannot be recomputed from published material.
Status
- Version of record. The Figure 5A legend reads the same in four renderings: the eLife Version of Record (https://elifesciences.org/articles/47870, v1, 2019-09-05), the publisher PDF (https://cdn.elifesciences.org/articles/47870/elife-47870-v1.pdf, text extracted with PyMuPDF), the PMC page, and the Europe PMC full-text XML. The eLife versions API lists only one version (VoR v1). Every quotation above was checked verbatim against the PMC-archived text with
src/show.py. - Supplements. The supplementary items are Figure 3—source data 1 (
elife-47870-fig3-data1-v1.xlsx, RNA-seq differential expression lists), image-only figure supplements (Figure 1—S1, 4—S1/S2, 5—S1/S2, 6—S1) and a transparent reporting form. The data availability statement says the data are in the manuscript and supporting files, and no external repository is listed. None of these gives the Figure 5A cell-level data. The published peer review (https://elifesciences.org/articles/47870/peer-reviews) does not mention this statistic. - Corrections and comments. As of 2026-10-24 I found no correction, erratum, expression of concern or retraction.
src/known.pyreturns no Crossref update relations, no PMC notices and no Europe PMC notices. The Crossref record'srelationfield holds only the two peer-review links. A web search for the title with "pubpeer" or "correction" returned only the article's own pages and unrelated corrections. The PubPeer API and search page refused automated requests (Cloudflare challenge and HTTP 403), so PubPeer could not be checked directly. - Sources. PMC article PMC6728144; Europe PMC full-text XML; eLife article page, PDF, versions API and peer-review page; Crossref; Europe PMC; PubPeer (blocked); https://doi.org/10.7554/eLife.47870.
Suggested correction
- Check the original ANOVA output for the lowS main drug effect in Figure 5A and correct whichever of F(1,6) = 3.7 or p = 0.024 is wrong. If F = 3.7 is right, P = 0.10, and the legend should no longer call the suppression significant.
- If P = 0.10 is correct, revise the statements that UK-78,282 suppresses firing selectively in lowS neurons (Figure 5 title, Results subheading and first paragraph, Discussion) so that they rest on the tests that support them, mainly the Figure 5B group difference under drug. Ideally, also report a group × drug interaction test for firing.
- Check and correct the two other mismatched pairs in the Figure 4 Results text: "F(1,215)=22.52, p=0.01" (F and df imply P ≈ 4 × 10⁻⁶; F(1,215) also looks inconsistent with n = 9 cells per group) and "F(1,13)=0.12, p=0.31" (implies P ≈ 0.73). Neither changes a conclusion.
- Minor: correct "UK-72,282" to "UK-78,282" in the Figure 5A legend.