← Back to the plain-language case
Abstract says host genetics explains almost half of meningitis susceptibility; the paper estimates 29%
Nat Commun (2019) · doi:10.1038/s41467-019-09976-3 · PMC6520353
Summary
The abstract states that human genetic variation "explains almost half of variation in susceptibility to pneumococcal meningitis and one-third of variation in severity". Table 4 gives 0.25 (GCTA) and 0.29 (LDAK) for susceptibility and 0.29 (GCTA) and 0.49 (LDAK) for severity; the Results and the Discussion quote only the LDAK values, as 29% ± 7% for susceptibility and 49% ± 14% for severity (the Discussion gives the severity error as ± 9%). No susceptibility estimate in the paper is near one half: 0.5 lies outside both recomputed susceptibility 95% confidence intervals. The abstract's two magnitudes match the body's headline values only if the phenotypes are swapped. The abstract also implies that host genetics matters more for susceptibility than for severity, while the paper's headline estimates rank them the other way. The significance of either estimate is unaffected, and so are the paper's other findings.
What the paper reports
Abstract:
In a genome-wide association study of human and pathogen we show that human variation explains almost half of variation in susceptibility to pneumococcal meningitis and one-third of variation in severity, identifying variants in CCDC33 associated with susceptibility.
Results, "Human genetics associates with susceptibility and severity", paragraph 3:
We then used two standard methods to calculate SNP heritability, which both showed that variation in host genetics explains 29% ± 7% of the observed variation in pneumococcal meningitis susceptibility and 49% ± 14% of the variation in meningitis severity (Table 4).
Discussion, paragraph 2:
Host genetics explained 29% ± 7% of variation in susceptibility to meningitis.
We found no evidence for pathogen genetics affecting the severity of disease, whereas human genetics explained 49% ± 9% of this variation.
Table 4, "Human SNP heritability (h2SNP) of meningitis in the MeninGene cohort" (columns: Phenotype | Method | Heritability | Error | p-value):
Susceptibility (pneumococcal) | GCTA | 0.25 | 0.05 | 2.4 × 10⁻⁶
Susceptibility (pneumococcal) | LDAK | 0.29 | 0.07 | 3.9 × 10⁻⁶
Severity (any species) | GCTA | 0.29 | 0.11 | 2.8 × 10⁻⁵
Severity (any species) | LDAK | 0.49 | 0.14 | 1.4 × 10⁻⁴
Table 4 footer:
Heritabilities are shown on the liability scale (adjusted for population prevalence and case ascertainment ratio).
What the paper's own numbers show
Method. The abstract gives words, not numbers, so I read "almost half" as about 0.50 and "one-third" as 0.333. I compared each with both Table 4 estimates for the same phenotype. I built 95% confidence intervals as estimate ± 1.96 × the Table 4 "Error" column, treating that column as a standard error, and checked whether each interval contains 0.5 or 1/3. I also checked that the Results and Discussion percentages match the Table 4 rows. Finally I tested whether the two LDAK estimates differ from each other, with a z-test that treats them as independent. That is an approximation: the two phenotypes share control samples, so the estimates are not strictly independent. Every number below is printed by recompute.py.txt.
| Quantity | Location | Reported | Recomputed from the paper's numbers |
|---|---|---|---|
| Host h² for susceptibility | Abstract | "almost half" (≈ 0.50) | Table 4 gives 0.25 (GCTA) and 0.29 (LDAK). The nearest is 0.21 below 0.50 |
| Host h² for severity | Abstract | "one-third" (≈ 0.33) | Table 4 gives 0.29 (GCTA, 0.04 away) and 0.49 (LDAK, 0.16 away). The text's headline value is 0.49 |
| Susceptibility, GCTA | Table 4 | 0.25 ± 0.05 | 95% CI 0.152–0.348, which excludes 0.5 |
| Susceptibility, LDAK | Table 4; Results p3; Discussion p2 | 0.29 ± 0.07; "29% ± 7%" | Text matches the table. 95% CI 0.153–0.427, which excludes 0.5 |
| Severity, GCTA | Table 4 | 0.29 ± 0.11 | 95% CI 0.074–0.506 |
| Severity, LDAK | Table 4; Results p3 | 0.49 ± 0.14; "49% ± 14%" | Text matches the table. 95% CI 0.216–0.764 |
| Abstract reading vs headline value, susceptibility | Abstract vs Results p3 | ≈ 0.50 vs 0.29 | 21.0 percentage points higher, 1.72 times the paper's estimate |
| Abstract reading vs headline value, severity | Abstract vs Results p3 | ≈ 0.33 vs 0.49 | 15.7 percentage points lower |
| Value nearest to "almost half" anywhere in Table 4 | Table 4 | — | Severity, LDAK, 0.49 (0.01 from 0.50) |
| Severity minus susceptibility, LDAK | Table 4 | 0.49 − 0.29 | Difference 0.20, SE 0.157, z = 1.28, two-sided p = 0.20 (GCTA: 0.04, z = 0.33, p = 0.74) |
| Severity error | Discussion p2 | "49% ± 9%" | Table 4 and the Results give ± 14%. With ± 9% the interval would be 0.314–0.666 |
The arithmetic in the body is internally consistent: the Results and Discussion quote the LDAK rows of Table 4. The inconsistency is between the abstract and everything else. For susceptibility no estimator in the paper gives a value near one half. For severity, "one-third" is close to the GCTA estimate (0.29), but the paper presents the LDAK estimate (0.49) as its headline severity figure in both the Results and the Discussion. Read together, the abstract's two magnitudes match the body's headline values (29% and 49%) with the phenotypes swapped.
Figure
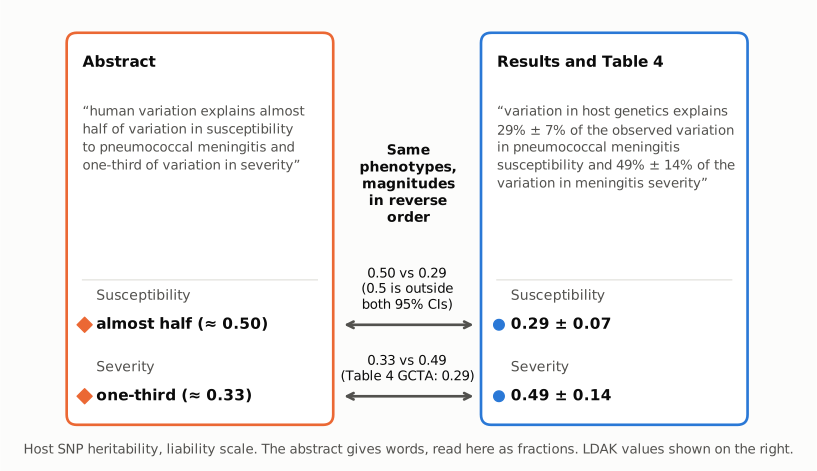
Figure 1. On the left is the abstract sentence. On the right is the Results sentence that cites Table 4 (verbatim excerpts). Below each are the values each passage gives for the same two phenotypes. Orange diamonds mark the abstract's words read as fractions. Blue dots mark the Table 4 LDAK estimates quoted in the Results. For susceptibility, the abstract's "almost half" (≈ 0.50) conflicts with 0.29 ± 0.07, and 0.5 is outside both recomputed susceptibility 95% confidence intervals. For severity, the abstract's "one-third" (≈ 0.33) sits below the headline 0.49 ± 0.14, although it is close to the GCTA estimate of 0.29. All values are host SNP heritability on the liability scale.
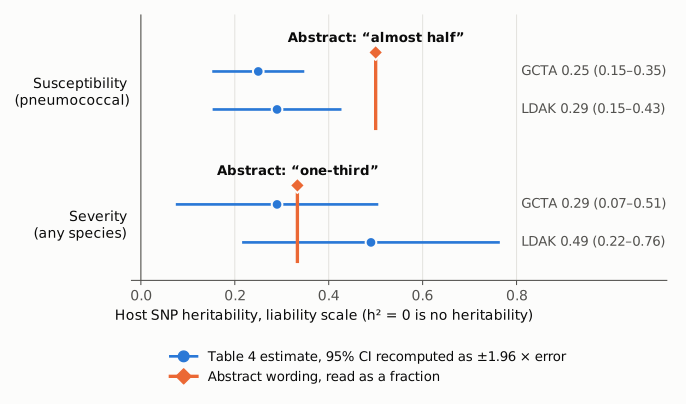
Figure 2. All four Table 4 estimates (blue dots) with 95% confidence intervals recomputed as ± 1.96 × the printed error, on one heritability axis that starts at zero (no heritability). The orange vertical marks show where the abstract's words fall for each phenotype. The susceptibility mark at 0.5 lies to the right of both susceptibility intervals. The severity mark at 1/3 lies inside both severity intervals. The intervals are wide, so the severity wording is not ruled out statistically, but it does not match the value the paper reports as its headline severity estimate.
Why it matters
The abstract is the part of the paper most readers see, and the host-heritability sentence is its main quantitative claim about human genetics. As written it overstates the host contribution to susceptibility by about 20 percentage points (≈ 0.50 against 0.29) and understates the headline severity estimate (≈ 0.33 against 0.49). It also reverses the order of the two phenotypes. The abstract suggests that host genetics matters more for susceptibility, while the paper's headline estimates suggest the opposite. Because the two estimates are not significantly different (z = 1.28, p = 0.20 under an independence approximation), the reversal matters less for the substance than for how the result is described. Anyone who cites the abstract's figures, for example in a review comparing heritability across infectious diseases, would carry forward a susceptibility value the paper does not support.
What the discrepancy does not affect: both host estimates remain significantly above zero (Table 4 p-values 3.9 × 10⁻⁶ and 1.4 × 10⁻⁴ for LDAK). The pathogen heritability results (70% for invasiveness, 0% for severity) are reported separately and correctly. The CCDC33, UBE2U, pspC and zmpD findings and the vaccine-target discussion are not affected.
Explanations considered
- A different estimator. Table 4 reports GCTA and LDAK for each phenotype. For susceptibility both (0.25 and 0.29) are well below one half, so neither estimator supports "almost half". For severity, GCTA's 0.29 is close to "one-third", but the susceptibility half of the sentence still has no supporting estimate. The Results and Discussion use the LDAK values throughout. Does not account for the discrepancy.
- A different scale or population. All Table 4 values are on the liability scale (prevalence 1 × 10⁻³) in the Dutch MeninGene cohort, and the text quotes those same values. The paper reports no other host heritability, for example observed-scale or pooled invasive disease, that could be near 0.5 for susceptibility. Does not account for it.
- Confusion with a pathogen estimate. The abstract reports the pathogen figures (70% of invasive potential, no effect on severity) in a separate sentence. No pathogen estimate is presented as a host susceptibility value. Not applicable.
- The pooled severity phenotype. Severity heritability was estimated by combining severe pneumococcal cases with severe cases from any species. That changes how severity is defined, not which number belongs to which phenotype. Does not account for it.
- Rounding or uncertainty. "Almost half" cannot be read as a loose rounding of 0.29, and 0.5 lies outside both susceptibility 95% confidence intervals (upper limits 0.348 and 0.427). Does not account for it.
- A text-conversion artifact. The conflict is between words ("almost half", "one-third") and printed percentages and decimals. There are no minus signs, superscripts or column alignments that a conversion could have garbled, and the publisher's page has the same wording. Ruled out.
- Carried over from an earlier version. The bioRxiv preprint (doi:10.1101/386078, posted 2018-08-07) has the same abstract sentence ("human variation explains almost half of variation in susceptibility to pneumococcal meningitis and one-third of variation in severity"). That shows when the wording appeared, not why. It does not reconcile the abstract with the published Table 4.
- A second, minor inconsistency. The Discussion gives severity as "49% ± 9%", while Table 4 and the Results give ± 14%. This is separate from the main discrepancy and does not change the estimate itself.
Status
As of 2026-10-23:
- Version of record. The publisher's HTML (nature.com/articles/s41467-019-09976-3) has the same abstract, Results and Discussion wording as the PMC archive, including "49% ± 9%" in the Discussion. The Table 4 rows were checked in the PMC archive and in the Europe PMC full-text XML, which agree: 0.25 ± 0.05, 0.29 ± 0.07, 0.29 ± 0.11 and 0.49 ± 0.14.
- Supplements. Both electronic supplementary files on the publisher's site were searched: the Supplementary Information PDF (36 pages) and the Peer Review File (19 pages). Neither reports a host heritability value for susceptibility or severity, and neither mentions the abstract wording. The external data deposits (figshare, Zenodo and the analysis-code repository) hold summary statistics and metadata, not alternative heritability estimates.
- Corrections. Crossref shows no update relations (no correction, erratum or retraction). The only relation is to the preprint. PMC and Europe PMC list no correction or retraction notice; Europe PMC's only linked record is the preprint. The Crossref record that carries Retraction Watch data has no correction or retraction entry.
- PubPeer. PubPeer's search API returned a human-verification challenge and could not be queried automatically. A web search for the title on PubPeer found no PubPeer entry. Absence of comments there is therefore not confirmed.
- Preprint. bioRxiv doi:10.1101/386078, version 1 (2018-08-07), has the same abstract wording.
Sources: PMC6520353; publisher version; Crossref record; Europe PMC; bioRxiv preprint.
Suggested correction
Bring the abstract into line with Table 4 and the Results, for example:
… we show that human variation explains around 30% of variation in susceptibility to pneumococcal meningitis and almost half of variation in severity, …
If the authors prefer to describe severity by the GCTA estimate (0.29), the abstract should say so and give the same order of magnitude for both phenotypes ("around 30%"). In that case the Results and Discussion, which present 49% as the severity figure, would also need to change. Separately, the Discussion's "49% ± 9%" should read "49% ± 14%" to match Table 4 and the Results.