← Back to the plain-language case
Sahel-wide foliage increases of 6% and 20% do not match the relative increases implied by the paper's own totals
Commun Biol (2019) · doi:10.1038/s42003-019-0383-9 · PMC6478729
Summary
The Abstract and Results report that satellite (VOD) estimates show Sahel-wide increases of 6% in total herbaceous mass (AGH) and 20% in total woody foliage mass (WPF) between 1992 and 2012. The same Results sentence gives the totals behind these percentages: AGH 0.28 Pg in 1992 and 0.31 Pg in 2012, WPF 0.16 Pg and 0.24 Pg. Those totals give relative increases of 10.7% and 50.0%. Allowing for rounding of the two-decimal totals, the possible ranges are 7.0–14.5% and 42.4–58.1%, so neither reported figure can be reached as an increase over each component's own 1992 value. Two denominators the paper does not state (1992 total vegetation mass, or the sum of the two years) can reach both figures within rounding of the printed totals, but the unrounded Supplementary Data does not reproduce the 20% WPF figure on either (see "Explanations considered"). The totals agree with the rest of the paragraph and with the paper's Supplementary Data, which points to the two percentages as the inconsistent figures. They are the only Sahel-wide figures in the Abstract and the paper's only Sahel-wide relative (percentage) increases. On the printed totals, the woody increase is understated about 2.5-fold (2.1–2.9-fold over rounding; 2.3-fold from the Supplementary Data endpoints) and the herbaceous increase about 1.8-fold (1.2–2.4-fold over rounding; 1.46-fold from the Supplementary Data endpoints). The direction of the main finding, that woody foliage rose faster than herbaceous mass, is unchanged.
What the paper reports
Abstract:
Satellite observations confirm these findings for the majority of the Sahel, with total herbaceous/woody foliage mass increases by 6%/20%.
Results, "Scaling field-site observations to the Sahel", paragraph 1 (the three sentences are consecutive):
For the entire western and central Sahel area, the summed AGH increased by 0.0025 Pg yr-1 over the 21-year period, and WPF by 0.004 Pg yr-1. Total AGH (WPF) was 0.28 Pg (0.16 Pg) in 1992 and 0.31 Pg (0.24 Pg) in 2012, which is a relative increase of 6% for AGH and 20% for WPF. The share of VOD estimated WPF (as related to the total vegetation mass) increased from 35% in 1992 to 43% in 2012, which is comparable to the percentage numbers observed from the Ferlo field samples.
The same paragraph, earlier:
According to fitted trends derived from VOD metrics from 1992 to 2012, AGH increased by + 5 ± 7 kg ha-1 yr-1 and WPF increased by +9 ± 8 kg ha-1 yr-1.
and later, giving the size of the significant-trend areas:
Areas with a significant (P < 0.05) increase in AGH cover a smaller region (289,375 km²; ~7%) than areas with a significant increase in WPF (2,711,875 km²; ~64%)
Discussion, paragraph 5, which builds on the composition of the increase:
However, a considerable portion of the observed increase in vegetation production consists of woody foliage mass, the fodder value of which is generally lower than that of herbaceous plants and would benefit primarily browsers (goats) over grazers (sheep and cattle).
What the paper's own numbers show
Method. The Results sentence defines the percentages as a "relative increase" computed from the stated 1992 and 2012 totals, so I took (2012 − 1992) / 1992 for each component. The totals are printed to two decimals, so I also computed the smallest and largest increase possible when each total varies by ±0.005 Pg. I then checked the totals against the WPF share given in the next sentence. Next I tried every other basis that could plausibly give 6% and 20%: the stated fitted trends, the per-hectare trends, other denominators, and the yearly Sahel series in the paper's Supplementary Data (file 42003_2019_383_MOESM4_ESM.csv, columns "Agh sahel" and "Wpf sahel", kg/ha, 1992–2012). Every number below is printed by recompute.py.txt.
| Quantity | Location | Reported | Recomputed from the paper's numbers |
|---|---|---|---|
| AGH relative increase, 1992→2012 | Results p1; Abstract | 6% | (0.31 − 0.28) / 0.28 = 10.7%; 7.0–14.5% over rounding |
| WPF relative increase, 1992→2012 | Results p1; Abstract | 20% | (0.24 − 0.16) / 0.16 = 50.0%; 42.4–58.1% over rounding |
| Recomputed / reported | derived | — | Printed totals: AGH 1.79×, WPF 2.50×; over rounding AGH 1.17–2.42×, WPF 2.12–2.90×; Supplementary Data endpoints AGH 1.46×, WPF 2.33× |
| What the reported % would mean in Pg | derived | 6% of 0.28; 20% of 0.16 | 0.017 Pg and 0.032 Pg, against stated differences of 0.03 and 0.08 Pg |
| WPF share of total mass, 1992 | Results p1 | 35% | 0.16 / 0.44 = 36.4% (consistent) |
| WPF share of total mass, 2012 | Results p1 | 43% | 0.24 / 0.55 = 43.6% (consistent) |
| Summed trend × 20 years | Results p1 | AGH 0.0025, WPF 0.004 Pg/yr | AGH 0.050 Pg = 17.9% of 0.28; WPF 0.080 Pg = 50.0% of 0.16 (18.7% / 52.5% over 21 years) |
| Per-hectare trend × 20 years / 1992 per-hectare mass | Results p1 | 5 and 9 kg/ha/yr | AGH 14.9%; WPF 47.1% (study area of about 4.19 million km² implied by 289,375 km² ≈ 7% and 2,711,875 km² ≈ 64%) |
| Pg/yr trend converted to kg/ha/yr with that area | Results p1 | 5 and 9 kg/ha/yr | 5.97 and 9.56 kg/ha/yr (roughly consistent) |
| Supplementary Data, endpoints | MOESM4 csv | — | AGH 595.34 → 647.31 kg/ha (+8.7%); WPF 337.62 → 494.97 kg/ha (+46.6%) |
| Supplementary Data, fitted OLS line 1992→2012 | MOESM4 csv | slopes 5 and 9 kg/ha/yr | slopes 5.41 and 8.68 kg/ha/yr; AGH +17.5%, WPF +51.8% |
| Supplementary Data scaled to Pg (area implied by 0.44 Pg in 1992, 4.72 × 10⁸ ha) | MOESM4 csv | 0.28→0.31 and 0.16→0.24 Pg; 0.0025 and 0.004 Pg/yr | 0.281→0.305 and 0.159→0.233 Pg; 0.0026 and 0.0041 Pg/yr |
| Supplementary Data, WPF share | MOESM4 csv | 35% → 43% | 36.2% → 43.3% |
The Pg totals, the trends, the shares and the supplementary series agree with one another. Only the two percentages do not. On the paper's totals, total vegetation (AGH + WPF) rose from 0.44 to 0.55 Pg, or 25.0%. The woody-to-herbaceous contrast in relative increase is 50.0 / 10.7 = 4.7× on the printed totals (5.3× from the Supplementary Data endpoints), compared with 20 / 6 = 3.3× as reported.
Figure
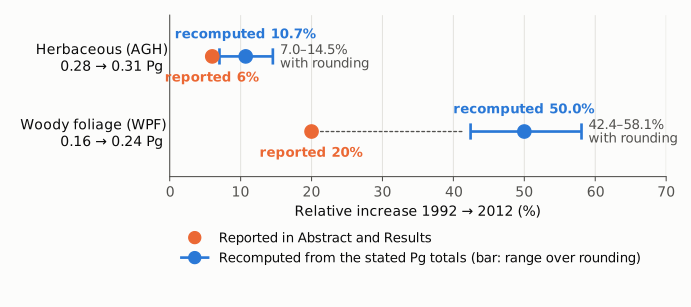
Figure 1. Relative increase from 1992 to 2012 for each component, on one axis starting at zero. Orange dots are the percentages reported in the Abstract and Results (6% for AGH, 20% for WPF). Blue dots are the increases recomputed from the totals stated in the same sentence (10.7% and 50.0%). The blue bars show every value the increase could take if each two-decimal total is anywhere within ±0.005 Pg of its printed value. Both reported values lie outside these ranges, by 1.0 percentage point for AGH and 22.4 points for WPF.
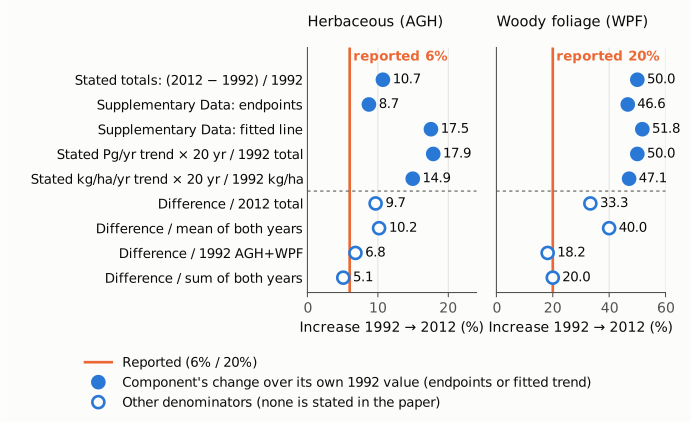
Figure 2. Every basis tried for the two percentages. Each panel has its own scale, starting at zero. The orange line marks the reported value. Filled blue dots show each component's change measured against its own 1992 value: from the stated totals, from the Supplementary Data endpoints and fitted line, and from the stated Pg/yr and kg/ha/yr trends over 20 years. For the kg/ha/yr row the denominator is the 1992 per-hectare mass, 0.28 or 0.16 Pg spread over the study area of about 4.19 × 10⁸ ha implied by the significant-trend areas (669 and 382 kg/ha). The closest are 8.7% for AGH and 46.6% for WPF. Hollow dots use other denominators, none of which the paper states. Only two land near both reported values. Dividing by the sum of the two years gives 5.1% and 20.0%. Dividing by the 1992 total vegetation mass gives 6.8% and 18.2%. These are discussed under "Explanations considered".
Why it matters
The 6%/20% figures are the only Sahel-wide figures in the Abstract and the paper's only Sahel-wide relative (percentage) increases for the satellite analysis; the Results also give the Sahel-wide trends in kg/ha/yr and Pg/yr, which are not affected. The Abstract uses them as the quantitative evidence that "Satellite observations confirm these findings for the majority of the Sahel". A reader who cites the Abstract would take the woody foliage increase to be 20% when the paper's own totals give 50%, and the herbaceous increase to be 6% when they give about 11%.
The errors do not reverse anything. Both components still increase, and woody foliage still increases faster than herbaceous mass. With the recomputed values the contrast is larger (4.7× on the printed totals and 5.3× from the Supplementary Data endpoints, rather than 3.3×), so the paper's qualitative conclusion is, if anything, stronger. The per-hectare trends (field data: +17 vs +3 kg/ha/yr; VOD: +9 vs +5 kg/ha/yr), the 35%→43% WPF share, the rainfall decomposition and the significance tests do not depend on the two percentages and are not affected. The Discussion's statement that "a considerable portion of the observed increase in vegetation production consists of woody foliage mass" is not wrong. On the stated totals the woody share of the total increase is 0.08 of 0.11 Pg, about 73%, which the 6%/20% figures do not convey.
So this is a misstatement of magnitude in a headline number, not a change in direction. The correct values cannot be read off anywhere in the paper and have to be recomputed.
Explanations considered
- Rounding of the printed totals. This does not account for the numbers as stated, that is, as each component's increase over its own 1992 value. With every total free to vary by ±0.005 Pg, AGH can range only from 7.0% to 14.5% and WPF from 42.4% to 58.1% (Figure 1).
- Percentages from the fitted trend rather than the endpoints. This does not account for the numbers. The stated summed trends over 20 years give 17.9% and 50.0% (18.7% and 52.5% over 21 years). The per-hectare trends give 14.9% and 47.1%. The supplementary series' fitted line gives 17.5% and 51.8%. All are further from 6% and 20% than the endpoint values.
- The Pg totals, not the percentages, are misprinted. This is unlikely. The totals reproduce the 35% and 43% WPF shares stated in the next sentence (36.4% and 43.6%). Scaled from the Supplementary Data, they come to 0.281/0.305 Pg and 0.159/0.233 Pg, and the trend of that series matches the stated 0.0025 and 0.004 Pg/yr. The supplementary series itself gives increases of 8.7% and 46.6%.
- Increase relative to the 2012 value or to the mean of the two years. This does not account for the numbers: 9.7%/33.3% and 10.2%/40.0%.
- Each component's increase relative to total vegetation mass in 1992 (AGH + WPF = 0.44 Pg). This is the strongest alternative. From the printed totals it gives 6.8% and 18.2%, and over rounding of the totals the ranges are 4.4–9.3% for AGH and 15.6–20.9% for WPF, so on the printed totals both reported values can be reached on this basis. The case against it rests on three points. The paper calls the figures "a relative increase of 6% for AGH and 20% for WPF" and, in the Abstract, increases in "total herbaceous/woody foliage mass", not changes measured against total vegetation. The basis is not stated anywhere in the paper. And the unrounded Supplementary Data gives 5.6% for AGH, which rounds to 6%, but 16.9% for WPF, which rounds to 17%. The Supplementary Data therefore reproduces the AGH figure but not the WPF figure.
- Difference divided by the sum of the two years. From the printed totals this gives 5.1% and 20.0%, and over rounding the ranges are 3.4–6.8% for AGH and 17.5–22.5% for WPF, so both reported values can also be reached on this basis. This is not a relative increase in the usual sense: it equals half the change relative to the two-year mean. It is not stated in the paper. From the unrounded Supplementary Data it gives 4.2% and 18.9%, which would round to 4% and 19%, so the Supplementary Data reproduces neither figure on this basis.
- Change in each component's share of total vegetation. The WPF share rises from 36.4% to 43.6%, a relative change of 20.0%. The AGH share falls by 11.4%, though, so this basis cannot give a 6% increase for AGH.
- Conversion or typesetting artifact. Excluded. The publisher PDF, the publisher HTML, the PMC-archived text and the Europe PMC XML all print the same plain digits ("0.28", "0.31", "0.16", "0.24", "6%", "20%"). The passages contain no minus signs, superscripts or table cells that conversion could have altered.
No basis that the paper states, or that measures each component against its own baseline, reproduces 6% and 20%. Two unstated denominators (the 1992 total vegetation mass and the sum of the two years) can reach both values within rounding of the printed totals. Neither is described in the paper, and on the unrounded Supplementary Data the first reproduces the AGH figure but not the WPF figure, while the second reproduces neither. The published material does not show how the percentages were obtained.
Status
- Version of record. I checked the publisher PDF (nature.com/articles/s42003-019-0383-9.pdf, text extracted with pdftotext) for this write-up. The Abstract and the Results sentence appear there exactly as quoted. An earlier audit in this review found the same wording and numbers on the publisher HTML page and in the Europe PMC full-text XML. Every quote above was confirmed verbatim against the PMC-archived text (
src/show.py PMC6478729 --grep). PMC renders "kg ha−1 yr−1" as "kg ha-1 yr-1", and the quotes follow PMC. - Supplements checked. In the earlier audit: MOESM1 (Reporting Summary), MOESM2 (Supplementary Information, Supplementary Figs 1–8 and Table 1), MOESM3 (description of supplementary items) and MOESM4 (Supplementary Data .csv), all from static-content.springer.com. I downloaded and re-read MOESM4 for this write-up. None defines the percentages differently. MOESM4 was used for the recomputation above and supports the stated totals, not the percentages.
- Corrections and comments. As of 2026-10-23, I found no correction, erratum, author correction, retraction or expression of concern. The Crossref record for the DOI has no update-to, updated-by or relation entries, and a Crossref query for works that update this DOI returned 0 results. PMC and Europe PMC list no related notices (
src/known.py). The publisher's article page shows no correction or change history. For PubPeer, the extension API returned a Cloudflare challenge page to automated access, and an earlier DOI lookup returned "Not Found". A web search for the title together with PubPeer, correction or erratum found only copies of the article and repository records. - Sources. Publisher article page · PMC6478729 · Crossref record · Supplementary Data (MOESM4)
Suggested correction
- In the Results, "Scaling field-site observations to the Sahel", paragraph 1, replace "which is a relative increase of 6% for AGH and 20% for WPF" with the increases implied by the unrounded totals. The printed totals give about 11% for AGH and 50% for WPF, and the Supplementary Data series gives 8.7% and 46.6% from endpoints.
- Make the same change in the Abstract ("total herbaceous/woody foliage mass increases by 6%/20%").
- If a different basis was intended, for example the change relative to total vegetation mass, state that basis in both places and recompute both figures on it from the unrounded data.
- Optionally, report the increase in total vegetation (0.44 → 0.55 Pg, about 25%) and the woody share of that increase (about 73%), which make the fodder implications in the Discussion concrete.