← Back to the plain-language case
Abstract reverses the direction of the white-light calcium responses shown in Results and Fig. 4B
Proc Natl Acad Sci U S A (2018) · doi:10.1073/pnas.1802592115 · PMC6217433
Summary
The paper reports that a single bistable opsin, parapinopsin, gives zebrafish pineal photoreceptors opposite calcium responses to UV and visible light. In one experiment (Fig. 4B), white light was shifted toward UV or toward visible wavelengths. The abstract says these shifts "respectively increased vs. decreased" the calcium signal. The Results paragraph, the Fig. 4 legend, the transient responses in the plotted Fig. 4B traces, the 405-nm and 588-nm two-photon experiments, and the paper's proposed mechanism all give the opposite: UV-shifted light lowered calcium and visible-shifted light raised it. The existence of opponency and its dependence on parapinopsin are unaffected. But the abstract, the part most readers and indexers rely on, states the sign of the naturalistic-light result backwards, and nothing in the abstract lets a reader notice.
What the paper reports
Abstract:
Changes in the spectral composition of white light toward enhanced UV or visible wavelengths respectively increased vs. decreased calcium signal in parapinopsin-sufficient but not parapinopsin-deficient photoreceptors.
Results, section "Color Opponency Based on Photoequilibrium of Parapinopsin Two States", white-light paragraph:
We found decreased and increased calcium levels following exposure to UV and visible light-mixed white light, respectively, in WT and PT-/- but not in PP-/- and PP-/-/PT-/- (Fig. 4B).
Fig. 4 legend, panel B:
Note that the calcium levels decreased and increased transiently in response to exposure to UV and visible light-mixed white lights, respectively, in WT and PT-/-.
Results, section "Antagonistic Chromatic Responses in a Single Pineal Photoreceptor Cell" (two-photon imaging, Fig. 1C):
stimulation with 405-nm light caused a decrease in fluorescence intensity.
In contrast, stimulation with 588-nm light elevated the fluorescence intensity, demonstrating the antagonistic effect of UV and visible light on the calcium in individual PP cells to UV and visible light (Fig. 1C).
Results, mechanism paragraph (Fig. 3):
The 405-nm light stimulus increases the short-wavelength component of incident light and thus increases the fractional concentration of the signaling active photoproduct from that produced by the imaging light alone, leading to hyperpolarization (Fig. 3 B and D, calcium decrease).
Conversely, because the photoproduct is more sensitive to longer wavelengths, the 588-nm light stimulus decreases its fractional concentration, reducing the pool of signaling-active opsin, resulting in termination of hyperpolarization and increased calcium levels (Fig. 3 C and D, calcium increase).
Discussion, first paragraph:
with lights biased toward UV driving greater hyperpolarization than those biased toward visible light.
Fig. 4 legend, panels A and B (stimulus intensities and sample sizes):
The light intensities (360–780 nm) of white light, UV-mixed white light, visible light-mixed white light, and direct sunlight were ∼9.2 × 10¹⁴, ∼9.3 × 10¹⁴, ∼9.9 × 10¹⁴, and 1.1 × 10¹⁷ photons per cm2·s. The light intensities of UV and visible LED lights were ∼1.3 × 10¹³ and ∼7.6 × 10¹³ photons per cm2·s, respectively.
Changes in calcium level of PP cells in WT (red open circle; n = 24), PT-/- fish (green closed circle; n = 23), PP-/- fish (purple open triangle; n = 17), and PP-/-/PT-/- fish (black closed triangle; n = 16)
(The exponents read "1014", "1013" and "1017" in the archived text. They are superscripts lost in conversion: 10^14, 10^13, 10^17.)
What the paper's own numbers show
This is a check of direction, not of arithmetic. Each sentence that uses "respectively" pairs the i-th stimulus with the i-th direction word. recompute.py.txt pulls both word orders out of the quoted sentences with a regular expression, builds the stimulus-to-direction mapping for each sentence, and compares the mappings. For the Fig. 4B traces, the direction of the WT and PT-/- deflections at the UV-mixed and visible-mixed bars, and the later course of the traces, were read by eye from the published figure image. No values were measured from it. The script also checks every quotation above against the PMC archive and does the arithmetic on the Fig. 4A intensities.
| Quantity | Location | Reported | Recomputed from the paper's body |
|---|---|---|---|
| Calcium response to UV-enhanced white light | Abstract | increased | decreased |
| Calcium response to visible-enhanced white light | Abstract | decreased | increased |
| Calcium response to UV- / visible-mixed white light | Results, white-light paragraph (Fig. 4B) | decreased / increased | decreased / increased (agrees) |
| Calcium response to UV- / visible-mixed white light | Fig. 4 legend, panel B | decreased / increased | decreased / increased (agrees) |
| Transient deflection of WT and PT-/- traces at UV- / visible-mixed bars | Fig. 4B, plotted data | downward / upward | decreased / increased (agrees; for the later rebound see Explanations, item 4) |
| Fluorescence response to 405-nm / 588-nm light (two-photon) | Results, Fig. 1C | decrease / elevated | decreased / increased (agrees) |
| Predicted calcium change for 405-nm / 588-nm light | Results, mechanism (Fig. 3) | calcium decrease / calcium increase | decreased / increased (agrees) |
| UV-biased vs visible-biased light | Discussion | greater hyperpolarization for UV-biased | lower calcium under UV-biased light (agrees) |
| Body passages with UV → decrease and visible → increase | all of the above except the abstract | — | 5 of 5, plus the Discussion's comparison |
| White + UV LED; white + visible LED (photons per cm²·s) | Fig. 4 legend A | ~9.3 × 10^14; ~9.9 × 10^14 | 9.33 × 10^14 (LED adds 1.4%); 9.96 × 10^14 (LED adds 8.3%). Both agree with the legend within the rounding of its approximate (~) inputs; white light is itself ~9.2 × 10^14 |
| n per genotype, Fig. 4B | Fig. 4 legend B | WT 24, PT-/- 23, PP-/- 17, PP-/-/PT-/- 16 | unaffected by the direction issue |
The abstract gives UV → increase and visible → decrease. Every other passage that states a direction gives UV → decrease and visible → increase. Both added LEDs raise the total photon flux above the same white background (by 1.4% and 8.3%), so the two stimuli differ in spectral composition, not in the sign of the intensity change. The opposite responses are therefore spectral, as the paper argues, and the direction of each is fixed by the body of the paper.
Figure
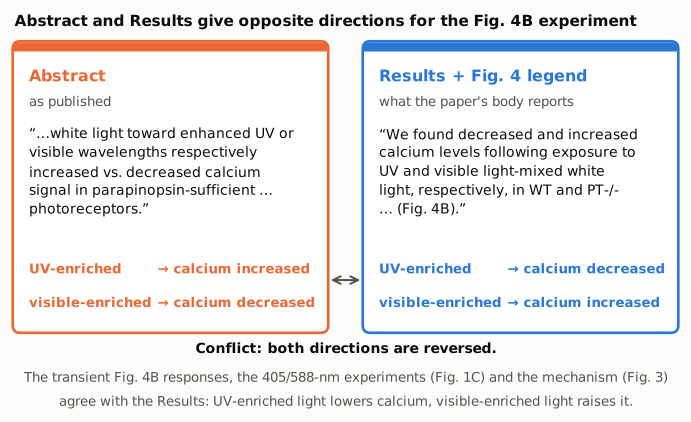
Figure 1. The left panel quotes the abstract and the right panel quotes the Results sentence on Fig. 4B. Under each quotation is the stimulus-to-direction mapping its "respectively" construction implies. Orange marks the abstract as published. Blue marks what the paper's own body reports. Both directions are reversed between the two panels. The Fig. 4 legend, the transient responses in the plotted Fig. 4B traces, the 405/588-nm experiments and the mechanism all match the right panel. Every word is from the paper or from the output of recompute.py.txt.
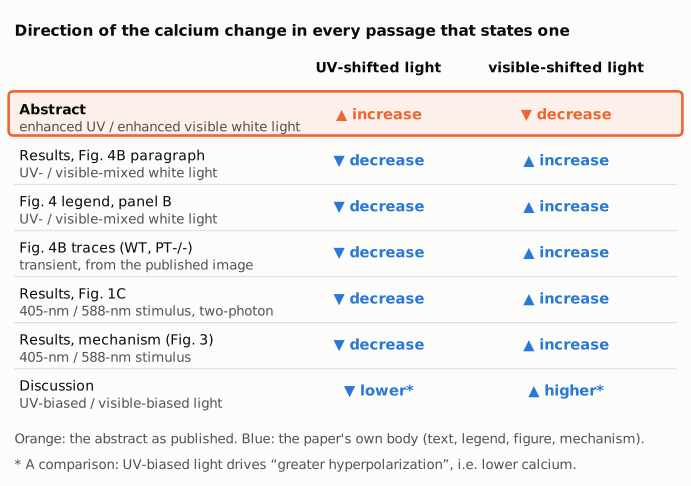
Figure 2. For each passage of the paper that states a direction, this grid gives the stated calcium change for UV-shifted light and for visible-shifted light. The abstract (orange, top row) is the only passage with UV → increase and visible → decrease. Six body passages (blue) agree with each other, including the plotted Fig. 4B traces and the mechanism. The Discussion row is a comparison between the two lights rather than a change from baseline.
[Internal, to be removed with candidates/ before sending: five candidate figure designs are in candidates/ for selection. candidate_1 = Figure 1, candidate_2 = Figure 2, candidate_3 = a sign dot plot on one axis, candidate_4 = the "respectively" pairing, candidate_5 = the paper's mechanism chain against the abstract's outcome.]
Why it matters
- The abstract states the headline naturalistic-light result backwards. The Results present Fig. 4B as a test of whether color opponency is observed "under natural light-like conditions"; the abstract reports its outcome. A reader of the abstract alone learns that UV-enriched light raises calcium in parapinopsin-expressing cells, the opposite of what was measured.
- It contradicts the paper's own mechanism. In the paper's model, UV raises the fraction of signaling-active photoproduct, which drives hyperpolarization and a calcium decrease. The abstract's wording implies the reverse. The same holds for the earlier pineal ganglion-cell recordings the Introduction cites, in which firing is "suppressed by UV and enhanced by visible light", although that is a different quantity.
- The error goes further than the paper. PubMed, Europe PMC and Semantic Scholar carry the same abstract. Citing authors, reviewers and model builders who take the sign from the abstract would carry the reversal forward.
- What is not affected. The measured data, the Results, the figure, the sample sizes and the paper's main claim are not affected: opposite-sign responses that disappear without parapinopsin. Only the direction stated in the abstract is wrong.
Explanations considered
- The abstract describes a different quantity. If the abstract meant hyperpolarization, photoproduct amount or ganglion-cell firing, the sign could legitimately differ. It says "calcium signal", the same quantity as the Results and legend (GCaMP6s ΔF/F). This does not account for the conflict.
- The abstract describes a different experiment or population. "Toward enhanced UV or visible wavelengths" matches the UV-mixed and visible-mixed white light of Fig. 4A/B. "Parapinopsin-sufficient but not parapinopsin-deficient" matches WT and PT-/- versus PP-/- and PP-/-/PT-/-. The only experiments that shift the spectrum of white light are Fig. 4B and its repeats at other intensities and durations in SI Appendix Fig. S7. This does not account for the conflict.
- "Respectively" can be read the other way. The abstract lists "UV or visible" and then "increased vs. decreased". The only grammatical pairing is UV with increased. The Results and legend use the same construction with the verbs in the opposite order. This does not account for the conflict.
- The abstract refers to a different time point or phase, such as what follows the stimulus. The plotted traces do show a later change. In WT and PT-/-, calcium dips at the UV-mixed bar, then rebounds above the pre-stimulus baseline and stays elevated until the visible-mixed bar. Taken alone, that rebound has the sign of the UV half of the abstract (UV → increased). It does not account for the abstract, for three reasons. (a) The Results and the Fig. 4 legend name the transient decrease as the response to UV-mixed light: "the calcium levels decreased and increased transiently in response to exposure to UV and visible light-mixed white lights, respectively". The legend adds that the relaxation of these responses was "not observed as a result of time-lapse recoding with low time resolution". (b) The Discussion describes "slow elevation of calcium levels after these levels were greatly decreased" under continuous blue or xenon white light (SI Appendix, Figs. S2 and S6). It relates this to "the kinetics of signaling-active photoproduct", which "could constitute a mechanism of light adaptation", and not to the spectral content of a stimulus. Applying that to the rebound in Fig. 4B is this write-up's inference, but it is the only account of such a rise that the paper offers. (c) The visible half of the abstract (visible → decreased) has no counterpart in the figure. After the visible-mixed peak, the traces return to about the level they had just before the visible-mixed bar, and no decrease follows. So even read as a later phase, the abstract's full mapping is not shown. This does not account for the conflict.
- The difference reflects total intensity rather than spectrum. Both mixed lights add photons (1.4% and 8.3% above the white light), so intensity cannot give opposite signs, and it does not bear on which sign is which. This does not account for the conflict.
- One Discussion sentence uses "increase". The Discussion speaks of "maximum changes in increase of calcium level in PP cells (10–20 s; SI Appendix, Fig. S7)". It is ambiguous and does not say which stimulus produced the increase. The SI text speaks only of "calcium decrease profiles in Fig. S7 (~20 s for reaching the maximum)" and does not name a stimulus; Fig. S7 repeats the UV- and visible-mixed stimuli, so linking that phrase to the UV-mixed responses is an inference. Neither passage supports the abstract's mapping.
- Text-conversion artifact. The conflict is in words, not numbers, and the same abstract wording appears in the Europe PMC XML, PubMed and Semantic Scholar. A lost minus sign, superscript or table cell cannot produce it. This does not account for the conflict.
- Already corrected. No correction or erratum was found (see Status).
None of these accounts for the reversal. The abstract's direction words for the Fig. 4B experiment are in the opposite order to the rest of the paper.
Status
As of 2026-10-23:
- Version of record: checked. The PNAS article page (reached through doi.org) and the PMC HTML page refused automated access (HTTP 403 and a bot check), so the publisher's HTML could not be read directly. The publisher-supplied text was read in the Europe PMC full-text JATS XML for PMC6217433, in the PubMed record (PMID 30322939) and in Semantic Scholar. All three carry the abstract sentence word for word, and the XML carries the Results and legend sentences quoted above. The PMC archive used here (
src/show.py) gives the same passages. - Figure: the published Fig. 4 image (pnas.1802592115fig04.jpg, from the PMC / Europe PMC package) was inspected. The WT and PT-/- traces drop at the UV-mixed bar, then rebound above the pre-stimulus baseline and stay elevated until the visible-mixed bar. They peak at the visible-mixed bar and then return to about their level just before it. The PP-/- and PP-/-/PT-/- traces stay flat. The figure is not reproduced here.
- Supplements: the SI Appendix (pnas.1802592115.sapp.pdf, 18 pages) was read. The Fig. S6 legend refers the UV- and visible-mixed responses to Fig. 4B. The Fig. S7 legend describes repeats at other LED intensities and durations. The SI text speaks of "calcium decrease profiles in Fig. S7" and says that more signaling-active photoproduct "would facilitate depolarizing responses to visible-light stimuli". All of this agrees with the Results, not the abstract. No source data are deposited.
- Corrections and notices:
src/known.pyreturns no Crossref updates, PMC notices or Europe PMC notices. The Crossref record has no update-to or updated-by relation. No correction, erratum, expression of concern or retraction was found. - PubPeer: a web search for the title together with "pubpeer" returned no PubPeer page. The PubPeer site and API refused automated queries (HTTP 403, Cloudflare), so a thread there cannot be ruled out.
- Sources: PMC6217433 (
src/show.py);src/known.py 10.1073/pnas.1802592115; https://doi.org/10.1073/pnas.1802592115; https://www.ebi.ac.uk/europepmc/webservices/rest/PMC6217433/fullTextXML; https://www.ebi.ac.uk/europepmc/webservices/rest/PMC6217433/supplementaryFiles; PubMed PMID 30322939.
Suggested correction
In the Abstract, replace
Changes in the spectral composition of white light toward enhanced UV or visible wavelengths respectively increased vs. decreased calcium signal in parapinopsin-sufficient but not parapinopsin-deficient photoreceptors.
with
Changes in the spectral composition of white light toward enhanced UV or visible wavelengths respectively decreased vs. increased calcium signal in parapinopsin-sufficient but not parapinopsin-deficient photoreceptors.
This makes the abstract agree with the Results, the Fig. 4 legend, the plotted Fig. 4B data and the paper's proposed mechanism. No other part of the paper needs to change.