← Back to the plain-language case
Abstract states P < 0.05 for all three SGA sex differences; two exceed 0.05 in Table 3
Am J Epidemiol (2018) · doi:10.1093/aje/kwy141 · PMC6211242
Summary
The abstract says that the associations of being small for gestational age (SGA) with height-for-age (HAZ), weight-for-age (WAZ) and neuropsychological development (ASQ z score) were larger for male than for female infants "(P < 0.05 for all)". The paper's own tests of that sex difference (Table 3, row "H0: No sex difference for SGA"; Results, third paragraph) give P = 0.063 for HAZ, 0.059 for WAZ and 0.043 for ASQ. Only ASQ is below 0.05, and the Results text and the Table 3 footnotes themselves label HAZ and WAZ as significant only at the 10% level. A Wald test rebuilt from the sex-specific coefficients and 95% CIs in Table 3 reproduces the three values (0.064, 0.060, 0.044) as two-sided P values. The abstract therefore overstates the statistical support for the paper's central sex-specific finding for two of the three outcomes. The estimates themselves are not in question.
What the paper reports
Abstract:
For being small for gestational age, associations with height-for-age, weight-for-age, and neuropsychological development were also negative, but they were systematically larger for male than for female infants (P < 0.05 for all). These results suggest that male fetuses may be more vulnerable to intrauterine adversity than female fetuses.
Methods, "Statistical analysis and empirical strategy":
Finally, we tested whether the observed sex-specific differences were statistically significant in pooled linear models with interaction terms. We used robust standard errors to account for any heteroskedasticity in the data.
Results, third paragraph:
The estimated coefficients for HAZ and WAZ were more than twice as large for boys as for girls, and the interaction term was significant at the 10% level (P = 0.063 and 0.059, respectively). Estimated sex differences with respect to SGA were largest for ASQ scores, which showed no evidence of associations with SGA for girls but large negative associations for boys (z score difference, -0.55, 95% confidence intervals: 1.11, 0.01; statistically significant at the 10% level). We rejected the null of equal associations with a P value of 0.043.
Table 3, SGA rows and the test row (coefficient, 95% CI; columns HAZ, WAZ, ASQ z score). Cell contents are verbatim; the "Girls ·" and "Boys ·" prefixes stand for the table's group headings, and each P value, which spans two columns in the table, is shown once:
Girls · SGA | -0.485b | -0.839, -0.130 | -0.509b | -0.830, -0.188 | 0.094 | -0.180, 0.368
Boys · SGA | -1.108b | -1.662, -0.553 | -1.177b | -1.794, -0.559 | -0.549d | -1.110, 0.013
H0: No sex difference for SGA (P value) | 0.063d | 0.059d | 0.043c
Table 3 footer (excerpt):
The 95% CIs are based on heteroskedasticity-robust standard errors. P values are based on a pooled model with linear interaction terms.bP < 0.01.cP < 0.05.dP < 0.1.
What the paper's own numbers show
Method. I compared the abstract's "P < 0.05 for all" with the three interaction P values printed in Table 3. To check that those printed values are ordinary two-sided P values, and not one-sided values that a reader might halve, I rebuilt an approximate Wald test from the stratified estimates in Table 3. Each stratum's standard error is (upper − lower) / (2 × 1.96) from its robust 95% CI. The boys − girls difference has SE √(SEgirls2 + SEboys2), since the strata are independent samples, and P = 2(1 − Φ(|z|)). This approximation does not use the authors' pooled model, which constrains the covariate coefficients to be equal across sexes, so small differences from the printed P values are expected. I applied the same check to the prematurity rows as a control. I also tested the alternative reading that "P < 0.05" refers to the SGA coefficients themselves, and adjusted the three interaction P values for multiplicity. Every number below is printed by recompute.py.txt.
| Quantity | Location | Reported | Recomputed from the paper's own numbers |
|---|---|---|---|
| Sex difference in SGA association, HAZ | Table 3 test row; Results ¶3; Abstract | 0.063 (footnote d, P < 0.1); abstract: P < 0.05 | 0.064 two-sided (difference −0.623, SE 0.336, z = −1.86); not below 0.05 |
| Sex difference in SGA association, WAZ | Table 3 test row; Results ¶3; Abstract | 0.059 (footnote d, P < 0.1); abstract: P < 0.05 | 0.060 two-sided (difference −0.668, SE 0.355, z = −1.88); not below 0.05 |
| Sex difference in SGA association, ASQ | Table 3 test row; Results ¶3; Abstract | 0.043 (footnote c, P < 0.05) | 0.044 two-sided (difference −0.643, SE 0.319, z = −2.02); below 0.05 |
| Outcomes with interaction P < 0.05 | Abstract vs Table 3 | "for all" (3 of 3) | 1 of 3 |
| 95% CI of boys − girls difference (approximate) | from Table 3 CIs | not reported | HAZ −1.281 to 0.035; WAZ −1.364 to 0.028; ASQ −1.268 to −0.018 |
| One-sided equivalents | — | not stated anywhere | 0.032, 0.030, 0.022 (Wald); reported ÷ 2 = 0.0315, 0.0295, 0.0215 |
| Control: sex difference for prematurity | Table 3 test row | 0.354, 0.730, 0.705 | 0.355, 0.732, 0.704 two-sided |
| Boys / girls SGA coefficient ratio | Table 3; Results "more than twice" | — | HAZ 2.28, WAZ 2.31 |
| SGA coefficient P, girls | Table 3 | HAZ and WAZ footnote b (P < 0.01); ASQ unmarked | HAZ 0.0073, WAZ 0.0019, ASQ 0.50 |
| SGA coefficient P, boys | Table 3 | HAZ and WAZ footnote b; ASQ footnote d (P < 0.1) | HAZ 0.0001, WAZ 0.0002, ASQ 0.055 |
| Pooled adjusted SGA coefficient, ASQ | Table 2 | −0.152 (−0.415, 0.112), unmarked | P = 0.26 |
| Interaction P adjusted for 3 tests | from Table 3 | — | Bonferroni 0.189, 0.177, 0.129; Holm 0.129 for all three; Benjamini–Hochberg 0.063 for all three |
The Wald approximation matches each printed interaction P value to within 0.002, for SGA and for the prematurity control alike. The printed values are therefore two-sided P values, and the paper's own labels agree: footnote d (P < 0.1) on 0.063 and 0.059, footnote c (P < 0.05) on 0.043, and "significant at the 10% level" in the Results. On the alternative reading, "P < 0.05 for all" also fails: the SGA–ASQ coefficient is not significant at 0.05 in girls (P = 0.50), in boys (P = 0.055, CI −1.110 to 0.013) or in the pooled sample (P = 0.26). Under no reading do all three outcomes meet P < 0.05.
Figure
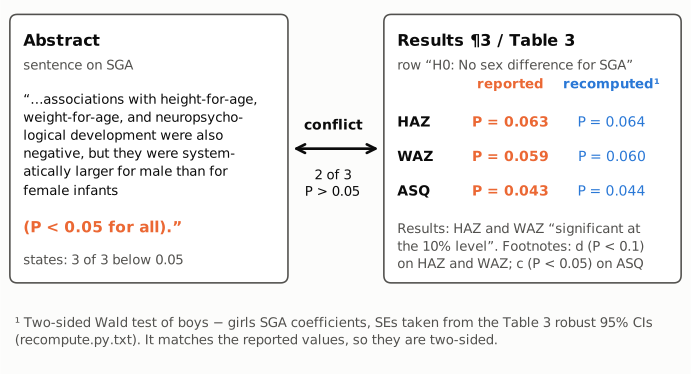
Figure 1. Left: the abstract sentence, whose final clause "(P < 0.05 for all)" covers all three outcomes. Right: the row "H0: No sex difference for SGA" from Table 3, with the reported P values (orange, bold) and the two-sided P values recomputed from the Table 3 sex-specific coefficients and 95% CIs (blue). The connector marks the conflict: two of the three reported P values, for HAZ and WAZ, are above 0.05. The Results text and the Table 3 footnotes give the same 10%-level classification. All numbers are from the paper or from recompute.py.txt.
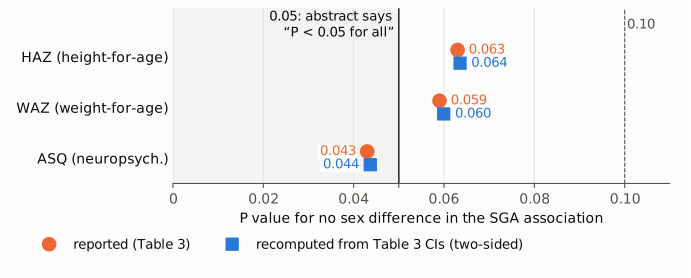
Figure 2. P value for the null of no sex difference in the SGA association, for each outcome, on a linear axis from 0. Orange circles: values reported in Table 3. Blue squares: two-sided values recomputed from the Table 3 CIs. The solid line at 0.05 is the threshold the abstract states for all three; the shaded region left of it is P < 0.05; the dashed line marks 0.10. The reported and recomputed values agree to within 0.002, and HAZ and WAZ fall between 0.05 and 0.10 on both.
Why it matters
- The abstract overstates the evidence for the paper's main hypothesis. The paper is framed as a test of whether in-utero adaptation differs by sex. The interaction tests are its direct evidence, and the abstract reports all three as P < 0.05 when the paper's own table gives 0.063, 0.059 and 0.043. Readers who rely on the abstract, or on indexing services that reproduce it, take away three significant sex differences instead of one.
- The conclusion rests mostly on these tests. The sex differences for prematurity were not significant (P = 0.354, 0.730, 0.705), so the closing statement that "adverse birth outcomes may be more harmful to the development of male infants than to the development of female infants" rests mainly on the SGA interactions.
- Under multiplicity adjustment none of the three is below 0.05. With three outcomes tested, Bonferroni gives 0.189, 0.177 and 0.129, and Holm and Benjamini–Hochberg give 0.129 and 0.063 respectively for all three. The paper does not claim a multiplicity correction; the point is only that the statement "P < 0.05 for all" is further from the paper's evidence than the 1-of-3 count alone suggests.
- The estimates are not affected. The boys − girls differences (about −0.62, −0.67 and −0.64 SD) and the ratio of more than two for HAZ and WAZ are as printed. The abstract's hedged wording ("may be more vulnerable") remains a fair summary of a suggestive pattern. What changes is the significance level attached to it.
- A related wording point. The abstract calls the SGA associations with neuropsychological development "also negative", but the pooled adjusted coefficient is −0.152 (P = 0.26) and the girls' coefficient is +0.094 (P = 0.50). The Discussion describes the same result as "no association with neuropsychological development" overall.
Explanations considered
- The printed P values are one-sided. Does not account for it. Halving them would put all three below 0.05 (0.0315, 0.0295, 0.0215), but the Wald test rebuilt from the Table 3 CIs gives two-sided P values of 0.064, 0.060 and 0.044, which match the printed 0.063, 0.059 and 0.043. The same check reproduces the prematurity P values as two-sided. The Methods and table footers never mention one-sided tests, and the Results call HAZ and WAZ "significant at the 10% level".
- "P < 0.05" refers to the SGA associations themselves, not to the sex difference. Does not account for it. The SGA–ASQ association is not significant at 0.05 for boys (P = 0.055; CI −1.110 to 0.013 includes 0), for girls (P = 0.50) or pooled (P = 0.26).
- The abstract summarizes a different model, population or SGA standard. Not supported. The abstract summarizes the final adjusted sex-specific models, which are the Table 3 models. The Discussion says the sex-specific associations "do not change qualitatively" under alternative SGA standards, and the Web Material (Web Tables 1 and 2, INTERGROWTH and Oken standards) gives sex-specific coefficients but no interaction P values. No P value below 0.05 for HAZ or WAZ appears anywhere in the paper or supplement.
- Footnote conventions or a text-conversion artifact. Ruled out. Table 3 marks 0.063 and 0.059 with footnote d (P < 0.1) and 0.043 with c (P < 0.05). The publisher's HTML page, the PMC page and the Europe PMC JATS XML all carry "(P < 0.05 for all)" in the abstract and the same Table 3 values and footnotes. (Table 2 uses the opposite letter assignment, c = P < 0.1 and d = P < 0.05, but Table 3 defines its own footnotes and uses them consistently.)
- A correction already issued. None found (see Status).
- Side observation, not part of the main finding. The Results give the boys' SGA–ASQ interval as "95% confidence intervals: 1.11, 0.01"; Table 3 gives −1.110, 0.013. The minus sign on the lower limit is missing in the text.
Status
- Version of record. doi.org/10.1093/aje/kwy141 resolves to the publisher's page (academic.oup.com/aje/article/187/11/2324/5047920). Its abstract ends "...systematically larger for male than for female infants (P < 0.05 for all)", and its Results text and Table 3 carry the same P values and footnotes as quoted above. The PMC HTML page and the Europe PMC full-text XML agree. Every quotation here was checked verbatim against the PMC-archived text with
src/show.py. - Supplements. The single Web Material PDF (from the Europe PMC supplementary bundle) holds Web Tables 1 and 2, the sex-specific SGA and preterm coefficients under INTERGROWTH and Oken standards. It reports no interaction P values and nothing that supports "P < 0.05 for all". The other two files in the bundle are images for Figure 1.
- Corrections and comments. As of 2026-10-24 I found no correction, erratum, expression of concern or retraction.
src/known.py(re-run 2026-10-24) returns no Crossref update relations, PMC notices or Europe PMC notices. The Crossref record has empty update-to, updated-by and relation fields, a Crossref filter for updates to this DOI returns nothing, and neither the OUP article page nor the PMC page shows a correction link. The Europe PMC REST search returned HTTP 503 on repeated attempts, so its comment/correction list was checked only throughsrc/known.py. PubPeer could not be queried automatically (its API requires human verification); web searches found no PubPeer thread and no Retraction Watch entry for this article. - Sources. PMC article PMC6211242; https://doi.org/10.1093/aje/kwy141 (publisher page); https://pmc.ncbi.nlm.nih.gov/articles/PMC6211242/; Europe PMC full-text XML and supplementary files for PMC6211242; Crossref; PubPeer and Retraction Watch (web search).
Suggested correction
In the abstract, replace
but they were systematically larger for male than for female infants (P < 0.05 for all).
with, for example,
but they were systematically larger for male than for female infants (P for sex difference = 0.063, 0.059, and 0.043, respectively).
or, keeping a threshold form, "(P < 0.1 for all; P < 0.05 for neuropsychological development)". The authors may also wish to revise "were also negative" for neuropsychological development, since that association was not significant overall (−0.152; 95% CI −0.415, 0.112) and was positive though not significant in girls (0.094). In the third paragraph of the Results, "95% confidence intervals: 1.11, 0.01" should read "95% confidence intervals: -1.11, 0.01", as in Table 3.