← Back to the plain-language case
Figure 6D calls a TRPV4 knockout effect significant at p = 0.06706, above the 0.05 threshold
J Neurosci (2018) · doi:10.1523/JNEUROSCI.0897-18.2018 · PMC6181316
Summary
The Figure 6D legend says that conventional TRPV4 knockout (TRPV4KO) mice "showed significantly less photoreceptor cell death than WT mice" 24 h after retinal detachment. It marks the comparison with an asterisk and prints p = 0.06706. The Methods state one decision rule for these TUNEL comparisons: "p < 0.05 was considered significant". Since 0.06706 > 0.05, the comparison is not significant under the paper's own rule. Nothing in the paper (a one-sided test, a different threshold, a correction notice) reconciles the two. Of the 16 exact p-values printed in the paper, this is the only one above 0.05. The same comparison is the first result stated in the Abstract (a ~50% reduction in apoptotic photoreceptors). The paper's main conclusion still has other support, including the Müller-glia conditional knockout in the same legend (p = 0.020863, which is significant and consistent).
What the paper reports
Methods, "Statistical analysis":
The Mann–Whitney U test was used to compare unpaired values of TUNEL-positive cell density and proinflammatory cytokine concentration. The data analyses were performed using Excel 2016 (Microsoft) with add-in software Statce14@. p < 0.05 was considered significant.
Figure 6 legend, panel D:
Conventional TRPV4KO mice showed significantly less photoreceptor cell death than WT mice 24 h after retinal detachments (*p = 0.06706, n = 7 or 8 eyes). The TRPV4CKO mice showed significantly less photoreceptor cell death than WT mice (**p = 0.020863, n = 6 eyes). The TRPV4CKO results were perfectly matched with those in TRPV4KO, indicating that Müller glial TRPV4 activation accelerates photoreceptor cell death in RD.
Abstract:
After RD, the number of apoptotic photoreceptors was reduced by ∼50% in TRPV4KO mice relative to wild-type mice, indicating the possible involvement of TRPV4 activation in RD-induced photoreceptor cell death.
Results, TUNEL paragraph. This passage gives the size of the effect but does not call the KO result significant:
The number of dead photoreceptors in TRPV4KO mice was 50% less than that for WT mice (Fig. 6D).
Consistent with those previous reports and our data (Figs. 1–5), the number of dead photoreceptors in TRPV4CKO mice was 50% less than that for WT mice, and the results were perfectly matched with the result in the conventional TRPV4KO (Fig. 6D).
Discussion, second paragraph:
Indeed, our Müller glia-specific conditional KO mice can significantly reduce the RD-induced photoreceptor cell death (Fig. 6), and the reduction ratio of dead photoreceptors was perfectly the same as the conventional TRPV4KO mice (Fig. 6).
What the paper's own numbers show
Method. The paper gives no per-eye TUNEL counts, group summaries or U statistics, so the test cannot be rerun. Two checks are possible. First, compare each printed p with the threshold stated in the Methods. Second, ask whether 0.06706 is a plausible two-sided Mann–Whitney p for the stated sample sizes, and so whether it could be a misprint of a smaller value. For the second check I enumerated the exact null distribution of U for n = 7 vs 8 (6435 rank arrangements, assuming no ties), and for 7 vs 7 and 8 vs 8 because the legend says "7 or 8 eyes". I also computed the normal approximation with and without continuity correction. For context I collected every exact p-value printed in the paper. All numbers below are printed by recompute.py.txt.
| Quantity | Location | Reported | Recomputed |
|---|---|---|---|
| Significance threshold | Methods, Statistical analysis | "p < 0.05 was considered significant" | α = 0.05 |
| WT vs conventional TRPV4KO, TUNEL+ photoreceptors at 24 h | Fig. 6D legend | "significantly less", *p = 0.06706, n = 7 or 8 eyes | 0.06706 > 0.05 by 0.01706 (1.34 × the threshold); not significant under the stated rule. Equivalent |z| = 1.831, against 1.960 needed |
| WT vs TRPV4CKO | Fig. 6D legend | "significantly less", **p = 0.020863, n = 6 eyes | 0.020863 < 0.05; significant, consistent |
| Other exact p-values in the paper | legends of Figs. 4, 5, 7, 8, 9, 10 | 14 values, from 0.000116 to 0.012851 | all < 0.05. Of the 16 printed exact p-values, 0.06706 is the only one ≥ 0.05; the next largest is 0.020863 |
| Hypothetical one-sided reading | not stated in the paper | — | 0.06706 / 2 = 0.03353 (would be < 0.05). If 0.06706 were already one-sided, the two-sided p would be 0.13412 |
| Exact two-sided Mann–Whitney p near the printed value, n = 7 vs 8, no ties | recomputation | 0.06706 | U = 11: 0.05408; U = 12: 0.07211. The printed value lies between them, and both are above 0.05 |
| Normal approximations closest to 0.06706, n = 7 vs 8 | recomputation | 0.06706 | U = 12: 0.06408 (no continuity correction), 0.07285 (with); U = 11 with correction: 0.05620 |
| Same check for n = 7 vs 7 and 8 vs 8 | recomputation | 0.06706 | 7 vs 7: exact 0.05303 / 0.07284 (U = 9 / 10); 8 vs 8: exact 0.06496 / 0.08298 (U = 14 / 15) |
| Exact p near a misprint value of 0.006706, n = 7 vs 8 | recomputation | — | U = 5: 0.00591; U = 6: 0.00932. A value near 0.0067 is also within the attainable range, so a misprint cannot be excluded |
The printed 0.06706 is not itself an exact no-ties value for any of these sample sizes. Ties in the TUNEL densities, or a normal approximation as statistics add-ins commonly use, would give values between the exact steps. As printed, 0.06706 falls where an ordinary two-sided Mann–Whitney result for about 7–8 eyes per group would fall when the rank separation is just short of significance (U = 11–12 of a possible 56 for 7 vs 8).
Figure
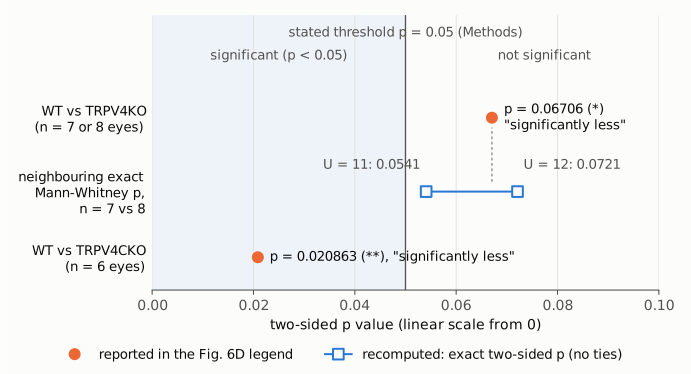
On a linear p-value axis starting at 0, the two orange dots are the p-values printed in the Figure 6D legend. Both comparisons are described there as "significantly less". The vertical line is the threshold stated in the Methods (p < 0.05), and the shaded band is the region the paper counts as significant. WT vs TRPV4CKO (p = 0.020863) lies inside it. WT vs conventional TRPV4KO (p = 0.06706) lies outside it. The blue open squares are recomputed: the two exact two-sided Mann–Whitney p-values on either side of the printed value for n = 7 vs 8 eyes with no ties (U = 11: 0.0541; U = 12: 0.0721). Both are above 0.05. Taken as printed, the knockout result is a two-sided value just short of significance.
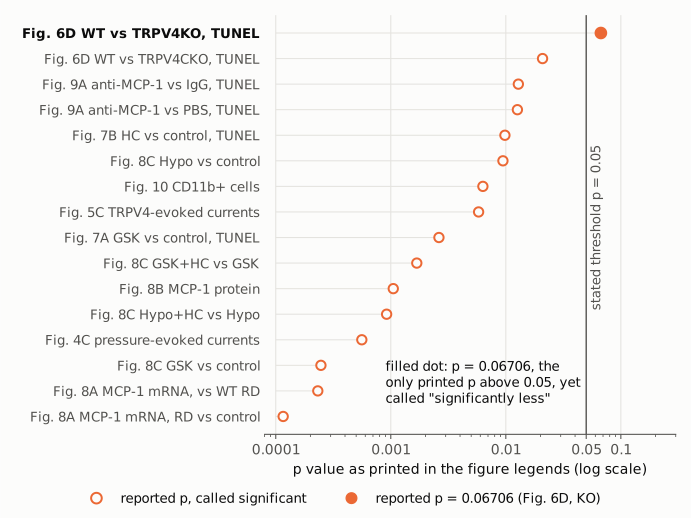
All 16 exact p-values printed in the paper's figure legends, sorted and shown on a log scale. Every open dot is a comparison the legends call significant, and each lies below 0.05. The filled dot (Fig. 6D, WT vs TRPV4KO, p = 0.06706) is the only printed value above the threshold, and the legend calls it "significantly less" all the same. Values are copied from the legends; panel letters follow the legends' own labels.
Why it matters
The WT vs conventional TRPV4KO comparison is the first result in the Abstract ("reduced by ∼50% in TRPV4KO mice relative to wild-type mice"). It is also one half of an argument made twice in the paper: the CKO effect is "perfectly matched" with, or "perfectly the same as", the conventional KO effect, and this match is used to assign the effect to Müller glial TRPV4. Under the paper's criterion, the KO side of that comparison is a non-significant trend (p = 0.067, about 7–8 eyes per group), not an established reduction. The direction of the effect does not change. The 50% figure cannot be checked because no group values are given.
The paper's overall conclusion, that Müller glial TRPV4 contributes to photoreceptor death after retinal detachment, is weakened but not overturned. In the same legend, the Müller-glia/astrocyte conditional knockout reaches significance (p = 0.020863, n = 6). The agonist GSK increases photoreceptor death (Fig. 7A, p = 0.002622). The antagonist HC reduces it (Fig. 7B, p = 0.009823). The MCP-1 and macrophage experiments (Figs. 8–10) point the same way. Readers who rely on the global-knockout result as an independent replication, or quote the Abstract's ~50% reduction as statistically established, are relying on a comparison that the paper's own numbers do not support at α = 0.05.
Explanations considered
- A different or looser threshold for this figure. The Methods give a single rule, "p < 0.05 was considered significant", and name the Mann–Whitney test for TUNEL densities. The Figure 6 legend sets no other threshold. This does not explain the discrepancy.
- A one-sided test. Halving 0.06706 gives 0.0335, which would pass. The paper never says that any test was one-sided; searches for "one-tailed", "two-tailed" and "one-sided" return nothing. If 0.06706 were already one-sided, the two-sided value would be 0.134, which is further from significance. This does not explain it unless an unstated convention was used.
- The asterisk convention. The paper uses asterisks inconsistently. In Fig. 6D a single * marks p = 0.067 and ** marks p = 0.021. In Figs. 8A and 8C asterisks mean p < 0.01, and in Fig. 8B the asterisk means p < 0.05. No convention in the paper makes 0.067 count as significant, so this does not explain it. The published figure image, as described in the version-of-record check, marks WT vs KO with a single asterisk, which matches the legend.
- A misprint for 0.006706 (or similar). This cannot be excluded without the raw data. A value near 0.0067 is attainable for n = 7 vs 8 (exact values 0.0059 and 0.0093 at U = 5 and 6). But 0.06706 is also an ordinary two-sided value for these sample sizes, between the exact values 0.054 and 0.072 and close to the normal approximations at U = 11–12. Nothing else in the paper points to a smaller value. If it is a misprint, then the p-value is wrong rather than the significance label. Either way the published text is internally inconsistent.
- A different comparison, population or test. The legend gives the comparison (WT vs conventional TRPV4KO, 24 h after detachment, n = 7 or 8 eyes) and the p-value in the same sentence. The legend does not name the test. Some other legends in the paper use Student's t test, but the threshold the paper states is the same whichever test was used.
- Multiplicity adjustment. An adjustment could only raise a p-value, so it cannot turn 0.067 into a significant result.
- Rounding. 0.06706 is printed to five decimals. No rounding brings it below 0.05.
- Scope of the claim. The word "significantly" for the KO comparison appears only in the Figure 6D legend, and there it carries an asterisk. The Results text reports "50% less" without a significance claim. The Discussion's "significantly" refers to the CKO, which is valid. The Abstract states the ~50% reduction as a finding without a p-value. So the explicit inconsistency is confined to the Fig. 6D legend, and the Abstract states the same result as established.
- A later correction. No correction, erratum or retraction is listed (see Status).
Status
As of 2026-10-23:
- Version of record. The wording and numbers above are in the publisher's typeset PDF as hosted by PMC (14 pages; page 7 for the Figure 6 legend, page 6 for Statistical analysis). They are also in the live PMC page and the Europe PMC full-text XML. Relation symbols in the PDF were read from rendered page images, because its text layer drops them. The publisher's own site (jneurosci.org) refused automated access, so its HTML was not compared. The inconsistency is in the publisher's typeset text, not a conversion artifact.
- Supplements. The article has no supplementary data files. The Europe PMC supplementary bundle contains only the figure images. The Fig. 6D dot plot shows individual eyes but no values, so nothing in the paper can settle whether the p-value or the significance label is wrong.
- Corrections. Crossref lists no update-to or updated-by relations, and a Crossref filter for works that update this DOI returned none. PMC and Europe PMC list no correction, erratum, expression of concern or retraction (checked with
src/known.pyand Europe PMC search, PMID 30143574). - PubPeer. PubPeer's search refused automated access (Cloudflare verification), so it could not be checked directly. A web search for the title found no PubPeer entry.
- Sources. PMC6181316; doi:10.1523/JNEUROSCI.0897-18.2018; Crossref and Europe PMC REST APIs.
Suggested correction
The Figure 6D legend should be made consistent with the Methods. There are two possibilities:
- If p = 0.06706 is correct: change the legend to describe the KO vs WT difference as a non-significant trend, for example "TRPV4KO mice showed a trend toward less photoreceptor cell death than WT mice (p = 0.067, n = 7 or 8 eyes)". Remove the asterisk from the figure. Qualify the Abstract's "reduced by ∼50%" sentence and the "perfectly matched" / "perfectly the same" statements to match.
- If the printed value is a misprint: give the correct p-value.
In either case, it would help readers if the authors stated the group sizes for each genotype (which group had 7 eyes and which had 8), the test used for Fig. 6D, whether it was one- or two-sided and exact or approximate, and the group summaries (median and range, or the per-eye values) behind the "50% less" figure.