← Back to the plain-language case
Printed hiPSC-CM telomere means contradict the stated 52% and 58% decreases and Figure 3C
Proc Natl Acad Sci U S A (2018) · doi:10.1073/pnas.1714538115 · PMC6140486
Summary
The Results report that cardiomyocytes derived from patient induced pluripotent stem cells (hiPSC-CMs) show "significant 52% and 58% decreases" in telomere signal for hypertrophic (HCM) and dilated (DCM) cardiomyopathy; the same sentence gives means of 6.16 ± 0.65 TFU for HCM and 5.70 ± 0.65 TFU for DCM, against a control mean of 5.83 ± 0.65 TFU. Those means differ from control by +5.7% and −2.2%, and as two-group comparisons they give P ≈ 0.73 and 0.89, not the stated P < 0.0005 and P < 0.0001. Figure 3C, which the sentence cites, shows group means of about 2.9 (HCM) and 2.3 (DCM) TFU against 5.83 for controls, decreases of about 50% and 60%, so the stated percentages and the figure agree and only the printed HCM and DCM means (and the shared ± 0.65) do not. This Q-FISH result is one of the "two independent assays" on which the Abstract's in vitro claim rests.
What the paper reports
Results, second paragraph (hiPSC-CM Q-FISH):
Importantly, in all cases, we measured telomeres in hiPSC-CMs at day 30 of differentiation. The five HCM hiPSC-CMs (6.16 ± 0.65 TFU, P < 0.0005; Table 1, blue) and eight DCM hiPSC-CMs (5.70 ± 0.65 TFU, P < 0.0001; Table 1, red) exhibited significant 52% and 58% decreases in telomere levels, respectively, compared with the control hiPSC-CMs of diverse etiology (5.83 ± 0.65 TFU; Fig. 3C, gray triangle and gray squares; Table 1, gray). These data are also shown for each patient line separately (Fig. 3C).
Abstract:
Telomere shortening was recapitulated in DCM and HCM CMs differentiated from patient-derived human-induced pluripotent stem cells (hiPSCs) measured by two independent assays.
Significance statement:
HCM and DCM CMs differentiated from human-induced pluripotent stem cells (hiPSCs) also exhibit significant telomere shortening relative to healthy controls.
Figure 3 legend (title, panel C, and final sentence):
HCM and DCM hiPSC-derived CMs recapitulate telomere shortening.
Telomere signal intensity per DAPI-stained nucleus is shown for HCM, DCM, and control hiPSCs (day 0) and hiPSC-CMs (day 30).
All data plotted as mean ± SEM (*P < 0.05, ***P < 0.001, and ****P < 0.0001).
Discussion:
We corroborated this shortening for patient hiPSC-CMs by two independent methods, Q-FISH analysis of single CMs (telomere signal relative to nuclear signal) and qPCR of FACS-enriched CM populations (telomere signal relative to single-copy gene signal).
Materials and Methods, statistics:
Statistical differences in primary patient samples and between the hiPSC and hiPSC-CM groups were analyzed by one-way ANOVA tests by comparing the mean of each group with the mean of every other group, followed by Holm–Šídák multiple comparison test.
All data are shown as the mean ± SEM.
The two other percentage statements used below as controls for the method (Results, first and third paragraphs):
the telomere levels of Troponin-T+ CMs in HCM and DCM hearts were significantly reduced by, on average, 25% and 40%, respectively, compared with age- and sex-matched healthy controls (HCM, 4.64 ± 0.46 TFU, P < 0.05; DCM, 3.70 ± 1.05 TFU, P < 0.0001; control, 6.21 ± 0.16 TFU; Fig. 1C).
The T/S ratios in HCM and DCM TMRM+ CMs were significantly reduced by, on average, 21% and 39%, respectively, compared with control CMs (HCM, 2.67 ± 0.18, P < 0.05; DCM, 2.06 ± 0.16, P < 0.0005; control, 3.40 ± 0.24; Fig. 3F).
What the paper's own numbers show
Method. I computed the percent change of each printed group mean against the printed control mean, 100 × (group / control − 1), and the reverse: the group mean that each stated decrease implies at the printed control (5.83 × (1 − d)), and the control that each printed group mean would need. I tested whether the printed means and SEMs could give the stated P values, using two-group Welch t tests and a one-way ANOVA built from the summary statistics with the line counts the text gives (5, 5 and 8). I then digitized the published Fig. 3C by pixel analysis: the axis ticks, the mean line and SEM caps of each group in the left panel (one dot per line), and the top edge of each of the 18 per-line bars in the right panel. One pixel is about 0.05–0.06 TFU, so these readings are approximate to that level; the pixel rows are listed in recompute.py.txt, which converts them. As a check on the method, I applied the same percent arithmetic to the paper's tissue Q-FISH and hiPSC-CM qPCR statements. Every number below is printed by recompute.py.txt.
| Quantity | Location | Reported | Recomputed from the paper's own numbers |
|---|---|---|---|
| HCM hiPSC-CM vs control | Results ¶2 | 6.16 vs 5.83 TFU; "52% decrease" | 6.16 / 5.83 = 1.057, +5.7% (an increase) |
| DCM hiPSC-CM vs control | Results ¶2 | 5.70 vs 5.83 TFU; "58% decrease" | 5.70 / 5.83 = 0.978, −2.2% |
| Mean implied by the stated decrease at control 5.83 | derived | 52%, 58% | HCM 2.80 TFU, DCM 2.45 TFU |
| Control implied by the stated decrease at the printed group mean | derived | 5.83 TFU | 12.83 (from HCM) and 13.57 (from DCM): no single control value fits both |
| HCM vs control P from printed means ± SEM | Results ¶2 | P < 0.0005 | Welch t = +0.36, P = 0.73 |
| DCM vs control P from printed means ± SEM | Results ¶2 | P < 0.0001 | Welch t = −0.14, P = 0.89 |
| One-way ANOVA from printed means ± SEM (5, 5, 8 lines) | Methods; Results ¶2 | significant | F(2,15) = 0.12, P = 0.89 |
| Control group mean ± SEM | Fig. 3C left panel | 5.83 ± 0.65 (text) | 5.83 ± 0.32 (read from figure) |
| HCM group mean ± SEM | Fig. 3C left panel | 6.16 ± 0.65 (text) | 2.94 ± 0.44 (read from figure) |
| DCM group mean ± SEM | Fig. 3C left panel | 5.70 ± 0.65 (text) | 2.32 ± 0.35 (read from figure) |
| Per-line bars, mean (range) | Fig. 3C right panel | — | control 5.80 (4.75–6.64); HCM 2.90 (1.55–4.17); DCM 2.31 (1.13–3.86) |
| Decrease vs control from the figure | Fig. 3C | 52% (HCM), 58% (DCM) | left panel −49.5% and −60.2%; bars −49.9% and −60.2% |
| ANOVA + Holm–Šídák on the per-line bar values | Fig. 3C; Methods | P < 0.0005 (HCM), P < 0.0001 (DCM); stars ***, **** | F(2,15) = 23.1; adjusted P = 1.8 × 10⁻⁴ (HCM), 1.6 × 10⁻⁵ (DCM) |
| Tissue Q-FISH decrease (control for the method) | Results ¶1; Abstract | 25% (Results) and 26% (Abstract) HCM; 40% DCM | 25.3% and 40.4% |
| hiPSC-CM qPCR T/S decrease (control for the method) | Results ¶3 | 21% HCM, 39% DCM | 21.5% and 39.4% |
The same arithmetic reproduces the paper's other four percentages to within rounding (the Abstract's 26% for tissue HCM is a minor rounding difference from the Results' 25%; 25.3% is exact). For the hiPSC-CM Q-FISH result the printed HCM and DCM means give the wrong sign for HCM and a negligible change for DCM, and they cannot produce the stated P values. The figure's group means, its per-line bars and its significance stars all fit the stated 52% and 58% decreases and P values. The figure's control mean matches the printed 5.83, but its SEMs (0.32, 0.44, 0.35) differ from the ± 0.65 printed identically for all three groups. No average of the plotted HCM or DCM lines, however weighted, can reach 6.16 or 5.70: the highest HCM bar is 4.17 and the highest DCM bar 3.86 TFU.
Figure
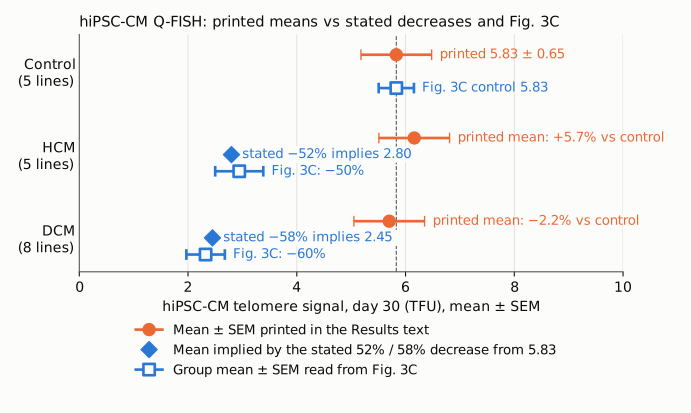
Figure 1. hiPSC-CM telomere signal (TFU) for the control, HCM and DCM groups, on one axis starting at zero. Orange circles: the mean ± SEM printed in the Results text. Blue diamonds: the group mean that the stated 52% and 58% decreases imply against the printed control mean of 5.83 (5.83 × 0.48 = 2.80 and 5.83 × 0.42 = 2.45). Blue open squares: the group mean ± SEM read from the published Fig. 3C left panel by pixel digitization (approximate to about 0.06 TFU). The dashed line marks the printed control mean, 5.83. The printed control matches the figure; the printed HCM and DCM means sit at the control level, while the stated decreases and the figure both place those groups near 2.3–2.9 TFU.
Why it matters
The Abstract states that telomere shortening "was recapitulated" in patient hiPSC-CMs "measured by two independent assays", the Significance statement says these cells "also exhibit significant telomere shortening", and the Discussion repeats that the shortening was corroborated by Q-FISH and qPCR. The Q-FISH sentence is the only place in the text where the hiPSC-CM Q-FISH effect is quantified. A reader who works from the printed means would find no shortening at all: HCM above control and DCM 2% below, with differences far inside one SEM. The text therefore does not support the claim it makes, and a reader cannot tell from it which numbers are correct.
The figure resolves most of this. Its group means and per-line bars give decreases of about 50% and 60%, close to the stated 52% and 58%, and P values of the stated order. On that reading the in vitro Q-FISH finding stands and the error is in the printed HCM and DCM means and in the SEM given for all three groups. The size of the in vitro effect also matters for the paper's comparisons: the hiPSC-CM decreases (about 50–60%) are larger than the tissue decreases (25% and 40%), which the printed means would hide.
Not affected: the tissue Q-FISH results (25.3% and 40.4%, reproduced), the VSMC null results, and the hiPSC-CM qPCR result (21.5% and 39.4%, reproduced), which is the second of the two assays.
Explanations considered
- Different time point or cell type (for example, day-0 hiPSC values instead of day-30 hiPSC-CMs). This cannot be excluded, but it cannot be confirmed either. The text says "in all cases, we measured telomeres in hiPSC-CMs at day 30 of differentiation" and names the control hiPSC-CMs as the reference. The Fig. 3 legend says panel C shows both "hiPSCs (day 0) and hiPSC-CMs (day 30)", but the published panel shows one set of values per line and does not label the day; it also has no gray triangle, which the text cites. If the printed 6.16, 5.70 and 5.83 belong to another data set, that would explain the numbers, but it would still leave the text's hiPSC-CM means wrong.
- A wrong control value. This does not account for the numbers. The stated decreases would need a control of 12.83 TFU (from HCM) and 13.57 TFU (from DCM), which no single value satisfies, and the figure's control mean matches the printed 5.83.
- Different definition, units or weighting of the means. This does not account for the numbers. All three means are in TFU, in one sentence, against one control. The per-line bars cap the possible group means: weighting the lines by the nucleus counts in Table 1 gives 6.05 (control), 3.34 (HCM) and 2.51 (DCM), still nowhere near 6.16 and 5.70.
- Rounding. This does not account for the numbers. The gap is a change of sign for HCM and a factor of about 25 in the size of the DCM change.
- Conversion or typesetting error in the archive. This is unlikely. The numbers are plain characters in the publisher-supplied JATS XML at Europe PMC and in the PMC text, with no superscripts, minus signs or table cells involved, and both copies agree. The publisher's HTML page could not be fetched (see Status).
- A correction already published. None was found (see Status).
Status
- Version of record. I compared the PMC-archived text (via
src/show.py) with the publisher-supplied JATS XML at Europe PMC (PMC6140486/fullTextXML). Both carry the quoted sentences with identical values. The doi.org link resolves to pnas.org, which returned HTTP 403 to automated requests, so the publisher's HTML and PDF were not read directly. Every quotation above was confirmed verbatim against the PMC-archived text. Figure 3 was read from the PMC copy of the published image (pnas.1714538115fig03.jpg); the figure readings are mine, by pixel digitization, and are approximate. - Supplements. The JATS XML has no supplementary-material element, and the PMC record lists none. The PNAS supplement URL returned HTTP 403, so the existence of an SI appendix could not be confirmed. No source data are deposited, so the exact group means cannot be computed from published material.
- Corrections and comments. As of 2026-10-24 I found no correction, erratum, expression of concern or retraction. Crossref lists no update relations for the DOI, and PMC and Europe PMC list no correction notices. A web search for corrections or comments found none. PubPeer refused automated access (HTTP 403), so it could not be checked directly.
- Sources. PMC article PMC6140486; Europe PMC full-text XML for PMC6140486; the PMC copy of Figure 3; Crossref; Europe PMC.
Suggested correction
- Replace the hiPSC-CM Q-FISH means in Results ¶2 with the values that underlie Fig. 3C and the stated decreases. The figure indicates about 2.9 TFU (HCM) and 2.3 TFU (DCM) against 5.83 TFU (control). Report each group's own SEM (the figure indicates about 0.44, 0.35 and 0.32), not one shared value.
- Confirm that the stated 52% and 58% decreases and the P values were computed from those corrected means, and state the unit of analysis for the ANOVA (lines or nuclei).
- If 6.16, 5.70 and 5.83 TFU are the day-0 hiPSC values mentioned in the Fig. 3 legend, report them as such, and either show the day-0 data in Fig. 3C or remove the reference to them from the legend; also reconcile the text's reference to a "gray triangle", which does not appear in the panel.
- Minor: reconcile the tissue HCM decrease given as 26% in the Abstract and 25% in the Results (4.64 / 6.21 gives 25.3%).