← Back to the plain-language case
24-month remission advantage over conventional psychoeducation: printed NNT, RR and p contradict the rates
Psychol Med (2017) · doi:10.1017/S0033291717000526 · PMC5551382
Summary
This three-arm randomized trial in schizophrenia-spectrum disorders reports that, at 24 months, complete remission was significantly more frequent with the mindfulness-based psychoeducation group (MBPEG) than with conventional psychoeducation (CPEG): 38.9% v. 27.0%, χ² = 4.1, p = 0.010, RR = 1.9, 95% CI 0.9–3.0, NNT = 2.0. These statistics do not agree with the two rates printed next to them, or with each other. The rates give an NNT of 8.4, not 2.0. They give a relative risk of 1.44, not 1.9. A χ² of 4.1 on 1 df gives p = 0.043, not 0.010, and a 95% CI from 0.9 to 3.0 contains 1, so it cannot go with p = 0.010. A 2×2 test on the counts nearest to the printed rates (43/111 v. 30/110) gives χ² = 3.28 and p = 0.070. This comparison is the only test of MBPEG against the active comparator on remission. The Abstract's conclusion that MBPEG improves remission "compared with TAU and CPEG" relies on it in part.
What the paper reports
Results, 'Complete remission' paragraph (Results, paragraph 4):
Complete remissions (4-month simultaneous ratings of all PANSS item scores ⩽3) were not significantly more likely in the MBPEG and CPEG than in the TAU group at times 2 and 3, but significant differences emerged during times 4 and 5. In addition, there was a significant difference on remission rate at the latest post-test between the MBPEG and CPEG [at 24 months: 38.9% v. 27.0%, χ2 = 4.1, p = 0.010, relative risk (RR) = 1.9, 95% confidence interval (CI) 0.9–3.0, number needed to treat (NNT) = 2.0].
Results, next paragraph (the model-based results):
The differences on the estimated odds between the two intervention groups, and between the MBPEG and TAU-alone group, were significant at 12 months (Δ = 1.6 and 1.3, 95% CI 0.58–2.83 and 0.45–2.31, p = 0.022 and 0.039) and 24 months follow-up (Δ = 2.9 and 1.9, 95% CI 0.98–4.38 and 0.65–2.89, p = 0.001 and 0.010). Mixed-effects logistic regression indicated a significant differential change in proportional ORs over the 24-month follow-up; 37 and 26% of the MBPEG and CPEG participants, respectively, but only 7.2% of the TAU group were in remission (χ2 = 8.9 and 8.0, p = 0.001 and 0.003, RR = 3.5 and 3.1, 95% CI 2.0–7.2 and 1.6–6.3, NNT = 3.2 and 4.6).
Abstract, Results and Conclusions:
The MBPEG and CPEG participants had significant differential changes in proportional odds ratios of complete remission (all individual PANSS items <3) over the 24-month follow-up (37 and 26%, respectively), as opposed to only 7.2% of the TAU group (χ2 = 8.9 and 8.0, p = 0.001 and 0.003, relative risk = 3.5 and 3.1, 95% confidence interval 2.0–7.2 and 1.6–6.3).
Compared with TAU and CPEG, MBPEG improves remission and hospitalization rates of people with schizophrenia spectrum disorders over 24 months.
Discussion, paragraph 1:
Nevertheless, significant greater symptom reduction and thus complete remission rates were observed among the participants receiving MBPEG when compared with the other two study groups at both 12- and 24-month follow-up. At 24-month follow-up, more than one-third of the participants receiving MBPEG were in complete remission, compared with about 26 and 7% of those receiving CPEG and TAU alone, respectively.
Methods, 'Statistical analyses':
Mixed-effects multilevel models were used to analyse the overall significance of the model (Wald χ2 statistic) and modelled (intention-to-treat) group differences on remission rates at 24-month follow-up (i.e. whether MBPEG and/or CPEG plus TAU was better or worse than TAU alone at the last follow-up time-point).
With only a few missing data over the 24-month follow-ups, the last data were brought forward for data imputation.
Results, paragraph 1:
Table 2 summarizes the demographic and clinical characteristics of the 342 patients in the three study groups (n = 114 in each group)
Table 3, remission rows (columns are times 2–5; time 5 is 24 months; column headings MBPEG n = 111, CPEG n = 110, TAU n = 112). The footnotes read "eχ2 Frequency between MBPEG and TAU, CPEG and TAU.fRR using TAU as reference."
| Row | MBPEG t2 | t3 | t4 | t5 | CPEG t2 | t3 | t4 | t5 | TAU t2 | t3 | t4 | t5 |
|---|---|---|---|---|---|---|---|---|---|---|---|---|
| Remission rate, % | 9.5 | 15.1 | 29.7 | 38.9 | 8.9 | 13.0 | 24.8 | 27.0 | 6.9 | 8.7 | 9.8 | 7.4 |
| χ² (p) v. TAU | 1.02 (0.50) | 3.0 (0.09) | 4.9 (0.01) | 5.9 (0.001) | 0.94 (0.55) | 2.8 (0.09) | 4.3 (0.03) | 4.0 (0.01) | – | – | – | – |
| RR v. TAU (95% CI) | 1.3 (0.5–2.4) | 1.7 (0.7–3.0) | 2.5 (1.3–4.9) | 2.0 (1.1–4.2) | 1.2 (0.4–0.2) | 1.6 (0.6–2.8) | 2.9 (1.1–4.1) | 2.8 (0.7–3.1) | – | – | – | – |
| NNT | 35 | 9.6 | 5.4 | 3.4 | 36 | 10.3 | 6.5 | 5.0 | – | – | – | – |
What the paper's own numbers show
Method. I took the two rates printed in the MBPEG v. CPEG sentence (38.9% and 27.0%, the same as Table 3 at time 5) and computed the standard quantities that the sentence reports. These are the risk difference and NNT = 1/(risk difference), the rate ratio and the odds ratio. I also checked the p value against the printed χ² (upper tail of χ² with 1 df, and with 2 df), and the printed CI against the printed RR and p value. For the Wald check, SE(log RR) = (ln 3.0 − ln 0.9)/(2 × 1.96), and p comes from z = ln(RR)/SE. The paper gives no remission counts, so I took the integer counts nearest to the printed rates for the Table 3 denominators (43/111 and 30/110) and for the randomized groups of 114 (44/114 and 31/114). I ran Pearson, Yates-corrected and Fisher exact tests on both 2×2 tables. I then found the number of patients per group that the printed rates would need to reach χ² = 4.1 or p = 0.010. Rounding of the printed rates (±0.05 points) is carried through. Every number below is printed by recompute.py.txt.
| Quantity | Location | Reported | Recomputed from the paper's numbers |
|---|---|---|---|
| NNT, MBPEG v. CPEG, 24 months | Results ¶4 | 2.0 | 1/(0.389 − 0.270) = 8.40 (8.33–8.47 over the rounding range); 9.09 from the Abstract's 37% v. 26% |
| Risk difference that NNT 2.0 implies | derived | NNT 2.0 | 0.50 (50 points); with CPEG at 27.0%, MBPEG would need 77.0% |
| Relative risk, MBPEG v. CPEG | Results ¶4 | 1.9 | 0.389/0.270 = 1.44 (1.436–1.445); odds ratio 1.72; RR 1.9 would need MBPEG at 51.3% |
| Point estimate implied by the CI 0.9–3.0 | Results ¶4 | 1.9 | log-scale midpoint 1.64 |
| p for the printed χ² = 4.1 | Results ¶4 | 0.010 | 0.043 (df = 1); 0.129 (df = 2); p = 0.010 needs χ² ≥ 6.63 |
| p implied by the printed CI 0.9–3.0 | Results ¶4 | 0.010 | Wald p = 0.106 centred on 1.64 (0.037 if centred on 1.9); the lower limit is below 1 under any rounding (≤ 0.95) |
| CI that p = 0.010 needs at RR 1.9 | derived | 0.9–3.0 | 1.17–3.10 |
| 2×2 test, 43/111 (38.7%) v. 30/110 (27.3%) | Table 3 n | χ² 4.1, p 0.010 | Pearson χ² = 3.28, p = 0.070; Yates χ² = 2.79, p = 0.095; Fisher p = 0.086; RR 1.42 (95% CI 0.97–2.09); NNT 8.7 |
| 2×2 test, 44/114 (38.6%) v. 31/114 (27.2%) | ITT n = 114 | χ² 4.1, p 0.010 | Pearson χ² = 3.36, p = 0.067; Yates 2.86, p = 0.091; Fisher p = 0.090; RR 1.42 (0.97–2.07); NNT 8.8 |
| Largest χ² the printed rates allow with 114 per group | derived | χ² 4.1 | 3.65 (p = 0.056); 3.72 (p = 0.054) at the most favourable rounding |
| Patients per group the printed rates need | derived | 114 randomized per group | 120 for p = 0.05; 128 for χ² = 4.1; 207 for p = 0.010 |
| Integer counts matching 38.9%, 27.0% and 7.4% | Table 3 n 111 / 110 / 112 | 38.9 / 27.0 / 7.4% | none exists; nearest 43/111 = 38.7%, 30/110 = 27.3%, 8/112 = 7.1% |
The NNT is wrong by a factor of about four, which rounding cannot explain. The RR does not fit the rates and is not centred in its own interval. The p value does not fit the χ² printed beside it or the interval printed beside it. Every test reconstructed from the printed rates gives p between 0.054 and 0.095, and a Wald test centred on the printed interval gives 0.106. Even at the paper's full randomized size of 114 per group, rates of 38.9% and 27.0% do not reach p < 0.05 with a Pearson χ² test.
Context: the other remission statistics follow the same pattern. These are secondary, but they bear on whether the rates or the statistics are the problem. In Table 3 the 24-month RRs against TAU (2.0 and 2.8) do not match the rate ratios (38.9/7.4 = 5.26 and 27.0/7.4 = 3.65). The CPEG interval at 24 months, 0.7–3.1, includes 1 next to "4.0 (0.01)". At time 2 the CPEG RR is printed as "1.2 (0.4–0.2)", where the upper limit is below both the lower limit and the estimate. Several χ²–p pairs disagree. For 1 df, 5.9 gives p = 0.015 (printed 0.001), 4.9 gives 0.027 (printed 0.01) and 4.0 gives 0.046 (printed 0.01). The same 24-month comparisons with TAU appear as χ² 5.9 and 4.0, RR 2.0 and 2.8 in Table 3, and as χ² 8.9 and 8.0, RR 3.5 and 3.1 in the Results and Abstract. The NNTs against TAU fit the rates more closely: 3.2 and 5.1 from the table rates (table: 3.4 and 5.0), and 3.36 and 5.32 from the text rates (text: 3.2 and 4.6). The 2.0 for MBPEG v. CPEG is the outlier.
Figure
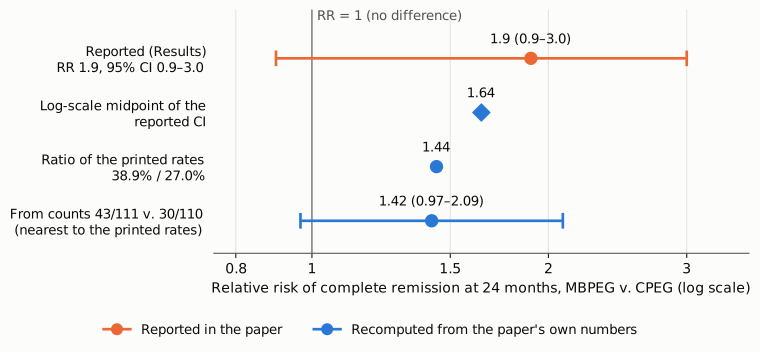
Figure 1. The relative risk of complete remission at 24 months, MBPEG v. CPEG, on a log scale. The thin vertical line is RR = 1 (no difference). Orange shows what the Results report: RR 1.9 with 95% CI 0.9–3.0. Blue shows three values recomputed from the paper's own numbers. The first is the log-scale midpoint of the reported interval (1.64). The second is the ratio of the two printed rates (1.44). The third is the RR and 95% CI from the integer counts nearest to the printed rates, 43/111 v. 30/110: 1.42 (0.97–2.09). The reported point sits off-centre in its own interval, and the rates give a smaller ratio. Every interval drawn crosses RR = 1, which does not fit a reported p of 0.010.
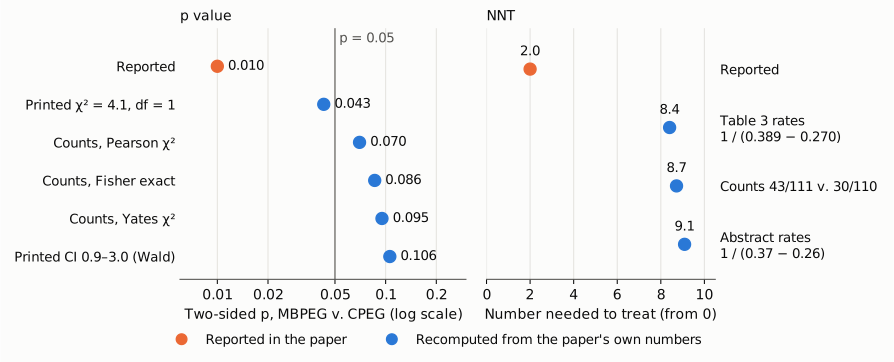
Figure 2. Left: the two-sided p value for MBPEG v. CPEG remission at 24 months, on a log scale, with p = 0.05 marked. Orange is the reported p = 0.010. Blue values are recomputed: from the printed χ² = 4.1 with 1 df (0.043); from 2×2 tests on 43/111 v. 30/110 (Pearson 0.070, Fisher exact 0.086, Yates 0.095); and from a Wald test on the printed CI 0.9–3.0 (0.106). Right: the number needed to treat, on a linear axis starting at 0. The reported NNT is 2.0. The NNT from the Table 3 rates is 8.4, from the reconstructed counts 8.7, and from the Abstract's 37% v. 26% 9.1.
Why it matters
The trial has an active comparator, so the MBPEG v. CPEG contrast is the one that separates the mindfulness component from psychoeducation as such. On remission, the Results sentence quoted above is the only direct test of that contrast. Its printed statistics make the difference look both significant and large. An NNT of 2.0 would mean one extra remission for every two patients given MBPEG instead of CPEG. The paper's own rates give one extra remission for every eight to nine patients, about a quarter of the stated benefit. They give a relative risk near 1.4 with a 95% interval that reaches below 1. Every test reconstructed from the rates gives p between 0.054 and 0.095, and a Wald test centred on the printed interval gives 0.106. Only the printed χ² of 4.1, taken alone, would give p below 0.05 (0.043), and no reconstruction from the rates reaches that χ². On the printed rates, this comparison is not statistically significant at the paper's stated α of 0.05.
The Abstract's Conclusions say "Compared with TAU and CPEG, MBPEG improves remission", and the Discussion says remission was significantly greater with MBPEG "when compared with the other two study groups at both 12- and 24-month follow-up". The Abstract's own remission statistics compare each intervention only with TAU. The 'versus CPEG' part of the remission claim therefore rests on the sentence examined here, and on a model-based odds difference (Δ = 2.9, 95% CI 0.98–4.38, p = 0.001). That model result cannot be checked from what is published: no coefficients or counts are given, and Δ is not defined as a difference or a ratio.
Other results are not affected. The superiority of both interventions over TAU on remission survives any reconstruction: the nearest counts give χ² = 31.6 for MBPEG v. TAU (43/111 v. 8/112) and χ² = 15.9 for CPEG v. TAU (30/110 v. 8/112). The length-of-rehospitalization and PANSS results are not involved either. However, the other remission statistics (described above) show that the reported χ², p, RR and CI values throughout the remission analysis cannot be relied on as printed.
Explanations considered
- Rounding of the printed rates. This does not account for the numbers. Over the full rounding range (38.85–38.95% v. 26.95–27.05%), the NNT stays between 8.33 and 8.47 and the RR between 1.436 and 1.445.
- The NNT, RR, CI and p come from a model, not the raw rates. This does not account for the numbers. The sentence gives the statistics in one bracket with the raw rates and calls them χ², RR and NNT, and it names no model. An adjusted model could move the RR somewhat. It could not make a 95% CI of 0.9–3.0 go with p = 0.010, or a χ² of 4.1 on 1 df give p = 0.010. An NNT of 2.0 needs a risk difference of 50 points, which no adjustment of an 11.9-point raw difference would plausibly produce. The paper does report model-based remission rates (37% v. 26%), but those give an NNT of 9.1 and an RR of 1.42, which is no closer.
- A different number of degrees of freedom or a one-sided test. This does not account for the numbers. χ² = 4.1 gives p = 0.129 on 2 df. A one-sided version of the 1-df test would give 0.021, not 0.010. And the CI includes 1 whichever way it is read.
- NNT computed against the wrong group (TAU). This does not account for the numbers. Against TAU, the 24-month NNT is 3.2 from the table rates and 3.4 from the text rates, not 2.0.
- A different denominator. This does not account for the numbers. The paper gives three denominators: 342 randomized (114 per group) in the Results, n = 111/110/112 in the Table 3 headings, and n = 265 in the Table 3 caption. None of 38.9%, 27.0% or 7.4% is an exact integer count of the Table 3 group sizes, so the rates may rest on yet other denominators. With the printed rates, however, a Pearson χ² stays below 3.84 for any group size up to the 114 randomized per group. Reaching χ² = 4.1 would take about 128 per group, and p = 0.010 about 207 per group.
- A conversion or typesetting error in the archived text. This is excluded. The publisher's PDF has the same sentence with the same values, and so do the Cambridge Core HTML and the Europe PMC XML (see Status).
- Explained in a supplement or later corrected. This is excluded. There is no supplementary data file with remission counts, and the only correction notice concerns a different issue (see Status).
Status
- Version of record. The publisher's PDF from Cambridge (S0033291717000526a.pdf, 16 pages) has the same MBPEG v. CPEG sentence (38.9% v. 27.0%, χ2 = 4.1, p = 0.010, RR 1.9, 95% CI 0.9–3.0, NNT 2.0). It also has the same Abstract remission sentence and Conclusions. I read it with PyMuPDF on 2026-10-24. The workflow's version-of-record check found the same values in the Cambridge Core HTML, the Europe PMC full-text XML and the publisher's Table 3 image. Every quotation above was confirmed verbatim against the PMC-archived text with
src/show.py. The Table 3 rows are transcribed from the PMC table. - Supplements. The article has no supplementary data file. The Europe PMC supplementary files hold only the publisher's figure and table images. The appendix table at the end of the publisher's PDF gives means and SDs of the continuous outcomes by clinic and time. It has no remission counts, RRs or NNTs, so the correct statistics cannot be computed from published material.
- Corrections and comments. One notice exists: a Corrigendum, doi:10.1017/S0033291723000041 (PMC10123818), published online 2023-01-20. It states that this multi-site trial shared part of its data and results with an earlier single-site (Hong Kong) report of the same registered trial (NCT01667601). It does not change any remission statistic. Crossref lists no other update, and PMC and Europe PMC list no other notice. A web search found no comment on these statistics. PubPeer refused automated access (HTTP 403, Cloudflare challenge), so PubPeer could not be checked directly. Status as of 2026-10-24.
- Sources. The PMC article PMC5551382; the publisher's PDF and the Cambridge Core page via doi:10.1017/S0033291717000526; the Europe PMC full text and supplementary files for PMC5551382; Crossref; the Corrigendum PMC10123818; ClinicalTrials.gov NCT01667601 (cited in the paper).
Suggested correction
- Report the remission counts and denominators for each group at each follow-up, and state which population (completers, LOCF-imputed intention-to-treat, or other) the Table 3 rates use.
- For MBPEG v. CPEG at 24 months, report a test, RR, 95% CI and NNT that match those counts. With the printed rates 38.9% v. 27.0%, these are approximately RR 1.4 (95% CI about 0.97–2.1), NNT 8–9 and χ² ≈ 3.3 (p ≈ 0.07). On that basis, remove "significant" from the Results sentence.
- Revise the Abstract's Conclusions and the Discussion so that MBPEG is not described as improving remission compared with CPEG, unless a correctly specified and fully reported model supports it. If the model-based Δ = 2.9 (p = 0.001) is meant to support that claim, define Δ and report the model estimates it comes from.
- Recheck the χ², p, RR and CI entries of the Table 3 remission rows and the corresponding Results and Abstract values against the counts. The values that need it include the RR "1.2 (0.4–0.2)", the χ²–p pairs that do not match on 1 df, the RRs against TAU that differ from the rate ratios, and the table-versus-text differences for the same 24-month comparisons (χ² 5.9 v. 8.9, 4.0 v. 8.0; RR 2.0 v. 3.5, 2.8 v. 3.1).
- Reconcile the sample sizes: 342 randomized (114 per group), n = 111/110/112 in the Table 3 headings, and n = 265 in the Table 3 caption.