← Back to the plain-language case
Abstract says PZ DNA has greater twist; the paper's tables and Results show it 12° lower
Nucleic Acids Res (2017) · doi:10.1093/nar/gkx144 · PMC5397145
Summary
The abstract says that in 50 μs MD simulations the duplex with six consecutive P:Z pairs shows "greater average values of stagger, slide, rise, twist and h-rise" than a G:C control. The paper's own data show the opposite for twist. In Table 3, mean twist is 21.6 ± 15.2° for PZ/PZ and 33.6 ± 4.3° for GC/GC, so PZ is 12.0° lower. H-twist is 22.1 versus 34.3°, or 12.2° lower. The Results text agrees with the tables ("about 10° smaller"), and so do the crystal values in Table 2 and every step of the substituted region in the supplement. The abstract is the only place that gives this direction. It is also the part most readers and indexing services pick up, so a reader could come away believing that PZ-rich DNA is more twisted than natural DNA, when the paper's results show less twist and a partly A-like helix.
What the paper reports
Abstract:
In these simulations, the PZ-containing DNA duplex exhibits a significantly wider major groove and greater average values of stagger, slide, rise, twist and h-rise than observed for a ‘control’ oligonucleotide in which P:Z nucleobase pairs are replaced by G:C.
Results and Discussion, "Time convergence and statistics of structural parameters in the MD simulations", paragraph 2:
On the other hand, the mean values for twist and h-twist are about 10° smaller on average for PZ/PZ than GC/GC pairs, with a greater variance (Table 3).
The same paragraph, on stagger and slide:
with the exception of stagger, which is twice as large for the PZ than the GC helix
the average ‘slide’ value is three times larger for the oligonucleotide containing six consecutive P:Z nucleobase pairs compared with that of the control oligonucleotide
The same section, paragraph 3:
In contrast to GC, distributions for PZ are bimodal for slide, twist and h-twist. The values associated with the larger peak in each case are within the range of values reported for A-form.
Table 3, "Helix parameters calculated from the MD trajectories of the PZ and GC-containing DNA duplexes" (excerpt, mean ± SD):
PZ/PZ | … | Twist (°) 21.6 ± 15.2
GC/GC | … | Twist (°) 33.6 ± 4.3
PZ/PZ | … | H-Twist (°) 22.1 ± 16.4
GC/GC | … | H-Twist (°) 34.3 ± 4.2
Table 3, footnotes a and b:
Precision bounds are based on a 95% confidence interval with respect to the standard error of the mean (<0.08 Å and 1° for lengths and angles, respectively).
We have arbitrarily chosen to list only GC/GC and PZ/PZ dinucleotide steps; values for GG/CC and PP/ZZ are given in Supplementary Tables S5–S8.
Table 2, "Comparison of experimental and computational PZ and GC Helix parameters" (central step):
H-Twist (°) | PZ Exp. 29.4 | PZ Comp. 22.1 | GC Exp. 45.0 | GC Comp. 34.3
What the paper's own numbers show
Method. I took the eight PZ/PZ and GC/GC parameters in Table 3 that bear on the abstract sentence and computed PZ minus GC, both as signed values and as magnitudes, so that a magnitude reading of "greater" is tested as well. I then checked the same comparison in Table 2 (MD and crystal), and at each of the seven dinucleotide steps of the substituted region in Supplementary Tables S6 (twist) and S7 (h-twist), matching each PZ step to the GC step at the same position. All arithmetic is in recompute.py.txt.
| Quantity | Location | Reported | Recomputed from the paper's own numbers |
|---|---|---|---|
| Direction of twist, PZ vs GC | Abstract | "greater average values of … twist" | the tables show the opposite (rows below) |
| Twist, PZ/PZ vs GC/GC (MD) | Table 3 | 21.6 ± 15.2° vs 33.6 ± 4.3° | PZ − GC = −12.0° (lower, signed or by magnitude) |
| H-twist, PZ/PZ vs GC/GC (MD) | Table 3; Table 2 "Comp." | 22.1 ± 16.4° vs 34.3 ± 4.2° | −12.2° (lower) |
| H-twist, central step (crystal) | Table 2 "Exp." | 29.4° vs 45.0° | −15.6° (lower) |
| Size of the twist difference in the text | Results, paragraph 2 | "about 10° smaller" | 12.0° (twist) and 12.2° (h-twist); same direction as the tables |
| Twist, all seven steps of the substituted region | Tables S6 | e.g. PP/ZZ 22.6 vs GG/CC 30.0; ZA/TP 28.8 vs CA/TG 30.3 | −1.5, −3.8, −7.4, −12.0, −6.6, −3.8, −1.5°; PZ lower at 7 of 7 steps; mean −5.2° |
| H-twist, all seven steps | Table S7 | e.g. PP/ZZ 24.6 vs GG/CC 31.1 | −2.5, −3.4, −6.5, −12.2, −5.7, −3.5, −2.4°; PZ lower at 7 of 7; mean −5.2° |
| Twist difference against the stated precision | Table 3 footnote a (1° for angles) | — | 12 times the precision bound; 1.07 pooled SDs (pooled SD 11.17°) |
| Twist spread | Table 3 | SD 15.2° vs 4.3° | variance 12.5 times larger for PZ |
| Stagger | Table 3; Abstract; Results "twice as large" | −0.19 vs −0.08 Å | magnitude larger (ratio 2.38); signed value lower (−0.11 Å) |
| Slide | Table 3; Abstract; Results "three times larger" | −2.86 vs −0.78 Å | magnitude larger (ratio 3.67); signed value lower (−2.08 Å) |
| Rise | Table 3; Abstract | 3.29 vs 3.19 Å | +0.10 Å (greater) |
| H-rise | Table 3; Abstract | 3.11 vs 3.08 Å | +0.03 Å (greater) |
| Major groove width | Table 3; Abstract | 26.8 vs 21.0 Å | +5.8 Å (wider) |
Of the five parameters the abstract calls "greater", rise and h-rise are greater as signed values, and stagger and slide are greater in magnitude, since both are more negative for PZ. Twist is the only one that is lower under either reading. Twist values are all positive, so the sign question does not arise for it.
Figure
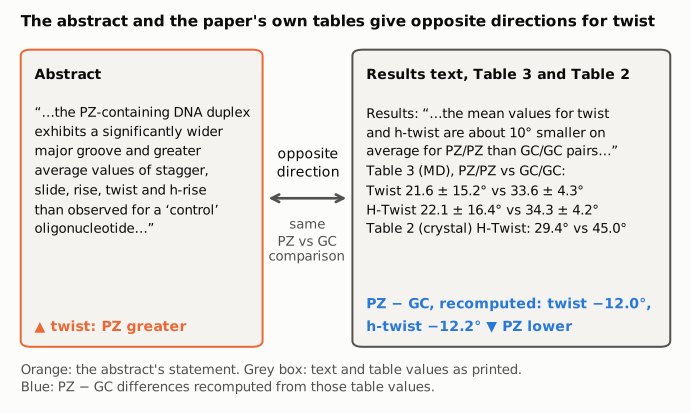
Figure 1. The two places where the paper states the direction of the PZ versus GC twist difference. Left (orange): the abstract, which lists twist among the parameters with "greater average values" for the PZ duplex. Right: the Results sentence and the Table 3 and Table 2 values for the same comparison, as printed. The blue line at the bottom of the right panel gives the differences recomputed from those table values: twist −12.0° and h-twist −12.2° (PZ minus GC). The text excerpts are quoted verbatim; the table rows are shortened to the twist and h-twist columns.
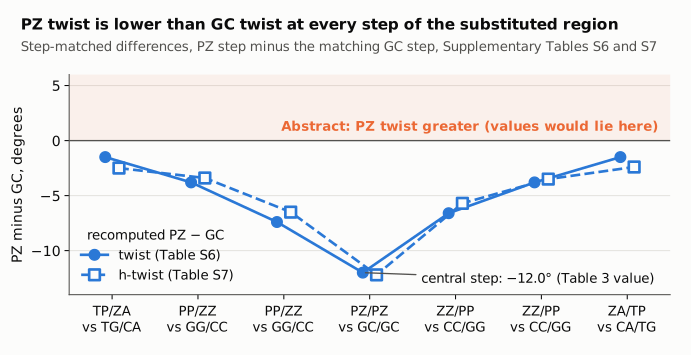
Figure 2. Differences between PZ and GC twist (filled circles, solid line, Supplementary Table S6) and h-twist (open squares, dashed line, Supplementary Table S7), recomputed for each dinucleotide step of the substituted region, with the PZ step matched to the GC step at the same position. The horizontal line marks no difference. The shaded band above it is where the values would lie if the abstract's "greater twist" were right. All fourteen differences are negative, from −1.5° at the flanking TP/ZA and ZA/TP steps to −12.0° (twist) and −12.2° (h-twist) at the central PZ/PZ step reported in Table 3. So no choice of step or average within the paper's data gives a greater twist for PZ.
Why it matters
- The abstract states the wrong direction for a reported structural result. Twist is one of the five helical parameters the abstract singles out. A reader who relies on the abstract, or on abstract-based summaries and databases, would conclude that PZ DNA is more twisted than natural DNA. The paper's data show lower twist for PZ, by about 12° at the central step and by 1.5 to 12° at every substituted step.
- The corrected direction fits the paper's own interpretation. The paper describes PZ DNA as having "properties associated with both B- and A-form DNA" (section title) and reports that the larger peak of the bimodal twist distribution lies "within the range of values reported for A-form". A-form DNA has lower twist than B-form. Lower twist for PZ therefore supports the paper's reading, and the abstract's "greater twist" points the other way.
- The difference is not marginal. The 12.0° gap is 12 times the 1° precision bound the paper gives for angles and about one pooled SD of the twist distributions.
- The analysis and the main conclusions are unaffected. The simulations, the tables, the Results text, the wider major groove, the larger slide, the A/B-form classification and the proposed nitro-group stacking mechanism do not depend on the abstract's wording. The error is confined to one word in one sentence of the abstract. Researchers working on expanded genetic alphabets (P:Z is part of the AEGIS system) and on force fields for non-natural bases are the readers most likely to take the parameter trends from the abstract. The paper has been cited 18 times (Crossref count supplied with the evidence file).
Explanations considered
- "Greater" meant in magnitude. This explains stagger and slide, which are larger in magnitude but more negative for PZ. It does not explain twist: twist is positive for both duplexes, and PZ is lower whether the values are compared signed or by magnitude (21.6 vs 33.6°).
- "Greater" refers to the spread, not the mean. PZ twist does vary much more (SD 15.2 vs 4.3°, a 12.5-fold variance). But the abstract says "greater average values", and the Results treat mean and spread as separate statements ("about 10° smaller on average … with a greater variance"). So the paper itself does not use "greater" to mean "more variable".
- A different dinucleotide step or a different average. Table 3 lists only the PZ/PZ and GC/GC steps, and footnote b points to the supplement for the others. Supplementary Tables S6 and S7 give twist and h-twist at all seven steps of the substituted region, and PZ is lower at every one of them (Figure 2). The seven-step means are also lower for PZ (twist 25.4 vs 30.7°, h-twist 27.0 vs 32.1°). The histograms in Figure 2 of the paper, which pool the PZ/PZ and PP/ZZ steps, have their larger PZ peak in the A-form range, which is again lower twist.
- Crystal versus simulation. The abstract sentence is about the simulations. Even so, the crystal values in Table 2 point the same way (h-twist 29.4 vs 45.0°, −15.6°). The paper notes that "the helical twist values are larger for both in the crystal structures", which compares crystal with MD rather than PZ with GC.
- Incomplete convergence. The 12° gap is 12 times the stated precision bound, and the Results text, which describes the same averages, gives the direction the tables give.
- A text-conversion artifact. Ruled out. The publisher's page, the PMC page, the Europe PMC JATS XML and the PubMed abstract (PMID 28334863) all carry the same abstract wording, and the twist values sit under the Twist (°) and H-Twist (°) headers in the XML.
- A correction already issued. None found (see Status).
- Side observations, not part of the finding. The Results text's "about 10°" is 12.0° and 12.2° in the tables, and its "three times larger" slide is a ratio of 3.67; both are approximations in the correct direction. Supplementary Table S6 gives the PZ/PZ twist SD as 15.3° and tilt as 0.1°, where Table 3 has 15.2° and 0.2°. None of these bears on the direction of twist.
Status
- Version of record. The publisher's page (https://doi.org/10.1093/nar/gkx144, which resolves to academic.oup.com) has the same abstract sentence, the same Results sentence and the same Table 3 values as the PMC copy. The PMC page and the Europe PMC full-text XML match it word for word and number for number. The PubMed abstract (PMID 28334863) has the same wording.
- Supplements. The only supplement,
gkx144_Supp.pdf(54 pages, from the Europe PMC supplementary bundle), was read in full for the step and helix parameters. Tables S6 and S7 give twist and h-twist at every step of the substituted region. PZ is lower at all of them, so the supplement does not support "greater twist" either. - Corrections and comments. As of 2026-10-24 I found no correction, erratum, retraction or expression of concern.
src/known.py(re-run 2026-10-24) returns no Crossref update relations, no PMC notices and no Europe PMC notices. The Crossref record has no update-to or updated-by fields, the PubMed record has no CommentsCorrections entries, and the publisher's page shows no notice. Searching Retraction Watch for "gkx144" returned nothing, and a web search for the title together with correction, erratum or PubPeer found nothing. PubPeer could not be queried directly, because its search requires an interactive human-verification step, and the Europe PMC search service returned 503 errors during the check. - Sources. PMC article PMC5397145; Europe PMC full-text XML and supplementary files for PMC5397145;
gkx144_Supp.pdf; https://doi.org/10.1093/nar/gkx144; Crossref; PubMed (PMID 28334863); Retraction Watch database; web search.
Suggested correction
In the abstract, replace
greater average values of stagger, slide, rise, twist and h-rise than observed for a ‘control’ oligonucleotide
with
larger magnitudes of stagger and slide, greater average rise and h-rise, and lower average twist and h-twist than observed for a ‘control’ oligonucleotide
This keeps the abstract consistent with Table 3 and with the Results text. If the authors prefer a shorter change, removing "twist" from the list of "greater" parameters and adding "and smaller twist" would correct the direction. The Results text could also give the twist difference as about 12° instead of "about 10°", to match Table 3 (12.0° for twist, 12.2° for h-twist).