← Back to the plain-language case
Abstract's patient-handwashing confidence interval is impossible and conflicts with the paper's own non-significant clustered estimate
BMJ Glob Health (2016) · doi:10.1136/bmjgh-2016-000103 · PMC5321376
Summary
The abstract reports two behaviour changes after an infection prevention and control (IPC) workshop: maintenance of distance, RR 1.09 (95% CI 1.02 to 1.16), and patient handwashing, RR 1.19 (95% CI 1.3 to 1.25). The handwashing interval cannot be a confidence interval, because its lower limit (1.3) is above its upper limit (1.25) and the point estimate (1.19) lies outside it even if the limits are swapped. The paper's own clustered GEE analysis in Table 4, the analysis the Methods specify, gives handwashing RR 1.27 (0.95 to 1.71) and distance RR 1.11 (0.83 to 1.48). Neither is significant, and the Results text says handwashing "increased though not significantly". The abstract's distance figure equals, to two decimals, a crude risk ratio computed from the Table 4 counts that ignores clustering. As printed, the abstract presents as statistically significant two improvements that the body of the paper reports as non-significant.
What the paper reports
Abstract, Results:
The maintenance of distance (RR 1.09, 95% CI 1.02 to 1.16) and patient handwashing (RR 1.19, 95% CI 1.3 to 1.25) improved to >90%.
Results, "Adherence to IPC behaviours", first paragraph:
Patient handwashing, with or without HCW prompting, increased though not significantly from 82% to 99% (RR 1.21, 95% CI 0.95 to 1.71).
Results, "Adherence to IPC behaviours", second paragraph:
Virtually all HCWs stood 1.5 m from patients, increasing from 91% to 99% at follow-up (RR 1.11, 95% CI 0.83 to 1.48).
Table 4, screening block (columns: baseline correct, per cent, n = 90 | follow-up correct, per cent, n = 131 | RR | 95% CI):
Patient washed hands directly or washed on direction from HCW | 74 | 82 | 130 | 99 | 1.27 | 0.95 to 1.71†
Stood 1.5 m from patient | 82 | 91 | 130 | 99 | 1.11 | 0.83 to 1.48†
Table 4 footnote:
*Risk ratio using binomial regression (family: binomial, link: log) accounting for clustering at the health facility level (GEE).
†Indicates that a Poisson regression (family: Poisson, link: log) was used due to the failure of the binomial model to converge.
Methods, "Data analysis":
Generalised estimating equations (GEE) with robust SEs accounted for repeated measures among HCWs and clustering within PHUs.
For all statistical tests, a significance level of p<0.05 was chosen.
Discussion, first paragraph:
During workshops, HCWs focused on improving screening, maintaining physical distance and encouraging patient handwashing; changes in these domains were reflected in the improvements seen in these behaviours at follow-up. Significant improvements were not consistent across behaviours, partly due to several high baseline values (>80%).
What the paper's own numbers show
Method. I checked the abstract's handwashing interval for internal validity (lower limit no greater than upper limit, point estimate inside). From the Table 4 counts I recomputed each percentage and a crude follow-up versus baseline risk ratio with a log-scale Wald 95% CI, ignoring clustering. For each printed Table 4 interval I took the geometric centre, sqrt(lower × upper), which equals the point estimate of a symmetric log-scale interval, and the standard error it implies, ln(upper/lower)/3.92. I then compared the abstract's and the Results text's figures with both analyses. The GEE estimates themselves cannot be re-derived, because they need facility- and worker-level data. Every number below is printed by recompute.py.txt.
| Quantity | Location | Reported | Recomputed from the paper's numbers |
|---|---|---|---|
| Handwashing 95% CI, ordering | Abstract | 1.3 to 1.25 | lower limit 1.3 > upper limit 1.25: not a valid interval |
| Handwashing RR inside its CI? | Abstract | RR 1.19 | 1.19 lies outside 1.25–1.3, so it is outside the interval even with the limits swapped |
| Patient handwashing, % correct | Table 4; Results text | 82% → 99% | 74/90 = 82.2%, 130/131 = 99.2% |
| Handwashing RR, crude (ignoring clustering) | from Table 4 counts | — | 1.21 (1.10 to 1.33); log SE 0.050 |
| Handwashing RR, GEE Poisson | Table 4 | 1.27 (0.95 to 1.71) | centre of printed CI 1.275: internally consistent; implied robust log SE 0.150; includes 1 |
| Handwashing RR | Results text | 1.21 (0.95 to 1.71) | point estimate = crude 1.207; interval = the Table 4 GEE interval (centred on 1.275) |
| Stood 1.5 m at screening, % correct | Table 4; Results text | 91% → 99% | 82/90 = 91.1%, 130/131 = 99.2% |
| Distance RR, crude (ignoring clustering) | from Table 4 counts | — | 1.089 (1.019 to 1.164), i.e. 1.09 (1.02 to 1.16) |
| Distance RR | Abstract | 1.09 (1.02 to 1.16) | identical to the crude, unclustered value above |
| Distance RR, GEE Poisson | Table 4; Results text | 1.11 (0.83 to 1.48) | centre of printed CI 1.108: consistent; includes 1 |
| Stood 1.5 m at consultation, for contrast | Table 4 | 35/54 (65%) → 29/32 (91%); 1.18 (0.92 to 1.51) | crude 1.40 (1.12 to 1.75); neither matches the abstract |
| Hypothetical "1.13 to 1.25" for handwashing | — | — | geometric centre 1.188 (≈ 1.19), but it implies log SE 0.026: 0.52 × the crude SE and 0.17 × the GEE robust SE |
| Handwashing counts by district | Supplement, Annex 1 | Bo 34/45 → 58/58; Kenema 40/45 → 72/73 | sum 74/90 → 130/131, matching Table 4 |
Three things follow. First, the abstract's handwashing interval is not a confidence interval for any estimate. Second, the abstract's distance result reproduces exactly a crude, unclustered analysis of the Table 4 counts, while the Methods and Table 4 describe a clustered GEE analysis whose interval for the same comparison includes 1. Third, the abstract's handwashing estimate (1.19) matches neither the crude ratio (1.21) nor the GEE estimate (1.27). Its pattern resembles the distance figure: both of the abstract's intervals exclude 1, and both of the corresponding GEE intervals include 1.
Figure
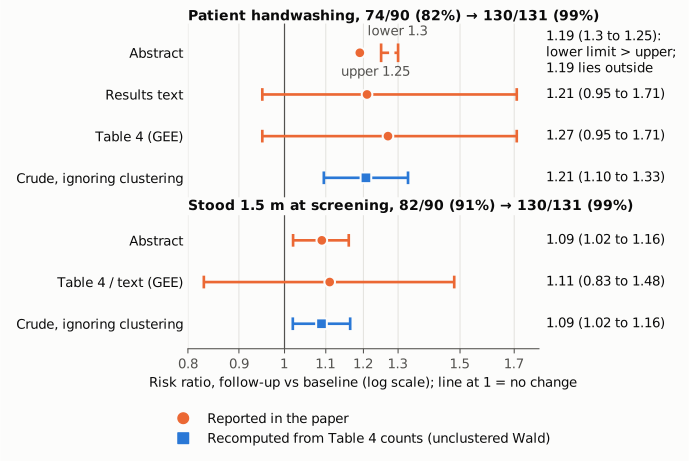
Risk ratios for patient handwashing (top) and for standing 1.5 m from the patient at screening (bottom), on a log scale with a reference line at 1 (no change). Orange circles are values printed in the paper; blue squares are crude, unclustered Wald estimates recomputed from the Table 4 counts. The abstract's handwashing "interval" is drawn at its printed limits, with the lower limit (1.3) to the right of the upper limit (1.25) and the point estimate (1.19) outside both. The abstract's distance interval coincides with the crude recomputation. The paper's GEE intervals for both behaviours, in Table 4 and in the Results text, cross 1.
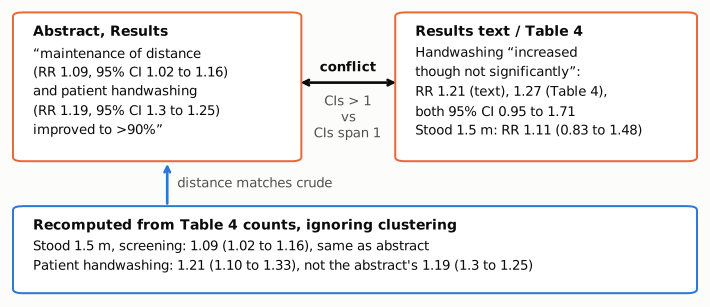
The abstract's two effect estimates (left) set against the Results text and Table 4 (right) and against the crude recomputation from the Table 4 counts (bottom). The abstract's intervals lie entirely above 1; the body's intervals for the same two behaviours include 1. The abstract's distance figure reproduces the unclustered calculation; its handwashing figure reproduces nothing in the paper.
Why it matters
These are the only two quantitative effect estimates in the abstract, and its sentence reads as a statistically significant improvement in both behaviours. The analysis described in the Methods (GEE with robust standard errors, significance at p<0.05) does not support that reading. Patient handwashing, RR 1.27 (0.95 to 1.71), and distance at screening, RR 1.11 (0.83 to 1.48), are both non-significant in Table 4, and the Results text says so for handwashing. A reader of the abstract alone, or a reviewer extracting effect sizes from it, would record two significant improvements and, for handwashing, an interval that cannot be used. Clustering matters here: the GEE robust standard errors implied by Table 4 are about three times (handwashing) and four times (distance) the unclustered ones, so the unclustered intervals are much too narrow for observations clustered within eight facilities.
The overstatement of significance is confined to the abstract. The Discussion describes the percentage improvements, which did occur (82% to 99% and 91% to 99%), and its next sentence states that "Significant improvements were not consistent across behaviours, partly due to several high baseline values (>80%)". That agrees with Table 4, where, of the handwashing items, only the prompted ones (screener asked patient to wash hands, RR 1.45, 1.16 to 1.80; patient washed hands on direction, RR 1.49, 1.19 to 1.86) are significant. The abstract carries no such qualification. Its conclusions are qualitative (favourable attitudes towards IPC, gaps in practice, the need for socio-behavioural improvement and a secure supply chain), and they do not depend on these two estimates.
Explanations considered
- Archiving or conversion error. Ruled out. The PMC XML, the Europe PMC record and the publisher-typeset PDF all print "RR 1.19, 95% CI 1.3 to 1.25". No minus signs, superscripts or decimal symbols are involved, and the Table 4 cells line up in both the XML and the PDF.
- A different row or population. The abstract says the behaviours "improved to >90%". For handwashing, only the combined row (82% → 99%) reaches 90%. The prompted rows reach 80%. For distance, both the screening row (91% → 99%) and the consultation row (65% → 91%) end above 90%, but only the screening row reproduces 1.09 (1.02 to 1.16). The consultation row gives 1.40 (1.12 to 1.75) crude and 1.18 (0.92 to 1.51) by GEE.
- A different model. Table 4's footnote explains that this row used a Poisson GEE because the binomial model did not converge. That model gives 1.27 (0.95 to 1.71), and the printed interval is centred on 1.275, so the table is internally consistent. The crude estimate is 1.21 (1.10 to 1.33). The abstract's 1.19 matches neither.
- Unadjusted figures in the abstract. This accounts exactly for the distance figure. It does not account for the handwashing figure: on the same crude basis handwashing would be 1.21 (1.10 to 1.33). Even if the abstract was meant to report crude estimates, those estimates ignore the clustering that the Methods say the analysis accounts for, and they disagree with Table 4 on significance.
- A typographical slip ("1.3" for "1.13"). An interval of 1.13 to 1.25 would be centred on 1.188 and would match 1.19, so a dropped digit would explain the impossible ordering. It would not explain where the estimate comes from. It is not the crude ratio or the GEE estimate, and such an interval would need a standard error about half the crude unclustered one and a sixth of the GEE one. Nor would it explain why the abstract implies significance when the Results text says the change "increased though not significantly".
- A one-sided interval or another stated convention. None is stated. The Methods give a significance level of p<0.05 for all tests, with GEE and an exchangeable working correlation.
- The Results text's "RR 1.21, 95% CI 0.95 to 1.71". Its point estimate is the crude ratio (1.207). Its interval is the Table 4 GEE interval, whose centre is 1.275. So the text pairs a crude point estimate with a model-based interval. This is a smaller inconsistency, but it does not affect the text's conclusion that the change was not significant, which agrees with Table 4.
Status
- Version of record. The DOI resolves to the publisher's page at gh.bmj.com (https://gh.bmj.com/lookup/doi/10.1136/bmjgh-2016-000103), which returned HTTP 403 to automated access. The version of record was read from a copy of the publisher-typeset PDF (12 pages, CC BY 4.0) on the RKI edoc repository and cross-checked against PMC and Europe PMC. All three carry the abstract sentence, the Results text and Table 4 exactly as quoted above.
- Supplement. The only supplement (bmjgh-2016-000103supp.pdf, "Annex 1. Proportions of correct IPC events before and after the workshop, by district") gives counts and percentages by district but no risk ratios or intervals. Its handwashing counts sum to Table 4's 74/90 and 130/131. It neither explains nor corrects the abstract's figures.
- Corrections. As of 2026-10-23 I found no correction, erratum, retraction or expression of concern. Crossref lists no update relations for the DOI, and PMC and Europe PMC list no notices.
- PubPeer. The PubPeer API and search page refused automated access (HTTP 403; human verification required). A web search for the title together with "pubpeer" found no PubPeer thread. Search engines do not reliably index PubPeer, so a manual check at pubpeer.com is still advisable.
- Sources. PMC5321376 (read with
src/show.py);src/known.py 10.1136/bmjgh-2016-000103(Crossref, PMC and Europe PMC notices); https://doi.org/10.1136/bmjgh-2016-000103; https://edoc.rki.de/bitstream/handle/176904/2475/27svLccxFCudc.pdf (typeset PDF); Europe PMC fullTextXML and supplementaryFiles for PMC5321376.
Suggested correction
The abstract's Results sentence should report the paper's primary, clustered analysis. Using Table 4 it would read, for example: "Maintenance of distance during screening (91% to 99%; RR 1.11, 95% CI 0.83 to 1.48) and patient handwashing (82% to 99%; RR 1.27, 95% CI 0.95 to 1.71) reached >90%, although neither change was statistically significant; HCW prompting of patient handwashing (RR 1.45, 95% CI 1.16 to 1.80) and handwashing on prompting (RR 1.49, 95% CI 1.19 to 1.86) increased significantly." If the authors intended to report crude estimates in the abstract, that should be stated, the handwashing figure should read 1.21 (1.10 to 1.33), and the abstract should note that the clustered analysis is not significant. Separately, the Results text's handwashing estimate should read RR 1.27 to match its interval and Table 4. The Discussion already notes that significant improvements were not consistent across behaviours and needs no change.