← Back to the plain-language case
Abstract transposes two of four unilateral and bilateral effusion mortality figures given correctly in Results
Eur Respir J (2015) · doi:10.1183/09031936.00217114 · PMC4857137
Summary
This cohort of 308 patients undergoing thoracentesis (247 unilateral, 61 bilateral) reports in its abstract that bilateral effusion, relative to unilateral, carried higher mortality, giving "17% versus 47%" with the 30-day hazard ratio and "36% versus 69%" with the 1-year hazard ratio. The Results instead give unilateral mortality as 17% (30 days) and 47% (1 year) and bilateral mortality as 36% and 69%, and only these figures reproduce the paper's reported totals of 65 and 158 deaths (43/247 + 22/61 and 116/247 + 42/61); no count out of 61 even rounds to 47%. The abstract, including the version of record indexed in PubMed, has therefore transposed 47% and 36%: it overstates bilateral 30-day mortality (47% instead of 36%), understates unilateral 1-year mortality (36% instead of 47%), and makes the absolute gap look 11 percentage points larger at both time points. The hazard ratios and the direction of the finding are unaffected, but this is the comparison the paper presents as its new contribution, and the incorrect 47% figure has since been cited.
What the paper reports
Abstract, Results (PMC author manuscript):
Patients with bilateral pleural effusion, relative to unilateral, were associated with higher risk of death at 30 days and 1 year (17% versus 47%; HR 2.58 CI [1.44–4.63] and 36% versus 69%; HR 2.32 CI [1.55–3.48])
Abstract, Results, as published in Eur Respir J 46(2):495–502 and indexed in PubMed (PMID 25837039):
Patients with bilateral, relative to unilateral, pleural effusion were associated with higher risk of death at 30 days and 1 year (17% versus 47% (hazard ratio (HR) 2.58, 95% CI 1.44-4.63) and 36% versus 69% (HR 2.32, 95% CI 1.55-3.48), respectively).
Results, first paragraph:
A total of 247 unilateral and 61 bilateral thoracenteses were performed. Overall mortality across all groups was 21% (65 of 308 patients) at 30-days and 51% (158 of 308 patients) at one year
Results, second paragraph:
As calculated from Figure 1, thirty-day and one-year mortality of patients with unilateral effusion was 17% and 47%, compared with 36% and 69% in patients with bilateral effusion.
Relative to patients with unilateral effusion, unadjusted mortality of patients with bilateral effusion was higher at thirty-days (p=0.0003) and at one-year (p=0.0001).
Results, fifth paragraph (Table 3, row "Bilateral", reads the same: 2.58 (1.44, 4.63), 0.002 | 2.32 (1.55, 3.48), <0.001):
was significantly associated with higher 30-day and 1-year mortality (HR 2.58 [1.44–4.63] p=0.002 and HR 2.32 [1.55–3.48] p<0.001, respectively)
Methods, Statistical Analysis, on what the percentages are:
Unadjusted 30-day and 1-year mortalities were calculated and diagrammed for subgroups according to the following hierarchy: laterality (bilateral versus unilateral) and malignancy (yes versus no).
Discussion, on the weight the paper gives the comparison:
The study is novel in evaluating mortality associated with bilateral effusions.
It is also the first study to report the association between bilateral pleural effusion and mortality.
Abstract, Conclusions:
Bilateral pleural effusion is distinctly associated with high mortality.
What the paper's own numbers show
Method. The group sizes (247 and 61) and the overall death counts (65 and 158 of 308) come from the Results. For each printed percentage I listed every integer number of deaths k for which k/n rounds to that percentage. I then asked which pairing of unilateral and bilateral percentages can reproduce the reported overall totals: the pairing in the Results (unilateral 17%/47%, bilateral 36%/69%), or the pairing in the abstract, where each "x% versus y%" is tied to one time point by the hazard ratio that follows it (30 days: 17% vs 47%; 1 year: 36% vs 69%). For each correct split I recomputed the risk difference and crude risk ratio. Every number below is printed by recompute.py.txt.
| Quantity | Location | Reported | Recomputed from the paper's numbers |
|---|---|---|---|
| Group sizes | Abstract; Results ¶1 | 247 unilateral, 61 bilateral | 247 + 61 = 308 |
| Overall deaths, 30 days | Results ¶1 | 65 of 308 (21%) | 21.1% |
| Overall deaths, 1 year | Results ¶1 | 158 of 308 (51%) | 51.3% |
| Unilateral, 30 days | Results ¶2; abstract | 17% | 43/247 = 17.4% (41–43 deaths round to 17%) |
| Bilateral, 30 days | Results ¶2 | 36% | 22/61 = 36.1% (22 is the only count giving 36%) |
| Bilateral, 30 days | Abstract (30-day pair, with HR 2.58) | 47% | not attainable: 28/61 = 45.9%, 29/61 = 47.5%; the value is the unilateral 1-year figure |
| Unilateral, 1 year | Results ¶2 | 47% | 116/247 = 47.0% |
| Unilateral, 1 year | Abstract (1-year pair, with HR 2.32) | 36% | would mean 88–90 deaths; the value is the bilateral 30-day figure |
| Bilateral, 1 year | Results ¶2; abstract | 69% | 42/61 = 68.9% |
| Total 30-day deaths implied, Results pairing | derived | 65 | 0.17 × 247 + 0.36 × 61 = 64.0 (63–65 with rounding); the only exact split is 43 + 22 = 65 |
| Total 30-day deaths implied, abstract pairing | derived | 65 | 0.17 × 247 + 0.47 × 61 = 70.7 (about 69–72); no integer split gives 65 |
| Total 1-year deaths implied, Results pairing | derived | 158 | 0.47 × 247 + 0.69 × 61 = 158.2 (157–159); the only exact split is 116 + 42 = 158 |
| Total 1-year deaths implied, abstract pairing | derived | 158 | 0.36 × 247 + 0.69 × 61 = 131.0 (130–132); no integer split gives 158 |
| Bilateral minus unilateral, 30 days | Abstract vs Results | 47 − 17 = 30 pp | 36.1 − 17.4 = 18.7 pp (19 pp from the rounded Results figures); crude RR 2.07 (2.76 as printed in the abstract) |
| Bilateral minus unilateral, 1 year | Abstract vs Results | 69 − 36 = 33 pp | 68.9 − 47.0 = 21.9 pp (22 pp from the rounded Results figures); crude RR 1.47 (1.92 as printed in the abstract) |
| Adjusted HR, bilateral vs unilateral | Abstract; Results ¶5; Table 3 | 2.58 (1.44–4.63) at 30 days; 2.32 (1.55–3.48) at 1 year | identical in all three places; not affected |
The four numbers in the abstract are the right four numbers, but 47% and 36% have swapped places. The Results figures, the death counts they imply and the reported overall totals all agree with one another. The abstract's pairing agrees with none of them.
One side observation does not form part of the finding. Pearson chi-square tests on the recomputed counts give unadjusted p = 0.0014 (30 days) and 0.0022 (1 year), and Fisher exact tests give 0.0026 at both time points. The Results report p = 0.0003 and 0.0001. The paper does not name the test, and a log-rank test on time to death could legitimately give different values, so I leave this unresolved.
Figure
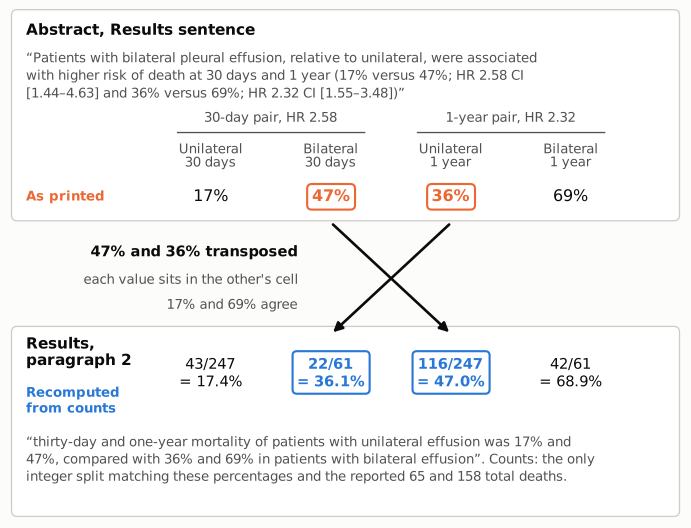
Figure 1. The upper panel quotes the abstract's sentence and lays out its four percentages as the sentence assigns them: each "x% versus y%" pair is followed by its time-point hazard ratio (HR 2.58 is the 30-day HR and 2.32 the 1-year HR in Table 3), and in each pair bilateral is the higher value. The values as printed are shown in orange. The lower panel quotes the Results and shows, in blue, the death counts recomputed from the paper's own numbers: the only integer split that matches both the Results percentages and the reported totals of 65 and 158 deaths. The unilateral 30-day (17%) and bilateral 1-year (69%) cells agree. The bilateral 30-day and unilateral 1-year cells hold each other's values: the abstract's 47% is the unilateral 1-year mortality (116/247), and its 36% is the bilateral 30-day mortality (22/61).
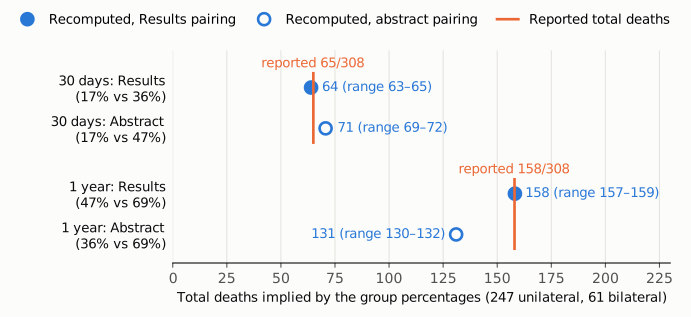
Figure 2. Total deaths implied by applying each pairing's percentages to the 247 unilateral and 61 bilateral patients, on one axis of deaths that starts at zero. Filled blue circles use the Results pairing and open blue circles the abstract's pairing. The ranges in the labels allow for rounding of the printed percentages. Orange lines mark the reported totals (65/308 at 30 days, 158/308 at 1 year). The Results pairing reproduces both totals. The abstract's pairing implies about 71 deaths at 30 days and 131 at 1 year, and neither range contains the reported total.
Why it matters
- The comparison is the paper's stated novel contribution. The Discussion calls the bilateral analysis "novel" and "the first study to report" this association, and the abstract's last Results sentence is where most readers will take the absolute risks from.
- The absolute risks in the abstract are wrong in a way a reader cannot detect from the abstract alone. A bilateral 30-day mortality of 47% (the true value is 36%) and a unilateral 1-year mortality of 36% (the true value is 47%) both look plausible. Read as printed, the excess mortality with bilateral effusion is 30 pp instead of about 19 pp at 30 days, and 33 pp instead of about 22 pp at 1 year. The implied crude risk ratios are 2.76 instead of 2.07, and 1.92 instead of 1.47. The abstract also understates the 1-year mortality of the larger, unilateral group by 11 pp.
- The error has propagated. A 2022 article in Frontiers in Medicine (doi:10.3389/fmed.2022.828783) cites this study in its Background as reporting bilateral-effusion mortality of "47% at 30 days, 69% at 1 year". Its Discussion later gives the correct "17% for unilateral vs. 36% for bilateral" at 1 month.
- What is not affected. The direction of the association, the adjusted hazard ratios (2.58 and 2.32, consistent across the abstract, Results and Table 3), the reported significance, the etiology-specific mortality figures, the main-text Results, and the qualitative conclusion that bilateral effusion is associated with higher mortality all stand. The error lies in two absolute mortality figures in the abstract.
Explanations considered
- The pairs mean unilateral (30 days vs 1 year) and bilateral (30 days vs 1 year). Under this reading "17% versus 47%" would be the unilateral group over time and "36% versus 69%" the bilateral group, which would match the Results. This does not account for the sentence as printed. The sentence compares bilateral "relative to unilateral" and attaches HR 2.58 (the 30-day HR in Table 3) to the first pair and HR 2.32 (the 1-year HR) to the second. The version of record adds "respectively", which ties the first pair to 30 days and the second to 1 year. A reader therefore takes 17% vs 47% as the 30-day comparison and 36% vs 69% as the 1-year comparison. This reading may explain how the slip arose, but it does not make the printed text correct.
- The abstract quotes adjusted rather than crude mortality. This does not account for the numbers. The Methods describe the subgroup percentages as unadjusted, the Results say they were "calculated from Figure 1", the abstract presents no separate adjusted percentages, and the abstract uses exactly the same four values as the Results.
- A different subgroup, population or time point. This does not account for the numbers. The abstract and the Results use the same 247/61 split and the same two time points, and name no subgroup.
- Rounding. This does not account for the numbers. No number of deaths out of 61 rounds to 47% (28/61 = 45.9%, 29/61 = 47.5%), and neither of the abstract's pairings can reproduce the reported totals of 65 and 158 deaths under any rounding (Figure 2).
- A conversion artifact in the PMC author manuscript. This is ruled out. The publisher's copy-edited abstract in PubMed has the same pairing.
- The error was corrected later. No correction was found (see Status).
Status
- Version of record. The publisher's pages (doi.org redirects to publications.ersnet.org; erj.ersjournals.com/content/46/2/495 and its PDF) returned HTTP 403 to automated access, so I could not read the publisher's full-text Results directly. The final published abstract was checked through the PubMed record (PMID 25837039, Eur Respir J 2015;46(2):495–502, retrieved with NCBI E-utilities on 2026-10-23). It is the publisher's copy-edited text, and it contains the same pairing with "respectively" added. The PMC record (PMC4857137) is the NIH author manuscript. Every quote from it above was confirmed verbatim against the PMC-archived text.
- Supplements. PMC lists no supplementary material, and Europe PMC reports no open-access supplementary files. Supplementary material would not change the finding: the Results text and the overall totals already fix the correct values.
- Corrections and comments. As of 2026-10-23, I found no correction, erratum, retraction or expression of concern. Crossref lists no update relations for the DOI. PMC and Europe PMC list no correction notices (the Europe PMC commentCorrectionList is empty). The PubMed record (revised 2022-03-17) has no CommentsCorrections entry. Web searches for an erratum or a PubPeer thread found none. The PubPeer API returned HTTP 403 to automated access, so PubPeer could not be queried directly.
- Sources. PMC4857137 (author manuscript, as archived); PubMed 25837039 (E-utilities efetch); Crossref and Europe PMC REST records for doi:10.1183/09031936.00217114; Frontiers in Medicine 2022, doi:10.3389/fmed.2022.828783 (the citing article).
Suggested correction
In the Results sentence of the abstract, change
(17% versus 47%; HR 2.58 CI [1.44–4.63] and 36% versus 69%; HR 2.32 CI [1.55–3.48])
to
(36% versus 17%; HR 2.58 CI [1.44–4.63] and 69% versus 47%; HR 2.32 CI [1.55–3.48])
or, keeping the original order, "(17% versus 36% … and 47% versus 69% …)", stated explicitly as unilateral versus bilateral. The version of record needs the same change, with "respectively" kept. No change is needed to the main text, Table 3 or the conclusions. Because the incorrect figure has already been cited, a published correction notice linked to the article would be more useful than a silent update.