← Back to the plain-language case
Age-by-haplogroup interaction p-value is 0.002 in abstract and text but 0.02 by Table 3's own statistic
Ann Neurol (2014) · doi:10.1002/ana.24116 · PMC4112718
Summary
The abstract and the Results give the interaction between mtDNA haplogroup and age on 6-month Glasgow Outcome Score as p = 0.002, and the Results call it "a strong interaction". Table 3 reports the same model term with chi-square 13.439 on 5 df, F 2.688 and p = 0.02. The upper-tail chi-square probability of 13.439 on 5 df is 0.0196, which matches the table and is 9.8 times the value in the text; a p of 0.002 on 5 df would need a chi-square of about 18.9. Every other p-value in Table 3 that can be checked agrees with its statistic, so the text value is the outlier. The interaction stays nominally significant at the paper's 0.05 threshold, but the evidence for it is roughly ten times weaker than the abstract states.
What the paper reports
All quotations were checked verbatim against the article as archived in PubMed Central.
Abstract, Results:
There was also a significant interaction between mitochondrial genome and age (p = 0.002), with a strong protective effect of both haplogroups T (p = 0.015) and K (p = 0.017) with advancing age.
Results, section "Interaction between mtDNA and Aging":
The inclusion of the interaction term "age by haplogroup" in the model revealed a strong interaction between age and mtDNA haplogroups (p = 0.002). Possessing either haplogroup K or T significantly mitigated the negative effect of aging on outcome (p = 0.017 and p = 0.015, respectively), as shown by Figure 1A.
Table 3, "Model Effects" (columns Parameter | Category | Chi-Square | df | F | OR (95% CI) | p):
Interaction between mtDNA haplogroup and age | | 13.439 | 5 | 2.688 | | 0.02
Table 3, neighbouring rows for the other two mtDNA tests:
mtDNA haplogroup, overall effect | | 15.601 | 5 | 3.120 | | 0.008
Interaction between mtDNA haplogroup and APOE ε4 | | 21.35 | 5 | 4.27 | | 0.001
Patients and Methods, Statistical Analysis:
We also analyzed the interaction between mtDNA haplogroups and age, and between mtDNA haplogroup and APOE by fitting the interaction terms "age by mtDNA haplogroup" and "APOE genotype by mtDNA haplogroup" into the model.
A p value of <0.05 was considered significant.
What the paper's own numbers show
Method. For every row of Table 3, I took the printed chi-square and df and computed the upper-tail probability of the chi-square distribution (scipy.stats.chi2.sf). As a cross-check I also tested the printed F on (df, 1000) degrees of freedom; the denominator df is not reported, but for a cohort of 1,094 any plausible value from 500 upward changes p only in the fourth decimal. I compared each result with the printed p and the rounding range its printed decimals imply. Every number below is printed by recompute.py.txt.
| Quantity | Location | Reported | Recomputed from the paper's own numbers |
|---|---|---|---|
| Haplogroup × age interaction, p | Abstract; Results, "Interaction between mtDNA and Aging" | 0.002 | 0.0196 (χ² 13.439, df 5); 9.8 times the reported value |
| Haplogroup × age interaction, p | Table 3 | 0.02 (χ² 13.439, df 5, F 2.688) | 0.0196 from χ²; 0.0201 from F on (5, 1000) df; 0.0201 to 0.0207 for denominator df 1094 down to 500 |
| F for the age interaction | Table 3 | 2.688 | 13.439 / 5 = 2.6878 |
| χ² needed for p = 0.002 on 5 df | derived | — | 18.907 (18.386 for p = 0.0025, the upper rounding edge of 0.002) |
| F needed for p = 0.002 on (5, 1000) df | derived | — | 3.812 (printed F is 2.688) |
| p for χ² 13.439 at other df | derived | — | df 2: 0.0012; df 3: 0.0038; df 4: 0.0093; df 6: 0.0366. No integer df gives 0.002 |
| Haplogroup, overall effect, p | Table 3; Abstract | 0.008 | 0.0081 (χ² 15.601, df 5) |
| Haplogroup × APOE interaction, p | Table 3; Abstract; Results | 0.001 | 0.0007 (χ² 21.35, df 5) |
| Traumatic SAH, p | Table 3 | 0.001 | 0.0014 (χ² 10.149, df 1) |
| Pupillary reactivity, p | Table 3 | 0.011 | 0.0105 (χ² 9.112, df 2) |
| Hypotension, p | Table 3 | 0.046 | 0.0454 (χ² 4.002, df 1) |
| Hypoxia, p | Table 3 | 0.331 | 0.3310 (χ² 0.945, df 1) |
| ApoE genotype, p | Table 3 | 0.476 | 0.4764 (χ² 0.507, df 1) |
| Age, GCS motor, CT Marshall, p | Table 3 | 0.000 | < 10-5 for each |
Table 3 is internally consistent: its printed F equals chi-square divided by df, and its printed p agrees with the chi-square on that row (the hypotension row differs by one unit in the last digit: 0.0454 would round to 0.045, not 0.046). The only disagreement is between Table 3 and the text. The text's 0.002 differs from the table's 0.02 by exactly one decimal place, and the table's value is the one that follows from the reported statistic.
Figure
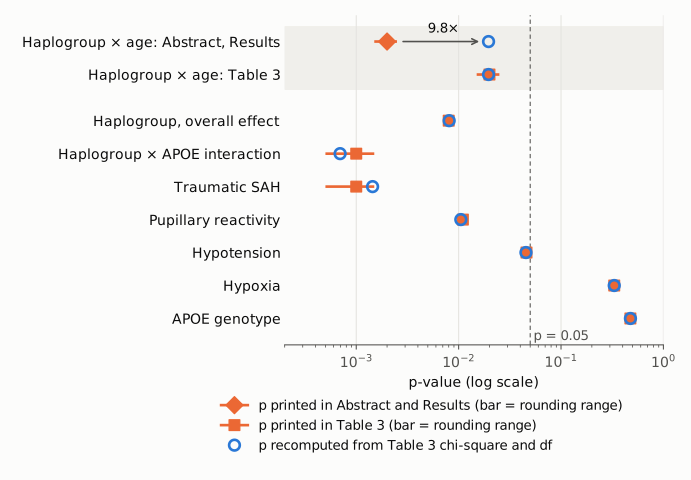
Figure 1. p-values on a log scale for each Table 3 term with a printed non-zero p. Orange markers are values printed in the paper, with a horizontal bar spanning the range that rounds to the printed digits; open blue circles are the upper-tail chi-square probabilities recomputed from the chi-square and df printed in Table 3. The shaded top two rows show the age-by-haplogroup interaction twice: once with the value given in the Abstract and Results (diamond, 0.002) and once with the value in Table 3 (square, 0.02). The recomputed value, 0.0196, lies within the Table 3 rounding range and 9.8 times above the text value. The dashed line marks the paper's significance threshold, p = 0.05. The log scale is used because the discrepancy is a ratio.
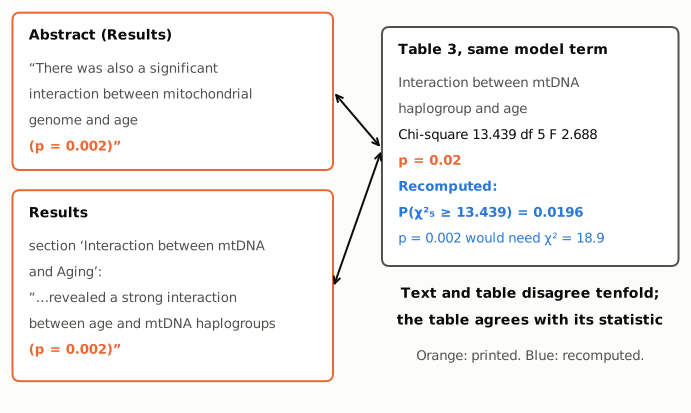
Figure 2. The two passages that state p = 0.002 (left) and the Table 3 row for the same interaction term (right). Orange text is printed in the paper; blue text is recomputed from Table 3. The Methods describe a single proportional-odds model into which the interaction terms were fitted, and Table 3 is that model's table of effects, so the two locations describe the same test.
Why it matters
- The abstract overstates the strength of a reported result about tenfold. The interaction with age is one of four quantitative findings in the abstract's Results, and the Results text describes it as "a strong interaction". The paper's own statistic gives p = 0.0196. That is still below the stated threshold of 0.05, so the direction and nominal significance are unchanged, but it is a much weaker result than p = 0.002.
- The corrected value is more fragile to multiplicity. The paper tests three omnibus mtDNA terms in the same model (overall effect, interaction with age, interaction with APOE) and reports them without adjustment. As an illustration only, a Bonferroni factor of 3 gives 0.0588 for the corrected age interaction, above 0.05, whereas it would give 0.006 for the stated 0.002. The overall effect (0.0081 × 3 = 0.024) and the APOE interaction (0.0007 × 3 = 0.002) would remain below 0.05.
- Downstream claims lean on this test. The haplogroup-specific age effects for T (p = 0.015) and K (p = 0.017) are follow-up tests of this omnibus interaction. The Discussion states "We found a strong mitigating effect of haplogroups K and T on the effect of aging on TBI outcome", builds a mechanistic interpretation on it, and proposes that "mtDNA genomics should be included in future outcome prediction models". The abstract's Interpretation ("an interplay between mitochondrial DNA, pathophysiology of TBI, and aging") also draws on it. These claims rest on an omnibus interaction with p of about 0.02, not 0.002.
- What is not affected. The overall mtDNA association (p = 0.008), the haplogroup × APOE interaction (p = 0.001) and the other covariate effects all agree with their printed statistics. The per-haplogroup p-values for T and K (0.015, 0.017) cannot be checked from the paper, since their statistics are not reported.
Explanations considered
- A different model for the text value. Does not account for it. The Statistical Analysis section describes one SPSS proportional-odds model with the two interaction terms fitted "into the model", and Table 3 is that model's table of effects. Neither the text nor the table footer mentions a second model, and the Results sentence refers to "the inclusion of the interaction term 'age by haplogroup' in the model".
- A different test statistic (Wald chi-square vs F). Does not account for it. Table 3 gives both, and they agree: F = 13.439 / 5 = 2.688, and the two give p = 0.0196 and about 0.020. Both match the table's 0.02.
- A degrees-of-freedom slip. Does not account for it. No integer df turns 13.439 into 0.002 (df 2 gives 0.0012, df 3 gives 0.0038). The table's df of 5 matches a six-category haplogroup term (H, J, T, U, K, other), as for the other two mtDNA rows.
- One-sided testing or adjustment. Does not account for it. Neither is mentioned. Chi-square and F tests already use the upper tail only; halving 0.0196 would give 0.0098, not 0.002, and any multiplicity adjustment would raise p.
- A per-haplogroup value. Does not account for it. The text gives the T and K slope p-values separately (0.015 and 0.017) in the same sentences, so 0.002 is presented as the overall interaction p.
- Confusion with the APOE interaction or the K-in-ε4 odds ratio. Not supported. The APOE interaction is 0.001 in the abstract, the Results and Table 3, and recomputes to 0.0007. The Results do give p = 0.002 for the odds ratio of haplogroup K among APOE ε4 carriers, but that is a separate, labelled estimate in a separate section.
- A conversion or typesetting artifact. Ruled out. The publisher-typeset PDF of the version of record (see Status), the PMC HTML and the Europe PMC full-text XML all carry p = 0.002 in the abstract and Results and 0.02 in Table 3.
- Most likely explanation. The table, its F column and its chi-square are mutually consistent, and the other omnibus p-values given in the text (0.008 and 0.001) match the table. A transcription slip from 0.02 to 0.002 in the text is consistent with all the numbers, but the paper does not let one confirm this; only the original model output can.
- Side observations, not part of the main finding. In Table 3 the hypotension F is printed as 4.4002 against a chi-square of 4.002 on 1 df, where every other row has F = chi-square / df; this looks like a typographical slip and does not change the p-value. The CT Marshall F (11.856) differs slightly from 59.238 / 5 = 11.848. Neither affects any conclusion.
Status
- Version of record. The Wiley landing page and PDF (reached through doi.org) returned HTTP 403 to automated requests. I checked the publisher-typeset PDF deposited in the University of Cambridge institutional repository (handle 1810/291579), which has the Ann Neurol 2014;75:186–195 layout. Its abstract, Results and Table 3 carry the same values as PMC: 0.002 in the abstract and Results, and 13.439, 5, 2.688, 0.02 in the Table 3 row. The PMC HTML page and the Europe PMC full-text XML agree. Every quotation here was checked verbatim against the PMC-archived text with
src/show.py. - Supplements. The PMC/Europe PMC record declares no supplementary material, and neither the PMC page nor the typeset PDF lists supporting information. No patient-level data or model output is available to settle which value the software produced.
- Corrections and comments. As of 2026-10-24 I found no correction, erratum, retraction or expression of concern.
src/known.pyreturns no Crossref update relations, PMC notices or Europe PMC notices. The Crossref record has no update-to or updated-by fields, and the PubMed record (PMID 24523223) has no CommentsCorrections entries. A web search for the title with "erratum", "correction" or "PubPeer" returned only the article and repository copies. The PubPeer API returned no record (HTTP 404) for the DOI. Two checks were inconclusive: a Europe PMC DOI search returned HTTP 503 on repeated tries, and the publisher's page could not be checked directly for notices. - Sources. PMC article PMC4112718; Europe PMC full-text XML; typeset PDF in the University of Cambridge repository (handle 1810/291579); Crossref; PubMed; Europe PMC; PubPeer; https://doi.org/10.1002/ana.24116.
Suggested correction
In the abstract, replace
There was also a significant interaction between mitochondrial genome and age (p = 0.002)
with
There was also a significant interaction between mitochondrial genome and age (p = 0.02)
and in the Results, section "Interaction between mtDNA and Aging", replace "(p = 0.002)" with "(p = 0.02)", subject to confirmation against the original model output. Since the corrected value is close to the significance threshold, the authors may also wish to reconsider the description "a strong interaction" and to say whether the three mtDNA omnibus tests were adjusted for multiplicity. In Table 3 the hypotension F value should probably read 4.002 rather than 4.4002.