← Back to the plain-language case
Abstract reports a 31% fall in endotoxin activity on the prudent diet; Results report 38%
Gastroenterology (2012) · doi:10.1053/j.gastro.2012.01.034 · PMC3978718
Summary
This short crossover study fed 8 healthy inpatients a Western-style diet and a prudent-style diet for 1 month each and measured plasma endotoxin activity before and after each diet. The abstract says the prudent-style diet reduced endotoxin activity by 31%. The Results paragraph that cites Figure 1 says the decrease was 38%. Both passages describe the same subjects, assay and before/after comparison, and both give the same +71% for the Western-style diet. Rounding cannot produce a 7-point gap. The paper prints no group means for endotoxin activity, only the individual-subject plots in Figure 1. Reading those plots by eye gives a 37.5% fall in the group mean, which supports the Results figure. The abstract's 31% matches no single summary method that also gives +71% for the Western diet. The abstract is the number most likely to be quoted, so the size of the prudent-diet effect is now ambiguous in the literature. The direction of the effect, the Western-diet result and the paper's conclusions are unaffected.
What the paper reports
Abstract:
Placing 8 healthy subjects on a Western-style diet for 1 month induced a 71% increase in plasma levels of endotoxin activity (endotoxemia), whereas a prudent-style diet reduced levels by 31%.
Main text, Results paragraph (the paragraph that cites Figure 1 and Table 1):
Our study shows that 4 weeks of feeding a Western-style diet induced highly significant increases (by 71%) in plasma endotoxin activity levels, in contrast to a major decrease (by 38%) after the prudent-style diet (Figure 1) (P < .001).
Main text, same paragraph:
Baseline endotoxin activity levels were about identical
Main text, study description. This shows that both passages concern one group of subjects and one design:
Briefly, 8 healthy subjects were fed a Western-style and a “prudent-style” diet for 1 month as inpatients hospitalized in a metabolic ward in a crossover study separated by a 1-month washout period.
Figure 1 legend:
Data from 8 individual subjects shown as endotoxin activity units for the Western-style diet (WD) and the prudent-style diet (PD). Paired t tests were used to compare effects of the diets on endotoxin activity levels. The Mann–Whitney sum test was used to compare effects of the 2 diets on endotoxin activity levels.
In the Figure 1 image, panels A (Western diet, before vs after) and B (prudent diet, before vs after) are labelled "P≤.05". Panel D, which compares the two diets after the intervention, is labelled "P≤.001". Neither the text nor the figure gives a group mean, SD or percentage for endotoxin activity. Table 1 gives cytokine concentrations only, as before and after means with a "Change (%)" column.
What the paper's own numbers show
Method. The paper reports the endotoxin results only as two percentages and as individual-subject lines in Figure 1, panels A and B (8 subjects each). I read each subject's before and after values off the enlarged figure image by eye. Each reading is uncertain by about ±0.005 activity units. These readings are approximations, not the authors' data. From them I computed the percentage change in four standard ways: - the change in the group mean (mean after / mean before − 1); - the mean of each subject's own percentage change; - the geometric mean of the after/before ratios; - the change in the median.
To carry the reading error through, I added independent uniform ±0.005 noise to every point, repeated this 20,000 times and took the 2.5–97.5 percentile band of each statistic. As a check on which method the authors used elsewhere, I recomputed Table 1's cytokine percentages from its rounded means. All calculations are in recompute.py.txt.
| Quantity | Location | Reported | Recomputed |
|---|---|---|---|
| Prudent diet, change in endotoxin activity | Abstract | −31% | — (same quantity as the next row) |
| Prudent diet, change in endotoxin activity | Results paragraph citing Fig. 1 | −38% | — |
| Gap between the two printed values | Abstract vs Results | — | 7 percentage points (23% of the abstract value); post/baseline ratio 0.69 vs 0.62 |
| Western diet, change in endotoxin activity | Abstract and Results | +71% (both) | — |
| Prudent diet, group mean before → after | Fig. 1B (read by eye) | not reported | 0.115 → 0.072 units |
| Western diet, group mean before → after | Fig. 1A (read by eye) | not reported | 0.120 → 0.207 units |
| Prudent diet, change of group means | Fig. 1B | −31% / −38% | −37.5% (band −39.5 to −35.4) |
| Western diet, change of group means | Fig. 1A | +71% | +72.2% (band +69.0 to +75.5) |
| Prudent diet, mean of per-subject % changes | Fig. 1B | — | −33.3% (band −35.9 to −30.4) |
| Western diet, mean of per-subject % changes | Fig. 1A | — | +80.2% (band +75.6 to +85.3) |
| Prudent / Western, geometric mean ratio | Fig. 1A–B | — | −35.7% (−38.4 to −33.1) / +71.3% (+66.9 to +75.9) |
| Prudent / Western, change of medians | Fig. 1A–B | — | −28.7% (−33.5 to −24.1) / +78.3% (+71.8 to +85.5) |
| Within-diet paired t test, PD / WD | Results text; Fig. 1A–B labels | "P < .001" (text); "P≤.05" (figure) | p ≈ 0.020 / 0.017 (from figure readings) |
| Table 1, PD cytokines: TNF-α, MCP-1, IL-6, IL-8 | Table 1 | −17, −9, −11, −28% | −16.0, −8.7, −12.5, −26.3% (change of rounded means) |
| Table 1, WD cytokines: TNF-α, MCP-1, IL-6, IL-8 | Table 1 | −1, −9, −2, −13% | 0.0, −9.1, 0.0, −11.8% (change of rounded means) |
Three findings stand out: - The change in the group mean, read off Figure 1, reproduces both the Results' −38% and the shared +71%. - The geometric mean ratio also gives values close to −38% and +71%. - The only methods whose bands reach −31% are the mean of per-subject changes and the change of medians. Both give +78% to +80% for the Western diet, not the +71% printed beside the 31% in the abstract.
Table 1's printed percentages agree, within the rounding of its means, with the change-of-means method. This fits the 38% value, although rounded means cannot rule out other methods.
Figure
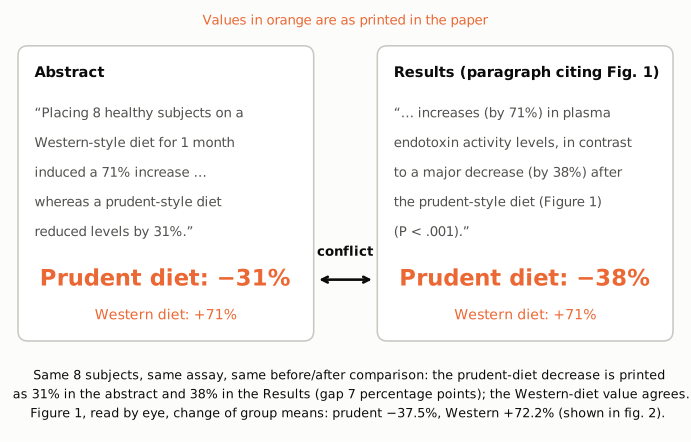
The two passages that report the prudent-diet result, as printed in the archived article. In orange are the paper's values: the abstract gives a 31% decrease and the Results paragraph citing Figure 1 gives a 38% decrease. Both concern the same 8 subjects, the same neutrophil-priming assay and the same before/after comparison, and both pair the value with an identical +71% for the Western-style diet. The footer gives the change of group means computed in recompute.py.txt from Figure 1 values read by eye.
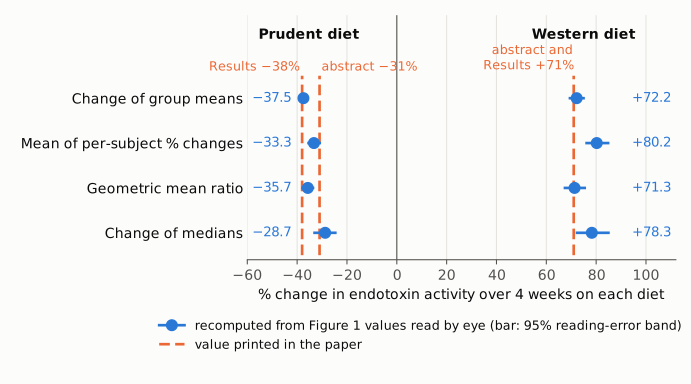
Percentage change in endotoxin activity recomputed from the individual values in Figure 1, read by eye (blue dots), under four summary methods. The bars show the 2.5–97.5 percentile range when each reading is perturbed by ±0.005 units. The dashed orange lines are the printed values: −31% (abstract), −38% (Results) and +71% (both). The left cluster is the prudent diet and the right cluster the Western diet, on one shared axis. The change of group means and the geometric mean ratio match −38% and +71% together. No method matches −31% and +71% together.
Why it matters
The abstract is where readers, reviews and meta-analyses usually take effect sizes from. Here it gives a prudent-diet reduction (31%, ratio 0.69) that differs from the body (38%, ratio 0.62) by 7 percentage points, or about 23% of the abstract value. A reader who compares the two diets gets a different contrast depending on the source: a post-diet ratio of 1.71/0.69 ≈ 2.48 between diets if the abstract is right, against 1.71/0.62 ≈ 2.76 if the body is right. Because the paper prints no group means or SDs for endotoxin activity, a reader cannot tell from the article which value is correct. Anyone sizing a follow-up study or pooling this result has to choose between two figures the paper gives for the same quantity.
The error is limited in scope: - The Western-diet +71%, the result named in the title, is the same in both places. - The prudent diet lowers endotoxin activity in both statements. - The cytokine results in Table 1 and the paper's qualitative interpretation do not depend on which value is correct.
A smaller, related point concerns the P value. The Results sentence attaches "P < .001" to the within-diet changes. The Figure 1 panels for those changes (A and B) are labelled "P≤.05", and the figure readings give paired-t p-values of about 0.02. The "P≤.001" label appears only on panel D, the between-diet comparison after the intervention. The Results sentence may be citing the panel D value. As written, though, it reads as applying to the within-diet changes.
Explanations considered
- Different populations, time points, assays or units. Ruled out. The paper describes one cohort of 8 subjects, one crossover with 4 weeks on each diet, and one assay, with endotoxin activity measured before and after each diet. Both passages give the same +71% for the Western diet, which would be unlikely if they described different analyses.
- Rounding. Ruled out. A value that prints as 31% must lie between 30.5% and 31.5%, and one that prints as 38% must lie between 37.5% and 38.5%. The two ranges do not overlap.
- Different summary methods (change of means, mean of individual changes, geometric mean, medians). These do not reconcile the values. Under the readings of Figure 1, a method that gives about 31% for the prudent diet gives about 78–80% for the Western diet. A method that gives about 71% for the Western diet gives about 36–38% for the prudent diet. No single method produces the abstract's pair (−31%, +71%). It remains possible that the abstract used one method for the prudent diet and another for the Western diet, but the paper does not say so.
- Decrease expressed relative to the post-diet level, or as a ratio. This does not fit. Taking the change of means relative to the post-diet level gives (0.115 − 0.072)/0.072 ≈ 60%, not 31%. A post/baseline ratio of 0.69 is what a 31% decrease means, which is the abstract's claim, not a different quantity.
- Reading error in the figure. This affects only which of the two printed values the figure supports, not the existence of the inconsistency. The two printed values contradict each other whatever the figure shows. The reading-error bands (about ±2 points) are much narrower than the 7-point gap.
- Text conversion artifact in the archived copy. Unlikely. Both values appear as plain text with a % sign, not in tables or superscripts. Both sentences describe the change in words ("reduced", "decrease"), so a dropped sign would not explain the gap. The abstract's 31% also appears in the PubMed record, which derives from the publisher.
- Correction already published. None found (see Status).
Status
As of 2026-10-23:
- Version of record. I could not open the typeset publisher full text. ScienceDirect (pii S0016508512001588) and gastrojournal.org returned HTTP 403 or a bot challenge to automated access. The abstract's "reduced levels by 31%" is confirmed in the PubMed record (PMID 22326433), which derives from the publisher's abstract. The Results sentence with "by 38%" was checked in the PubMed Central copy, which is the NIH author manuscript (NIHMS561466, PMC3978718), using both the archived JATS XML and the rendered PMC page. I could not confirm whether the typeset Results text also reads 38%.
- Supplement. The only file online is one publisher page, NIHMS561466-supplement-supplement_1.pdf. It holds Supplementary Table 1 (diet composition) and Supplementary Table 2 (end-of-diet glucose, insulin and lipids). It contains no endotoxin values, so it cannot settle 31% vs 38%. The "Supplementary Patients and Methods" text cited in the article was not among the files available to me.
- Corrections and retractions. None in Crossref update metadata, PubMed Central notices or Europe PMC notices.
- PubPeer. The PubPeer search page and API require human verification and could not be queried automatically. A web search found no PubPeer thread for this article. I cannot rule out a thread that is not indexed.
- Sources. The PMC author manuscript PMC3978718 (text, Table 1, Figure 1 image nihms561466f1.jpg); PubMed 22326433; Crossref record for doi:10.1053/j.gastro.2012.01.034. All numbers are recomputed in
recompute.py.txt.
Suggested correction
The authors could state which value is correct for the change in plasma endotoxin activity after the prudent-style diet. They could also give the group mean (SD) endotoxin activity before and after each diet, and say how the percentage change was calculated (for example, change of group means or mean of per-subject changes). If the Results value is correct, the abstract would read: "…whereas a prudent-style diet reduced levels by 38%." If the abstract value is correct, the Results sentence would need the same correction. The authors could also say which comparison the "P < .001" in the Results sentence refers to, since Figure 1 labels the within-diet changes "P≤.05" and only the between-diet comparison after the intervention "P≤.001".