← Back to the plain-language case
Results text assigns each group's cAMP mean to the other group, contradicting its own "higher" claim
PLoS Pathog (2013) · doi:10.1371/journal.ppat.1003319 · PMC3635970
Summary
The Results sentence for Figure 6B says that CD4+ T cells from HIV+ patients have "higher" intracellular cAMP than controls. The means it gives point the other way: 548.3 ± 9.1 fmol/million cells for HIV+ and 761.6 ± 29.4 for controls, which puts HIV+ 28% lower. Reading the six points per group off the published Figure 6B gives 547.8 ± 9.1 for the HIV− squares and 760.5 ± 29.4 for the HIV+ circles. The printed numbers are the figure's numbers with the two group labels swapped, so the figure and the paper's direction of effect (HIV+ higher) stand, and the sentence as printed contradicts itself. Separately, the Figure 6B legend gives 8 controls where the text gives 6, and the figure and the printed SEM both fit 6. The higher-cAMP result is one step of the mechanism the abstract and conclusions put forward, so the sentence should be corrected.
What the paper reports
All quotations were checked verbatim against the PMC-archived text with src/show.py.
Results, section "In vitro activated CD4+ cells from HIV+ patients were not able to demethylate il-2 CpG site 1 ...", first paragraph:
Ex vivo CD4+ T cells from HIV+ patients (n = 6) exhibit also higher levels of intra-cytoplasmic cAMP (mean 548.3±9.1 fmol/million cells) as compared to controls (n = 6; mean 761.6±29.4 fmol/million cells) (P = 0.002; Figure 6B).
Same paragraph, last sentence:
All together these results demonstrate a constitutive high expression of A2AR and cAMP resulting in a clear inhibitory effect on CpG demethylation accompanied by the lack of IL-2 production in HIV+ART- upon anti-CD3/CD28 activation.
Figure 6 title and legend, panel B:
High levels of A2AR and endogenous cAMP in CD4+ T cells from HIV infected patients and lack of IL-2 production.
(B) CD4+ T cells were purified from the blood of ART-naive HIV-infected patients (n = 6) and healthy controls (n = 8). Intra-cellular cAMP is measured using the cAMP direct enzyme immunoassay from GE healthcare Biosciences.
Abstract:
We show here that CD4+ T-cells from HIV-1 infected individuals express high levels of A2AR and intracellular cAMP.
Author Summary:
We found that T cells from HIV patients have a higher expression on A2AR as well as intra-cellular cAMP and a lesser capacity to produce IL-2 upon stimulation than healthy subjects.
Introduction, third paragraph:
We also found that CD4+ T cells from HIV infected patients express high level of cytoplasmic cAMP
Discussion, third paragraph:
In accordance with this, we show significant increased intracellular cAMP levels in CD4+ T cells from HIV+ patients compared to healthy controls.
Discussion, concluding paragraph:
This defect is caused by increased intracellular cAMP, due in part to increased hydrolysis of inflammatory ATP by both expanded Treg/CD39+ and increased A2AR expression levels.
Materials and Methods, "Statistical analysis":
The non-parametric Mann-Whitney U, Fisher's exact and paired T tests were used for statistical analyses (GraphPad Prism 5.0 statistical software).
What the paper's own numbers show
Method. First, I compared the two means printed in the Results sentence. Second, I read the individual points of Figure 6B off the publisher's image (PLOS "large" figure g006, 2776 × 2063 px). I calibrated the y-axis on its five tick marks (500 to 900; one pixel = 0.67 fmol/million cells; tick residuals ≤ 0.13). I located each marker's centroid after a morphological opening that removes the thin mean and error-bar lines, and I located the drawn mean bars and error-bar caps from their pixel rows. Third, I recomputed the mean, SD and SEM of each group of points, and the Mann-Whitney P values that the possible sample sizes allow. The pixel positions and every calculation are in recompute.py.txt, which prints every number below. One marker (a square behind the HIV− mean bar) is partly hidden; its centroid is taken from its visible rows. Read-off values are accurate to about ±1 fmol/million cells.
| Quantity | Location | Reported | Recomputed from the paper's own numbers |
|---|---|---|---|
| Direction of the difference | Results sentence | "higher" in HIV+ | 548.3 − 761.6 = −213.3; HIV+/control = 0.720 (HIV+ 28.0% lower) |
| HIV+ mean ± SEM | Results sentence | 548.3 ± 9.1 | Figure 6B HIV+ circles: 760.5 ± 29.4 (n = 6; drawn bar 761.9 ± 30.1) |
| Control mean ± SEM | Results sentence | 761.6 ± 29.4 | Figure 6B HIV− squares: 547.8 ± 9.1 (n = 6; drawn bar 548.0 ± 8.9) |
| Individual values, HIV− | Figure 6B | not stated | 574.8, 572.8, 553.0, 532.8, 528.8, 524.8 (SD 22.3) |
| Individual values, HIV+ | Figure 6B | not stated | 818.7, 808.9, 792.9, 768.9, 750.8, 622.8 (SD 72.0) |
| Control n | Results text vs Figure 6B legend | 6 vs 8 | 6 squares visible; SD/√6 of those six = 9.12, matching the printed ±9.1 |
| SEM if two hidden controls lay at the mean (n = 8) | hypothetical | — | 6.68 (would need SD 25.7 over 8 values to give 9.1) |
| P value, 6 vs 6, complete separation | Results (P = 0.002) | 0.002 | exact Mann-Whitney 2/924 = 0.00216; normal approximation 0.0039 |
| P value, 6 vs 8, complete separation | if the legend's n were right | — | exact 2/3003 = 0.00067; normal approximation 0.0019 |
| Exact P, 6 vs 8, U = 1 and U = 2 | if not completely separated | — | 0.00133 and 0.00266 |
| Size of the difference, corrected labels | from printed means and SEMs | — | +213.3 (HIV+ 38.9% higher); Welch t = 6.93, P = 4.6 × 10⁻⁴ |
Taken at its word, the Results sentence reports HIV+ cAMP below the control level, the opposite of what the same sentence says. Each printed mean and SEM matches, to within read-off accuracy, the mean and SEM of the other group's points in Figure 6B. The figure's HIV+ circles all lie above its HIV− squares, which is the direction the text states. Because the twelve points are completely separated, the exact Mann-Whitney test gives P = 0.00216, which rounds to the reported 0.002.
Figure
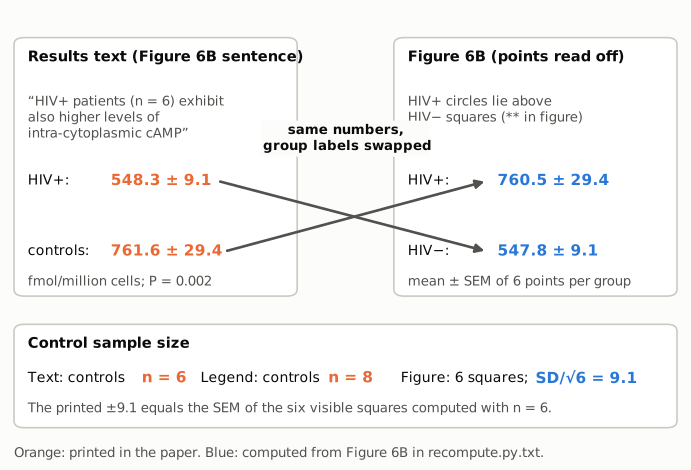
Figure 1. Left: the Results sentence and the means ± SEM it prints for each group (orange). Right: the mean ± SEM of the six points per group read off the published Figure 6B (blue), computed in recompute.py.txt. The connectors show that the value printed for HIV+ matches the figure's HIV− group and the value printed for controls matches the figure's HIV+ group. Bottom: the control sample size is 6 in the text and 8 in the legend. Six control squares are visible, and the printed ±9.1 equals the SD of those six divided by √6. The diagram reproduces no part of the paper's figure; it shows only summary numbers.
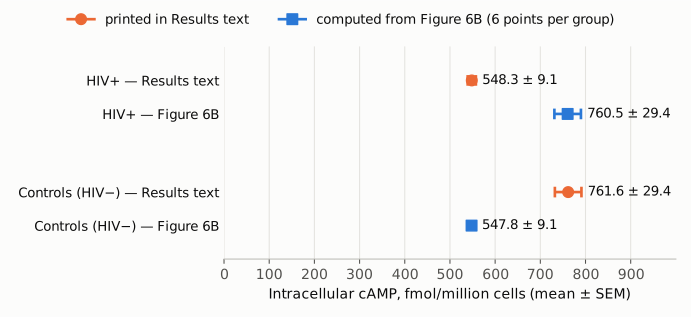
Figure 2. The four means ± SEM on one axis from zero, in fmol/million cells. Orange circles are printed in the Results text; blue squares are computed from the six points per group read off Figure 6B. The printed HIV+ value (548.3) coincides with the figure's control value (547.8), and the printed control value (761.6) with the figure's HIV+ value (760.5). The interval widths match in the same crossed way (±9.1 and ±29.4).
Why it matters
- The sentence contradicts itself on a mechanistic result. Higher intracellular cAMP in HIV+ CD4+ T cells is the step that links the CD39/A2AR pathway to the impaired IL-2 response in patients. The abstract, author summary, introduction, Figure 6 title, the Results summary sentence and the Discussion all rely on it. A reader who takes the means from the Results sentence, for example for a meta-analysis or to plan a study, gets the direction wrong and an HIV+ mean about 212 fmol/million cells too low.
- The finding itself is not affected. The published figure shows HIV+ above HIV−, and the printed numbers, once assigned to the right groups, give a 38.9% increase that is clearly significant (exact Mann-Whitney P = 0.00216 on the read-off values). The error is in how the sentence reports the data, not in the data or the conclusion.
- The control sample size is stated two ways. The legend's n = 8 and the text's n = 6 cannot both be right for the same measurement. This matters for anyone weighing or pooling the result, and for a reader checking the P value.
Explanations considered
- Different units, normalisation or transformation. Ruled out. Both groups are given in fmol/million cells from the same enzyme immunoassay on ex vivo CD4+ T cells, and the figure's axis has the same units. No rescaling turns 548.3 into the larger of the two values.
- The printed numbers are right and the direction words are wrong. Not supported. The published Figure 6B places the HIV+ circles (about 623 to 819) above all the HIV− squares (about 525 to 575). The direction "higher in HIV+" is repeated throughout the paper, and the Discussion cites earlier reports of higher cAMP in T cells from HIV+ patients.
- The text describes a different data set from Figure 6B. Not supported. The sentence cites Figure 6B, and the means and SEMs of the plotted points reproduce the printed values to within 1.1 fmol/million cells (means) and 0.03 (SEMs), but only with the group labels exchanged. It would be a remarkable coincidence for a different data set to produce both numbers.
- "±" is an SD rather than an SEM. Not supported. The SDs of the plotted points are 22.3 and 72.0. The printed 9.1 and 29.4 equal their SDs divided by √6, and the drawn error bars (±8.9 and ±30.1) are SEM bars.
- The legend's n = 8 is right and two control points are hidden by overlap. Unlikely, though it cannot be fully excluded from an image. Two extra values would have to keep the mean at about 548 and raise the SD from 22.3 to about 25.7 so that SD/√8 still equals 9.1. If they sat at the mean, the SEM would be 6.68. The P value does not settle the question alone. Under an exact test, which the Prism 5 documentation says it uses for small samples without ties, 6 vs 6 gives 0.00216 (reported 0.002), while 6 vs 8 can give only 0.00067, 0.00133 or 0.00266 near that value. Under the normal approximation, however, 6 vs 8 gives 0.0019, which would also round to 0.002. The next sentence of the Results gives "healthy controls (n = 8)" for the Figure 6C IL-2 experiment, which may be where the legend's 8 came from; that is an inference only.
- A conversion or typesetting artifact in PMC. Ruled out. The publisher's article page gives the same sentence and the same legend, word for word.
- A correction already issued. None found (see Status).
Status
- Version of record. The PLOS Pathogens article page (journals.plos.org, the doi.org target), retrieved on 2026-10-24, gives the Results sentence and the Figure 6B legend exactly as quoted above. The Figure 6B values were read from the publisher's own figure image (g006, large size), not from the PMC rendering.
- Supplements. The publisher lists four supporting figures: S1 (ATPase activity of Treg/CD39+ vs Treg/CD39−), S2 (CD73 expression), S3 (HPLC of AMP conversion to adenosine) and S4 (anti-CD39 effect on a cell line). None covers the cAMP measurement in patients, and no source data are posted. The question of control n = 6 vs 8 therefore cannot be settled beyond what the figure shows.
- Corrections and comments. As of 2026-10-24 I found no correction, erratum, retraction or expression of concern.
src/known.pyreturns no Crossref update relations, no PMC notices and no Europe PMC notices. The Crossref record has no update-to or updated-by fields and an empty relation field. The PLOS article page shows no correction notice. The PubPeer API returned no record (HTTP 404) for the DOI, and PubPeer's search page could not be queried automatically. A web search for the title together with "PubPeer", "correction" or "erratum" found no thread or notice. - Sources. PMC article PMC3635970; PLOS Pathogens article page and Figure 6 image (https://doi.org/10.1371/journal.ppat.1003319); Crossref; Europe PMC; PubPeer; GraphPad knowledgebase article #416 on Prism 5's Mann-Whitney P values.
Suggested correction
In the Results, replace
Ex vivo CD4+ T cells from HIV+ patients (n = 6) exhibit also higher levels of intra-cytoplasmic cAMP (mean 548.3±9.1 fmol/million cells) as compared to controls (n = 6; mean 761.6±29.4 fmol/million cells) (P = 0.002; Figure 6B).
with
Ex vivo CD4+ T cells from HIV+ patients (n = 6) exhibit also higher levels of intra-cytoplasmic cAMP (mean 761.6±29.4 fmol/million cells) as compared to controls (n = 6; mean 548.3±9.1 fmol/million cells) (P = 0.002; Figure 6B).
The authors should also confirm the number of controls in the cAMP assay from their records and make the Figure 6B legend agree with the text. If the six plotted controls are the full set, the legend should read "healthy controls (n = 6)". It would help to state that the ± values are SEMs.