← Back to the plain-language case
Abstract and Results report different median CCK iAUC values for the same before–after comparison
Diabetes Care (2012) · doi:10.2337/dc11-2050 · PMC3329824
Summary
The paper reports the meal-test incremental area under the curve (iAUC) for cholecystokinin (CCK) in 20 subjects before (day 14) and at the end (day 70) of colesevelam treatment, once in the Abstract and once in the Results text. The two passages give different numbers for the same comparison: 43.2 [0–130.1] to 127.1 [47.2–295.2] pmol/L·min in the Abstract, and 27.5 [2.4–109.2] to 200.3 [40.3–300] pmol/L·min in the Results. All six medians and quartiles differ, and the implied ratio of medians is about 2.9-fold in one version and about 7.3-fold in the other. The three other iAUCs reported in both places (glucose, insulin, FGF-19) match digit for digit. Both versions show a significant increase, so the direction of the finding holds either way, but at least one set of CCK figures is wrong, and the CCK increase is the mechanism the Abstract's conclusion invokes.
What the paper reports
All quotations were checked verbatim against the PMC-archived text with src/show.py.
Abstract, Results:
iAUC for cholecystokinin (CCK) increased (from 43.2 [0–130.1] to 127.1 [47.2–295.2] pmol/L ⋅ min, P < 0.01)
Results, "Effect of colesevelam on the release of gastrointestinal tract–related peptides":
Treatment with colesevelam was associated with increases in CCK during the MTT at 60, 90, and 120 min, the result being a significant increase in iAUC (from 27.5 [2.4–109.2] to 200.3 [40.3–300] pmol/L ⋅ min, P = 0.001). Basal MTT CCK concentrations did not differ before and after treatment.
Abstract, Conclusions:
This effect may be at least partially explained by the colesevelam-induced increase in CCK.
Methods, Calculations (one CCK iAUC is defined):
In a similar manner, iAUCs were calculated for the gastrointestinal peptides GLP-1, GIP, PYY, and CCK, as well as for FGF-19 and FGF-21.
Methods, MTT (one sampling window):
Blood samples were obtained at 5 and 1 min before the meal and every 30 min for 120 min after starting the meal.
Methods, Statistical analysis:
Unless otherwise specified, all data are mean ± SEM for normally distributed variables and median (interquartile range) for nonnormally distributed data.
For comparison, two other iAUCs that appear in both places. Results, "Effect of colesevelam on glucose tolerance, insulin sensitivity, and ..." and "... gastrointestinal tract–related peptides":
colesevelam administration was associated with decreases in the iAUC for both insulin (from 20,130 [13,542–35,292] to 13,086 [9,804–21,138] pmol/L ⋅ min, P < 0.05)
The iAUC for FGF-19 was significantly lower with colesevelam treatment (from 11,185 [1,346–17,661] to 2,093 [673–6,707] pg/mL ⋅ min, P < 0.01)
The Abstract gives the same insulin and FGF-19 values, and the same glucose iAUC (249.3 ± 28.5 to 198.8 ± 23.6 mmol/L ⋅ min, P < 0.01) as the Results.
What the paper's own numbers show
Method. No individual-level data are available, so the check is a comparison of the reported summaries. For each iAUC reported in both the Abstract and the Results, I compared the six reported numbers (median and quartiles, or mean and SEM, at day 14 and day 70) field by field. For CCK, I computed the ratio and the difference of the reported medians in each version, the Results-to-Abstract ratio for each field (a unit or scaling difference would make these ratios equal), and whether each version's medians fall inside the other's IQR. Ratios and differences of medians describe the reported group summaries; they are not the median paired change, which the paper does not report. Every number below is printed by recompute.py.txt.
| Quantity | Location | Reported | Recomputed from the paper's own numbers |
|---|---|---|---|
| CCK iAUC, day 14, median [IQR] (pmol/L·min) | Abstract | 43.2 [0–130.1] | differs from Results in all 3 numbers: median −15.7, Q1 +2.4, Q3 −20.9 |
| CCK iAUC, day 14, median [IQR] (pmol/L·min) | Results | 27.5 [2.4–109.2] | — |
| CCK iAUC, day 70, median [IQR] (pmol/L·min) | Abstract | 127.1 [47.2–295.2] | differs from Results in all 3 numbers: median +73.2, Q1 −6.9, Q3 +4.8 |
| CCK iAUC, day 70, median [IQR] (pmol/L·min) | Results | 200.3 [40.3–300] | — |
| CCK ratio of medians, day 70 / day 14 | Abstract | — | ×2.94 |
| CCK ratio of medians, day 70 / day 14 | Results | — | ×7.28 (2.48 times the Abstract's ratio) |
| CCK difference of medians | Abstract | — | +83.9 pmol/L·min |
| CCK difference of medians | Results | — | +172.8 pmol/L·min (2.06 times the Abstract's) |
| Results / Abstract, per CCK field | both | — | 0.637 (day-14 median), 0.839 (day-14 Q3), 1.576 (day-70 median), 0.854 (day-70 Q1), 1.016 (day-70 Q3); day-14 Q1 is 0 in the Abstract. No common factor |
| CCK P value | Abstract; Results | P < 0.01; P = 0.001 | compatible with each other |
| Glucose iAUC, mean ± SEM (mmol/L·min) | Abstract; Results | 249.3 ± 28.5 to 198.8 ± 23.6 (both) | 0 of 6 fields differ; ratio of means ×0.80 in both |
| Insulin iAUC, median [IQR] (pmol/L·min) | Abstract; Results | 20,130 [13,542–35,292] to 13,086 [9,804–21,138] (both) | 0 of 6 fields differ; ratio of medians ×0.65 in both |
| FGF-19 iAUC, median [IQR] (pg/mL·min) | Abstract; Results | 11,185 [1,346–17,661] to 2,093 [673–6,707] (both) | 0 of 6 fields differ; ratio of medians ×0.19 in both |
| Mean CCK increment above basal implied by the median iAUC over 120 min | Abstract | — | 0.36 pmol/L (day 14), 1.06 pmol/L (day 70) |
| Same | Results | — | 0.23 pmol/L (day 14), 1.67 pmol/L (day 70) |
Each version's day-14 and day-70 medians fall inside the other version's IQR at the same time point, and both versions describe a plausible range for a 120-minute iAUC given the assay's stated detection limit of 0.3 pmol/L. So neither version is internally impossible, and the reported summaries cannot show which one is correct. They do show that the two cannot both be right: the same 20 paired measurements have one median and one pair of quartiles at each time point.
Figure
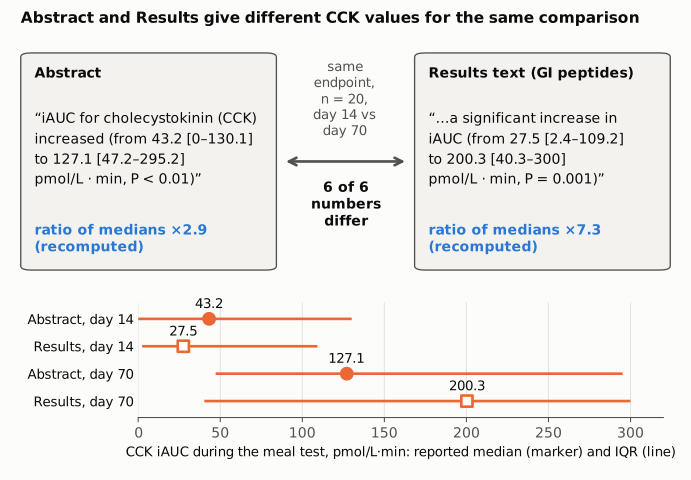
Figure 1. Top: the two passages that report the meal-test CCK iAUC, quoted verbatim from the Abstract and from the Results subsection on gastrointestinal peptides. Both describe the same endpoint in the same 20 subjects, day 14 (end of placebo run-in) against day 70 (end of colesevelam). Below each passage, in blue, is the ratio of day-70 to day-14 medians recomputed from its numbers: ×2.9 for the Abstract and ×7.3 for the Results. Bottom: the reported medians (markers) and interquartile ranges (lines) on one linear axis starting at 0, in orange because all are values printed in the paper. Filled circles are the Abstract's values and open squares the Results' values. At each time point the two versions give different medians and different quartiles.
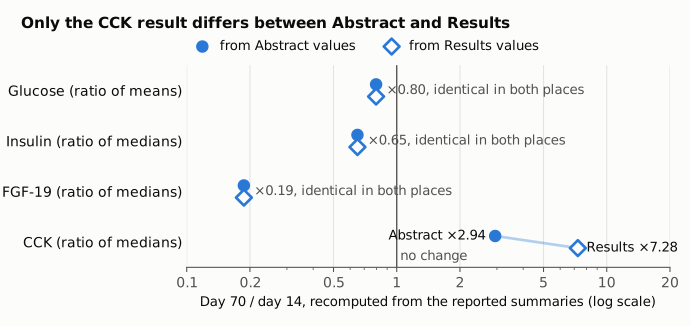
Figure 2. Ratio of day-70 to day-14 summaries (log scale; the thin vertical line marks no change) for every meal-test iAUC that the paper reports in both the Abstract and the Results, recomputed from the reported values (blue). Filled circles use the Abstract's values; open diamonds use the Results' values. For glucose (ratio of means), insulin and FGF-19 (ratios of medians), the two sources give identical numbers, so the markers coincide at ×0.80, ×0.65 and ×0.19. For CCK they give ×2.94 and ×7.28. The mismatch is confined to CCK.
Why it matters
- The CCK result is the paper's proposed mechanism. The Abstract concludes that the improvement in oral glucose tolerance "may be at least partially explained by the colesevelam-induced increase in CCK", and the Discussion builds on it: delayed gastric emptying, suppression of hepatic glucose output, and the statement "we favor the change in CCK being the primary event". The numbers behind that increase are given two different ways.
- The size of the effect is uncertain by a factor of about 2.5. The ratio of medians is ×2.94 in the Abstract and ×7.28 in the Results; the difference of medians is +83.9 and +172.8 pmol/L·min. A reader comparing the CCK rise with physiological CCK infusion studies, as the Discussion does, or using the figure in a review or meta-analysis, cannot tell which magnitude the data support.
- The two versions circulate separately. The PubMed abstract, which indexing services reproduce, carries the Abstract's values (43.2 to 127.1), while the full text carries the other set (27.5 to 200.3).
- What is not affected. Both versions show an increase that is significant (P = 0.001 also satisfies P < 0.01), so the qualitative statement that postprandial CCK rose with colesevelam holds under either. The glucose, insulin and FGF-19 iAUCs, the null FSIGT results, and the title claim (independence from insulin sensitivity and β-cell function) are reported consistently and do not depend on the CCK figures. CCK is a secondary, mechanistic measure in this study.
Explanations considered
- Rounding or a typographical slip in one digit. Does not account for it. All six numbers differ, by up to 73.2 pmol/L·min, which is far beyond rounding at one decimal place. A single transposed digit would change one number, not six.
- Different units or a scaling factor. Does not account for it. Both passages state pmol/L·min. The Results-to-Abstract ratios differ across fields (0.637 for the day-14 median, 1.576 for the day-70 median, 0.839 to 1.016 for the quartiles), whereas a unit conversion would multiply every number by the same factor.
- A different population or subset. Not supported. The paper reports one analysed cohort (21 enrolled, 20 completed) and no CCK-specific exclusions, missing samples or subset analysis.
- Different time points. Not supported. Both passages compare the same two visits; the Methods and the Figure 3 legend define them as day 14 (before colesevelam) and day 70 (end of treatment).
- A different iAUC definition or time window. Not supported. The Methods define one iAUC per analyte by the trapezoidal method, and the MTT has one sampling schedule (−5 and −1 min, then every 30 min to 120 min). No alternative window, baseline definition or adjusted value is described.
- Mean versus median, or log-transformed values. Not supported. Both passages are in median [IQR] form, as the Methods specify for non-normal data. Log transformation does not change the ordering of the observations, so back-transformed medians and quartiles could differ from the raw ones only through interpolation between neighbouring observations (n = 20), not by 36% to 58% at both time points.
- The P values identify the correct version. They do not. "P < 0.01" and "P = 0.001" are compatible, so they cannot discriminate between the two sets.
- A conversion or typesetting artifact in the archived copy. Ruled out. The same Abstract values appear in the live PMC page, the Europe PMC full-text XML and the publisher-supplied PubMed abstract (PMID 22446171), and the same Results values appear in the PMC page and the Europe PMC XML.
- A systematic difference between the Abstract and the body. Not supported. Every other iAUC reported in both places (glucose, insulin, FGF-19) matches exactly, so the discrepancy is confined to CCK.
- The paper's other material resolves it. It does not. Table 1 has no CCK values, Figure 3D shows the CCK curves without numbers (and plots time courses, not iAUC medians), no supplementary material is listed, and the ClinicalTrials.gov record (NCT00990184) posts results only for AIRg, SI and Kg.
Status
- Version of record. The publisher's page (doi.org redirects to diabetesjournals.org) returned HTTP 403 to automated fetches, as did its PDF links. The live PMC page and the Europe PMC full-text XML carry the publisher's typeset text, and both contain the two CCK passages exactly as quoted. The PubMed abstract (PMID 22446171) has the Abstract's values (43.2 [0-130.1] to 127.1 [47.2-295.2], P < 0.01).
- Supplements. None listed on PMC or in the JATS XML; the Europe PMC supplementary-files endpoint returned 404. ClinicalTrials.gov NCT00990184 has posted results but no CCK data.
- Corrections and comments. As of 2026-10-24, no correction, erratum, retraction or expression of concern was found.
src/known.pyreturns no Crossref updates, PMC notices or Europe PMC notices; the Crossref record has no update relations; the PubMed record has no CommentsCorrections entries; the Retraction Watch database (Crossref Labs export) has no entry for the DOI or PMID. The PubPeer API returned no record (HTTP 404) for the DOI, and web searches for the title with "erratum", "correction" or "PubPeer" found none. - Sources. PMC3329824 (via
src/show.py); https://pmc.ncbi.nlm.nih.gov/articles/PMC3329824/; Europe PMC full-text XML for PMC3329824; PubMed PMID 22446171; https://doi.org/10.2337/dc11-2050; Crossref; Retraction Watch database; PubPeer; https://clinicaltrials.gov/study/NCT00990184.
Suggested correction
The authors may wish to check the CCK iAUC summaries against the source data and correct whichever passage is wrong, so that the Abstract and the Results report the same values. If the Results values are correct, the Abstract would read:
iAUC for cholecystokinin (CCK) increased (from 27.5 [2.4–109.2] to 200.3 [40.3–300] pmol/L ⋅ min, P = 0.001)
If the Abstract values are correct, the Results sentence would read "... a significant increase in iAUC (from 43.2 [0–130.1] to 127.1 [47.2–295.2] pmol/L ⋅ min, P = ...)", with the exact P value. A correction notice could also give the median of the paired within-subject change (or the Wilcoxon test statistic), which would let readers judge the size of the CCK increase that the mechanistic conclusion rests on.