← Back to the plain-language case
Abstract attaches the most- and least-sitting case counts to the wrong exposure groups
BMJ (2011) · doi:10.1136/bmj.d3867 · PMC3266839
Summary
The abstract illustrates the primary association with raw counts: "41/104 720 v 16/14 565 cases in most inactive v least inactive". In Table 2, 41/104 720 belongs to score 2, the group that sat least and the reference group, and 16/14 565 belongs to score 6, the group that sat most. The abstract therefore attaches each count to the opposite extreme. Read as printed, the counts give a crude rate ratio of 0.36 for most versus least inactive, which suggests a protective pattern. With Table 2's labels the ratio is 2.81, which agrees with the hazard ratios of 2.73, 2.68 and 2.34 that the paper reports. The hazard ratios, the trend test and the conclusion are not affected; the error is in the labelling of one parenthetical in the abstract's primary result.
What the paper reports
Abstract, Results:
There was an association between time of sitting and risk of idiopathic pulmonary embolism (41/104 720 v 16/14 565 cases in most inactive v least inactive in combined data; P<0.001 for trend). The risk of pulmonary embolism was more than twofold in women who spent the most time sitting compared with those who spent the least time sitting (multivariable hazard ratio 2.34, 95% confidence interval 1.30 to 4.20).
Methods, Exposures:
Thus, each woman was assigned to one of five categories of time sitting, with point values ranging from 2 (low time sitting in 1988 and 1990) to 6 (high time sitting in 1988 and 1990).
Methods, Statistical analysis:
For all analyses of physical inactivity, we used the group with the lowest amount of time sitting as the reference group.
Table 2, header and first row ("Amount of time sitting* (score 2=lowest, 6=highest), combined data from 1988 and 1990"; columns 2, 3, 4, 5, 6):
No of cases/person years | 41/104 720 | 53/175 518 | 104/209 002 | 54/88 228 | 16/14 565 | —
Table 2, hazard ratio rows (score 2 is the reference, 1.00):
Age adjusted HR (95% CI) | 1.00 | 0.79 (0.52 to 1.19) | 1.31 (0.90 to 1.88) | 1.62 (1.08 to 2.44) | 2.73 (1.53 to 4.88) | 1.29 (1.15 to 1.45), <0.001
Multivariable HR (95% CI)‡ | 1.00 | 0.79 (0.53 to 1.19) | 1.29 (0.89 to 1.85) | 1.51 (1.01 to 2.28) | 2.34 (1.30 to 4.20) | 1.25 (1.12 to 1.40), <0.001
Results, second paragraph:
For women with the most physical inactivity, the risk of pulmonary embolism was more than twice that of women with the least physical inactivity (multivariable hazard ratio 2.68, 1.50 to 4.79).
What the paper's own numbers show
Method. I took the cases and person-years for each sitting score from Table 2 and the number of participants per score from Table 1. I checked that the totals match the text, used the Table 1 sitting-hours distribution to confirm which way the score runs, and computed crude incidence rates per 100 000 person-years. I then computed the crude rate ratio for most versus least sitting twice: once with Table 2's group labels and once with the labels the abstract gives. A crude rate ratio is not adjusted, so it need not equal the Cox hazard ratios, but it should point the same way and be of similar size. Every number below is printed by recompute.py.txt.
| Quantity | Location | Reported | Recomputed from the paper's own numbers |
|---|---|---|---|
| Total cases | Abstract; Results; Table 2 | 268 | 41 + 53 + 104 + 54 + 16 = 268 |
| Total participants | Abstract; Table 1 | 69 950 | 12 451 + 20 718 + 24 549 + 10 403 + 1829 = 69 950 |
| Direction of the score | Methods; Table 1 (1988 sitting) | 2 = low, 6 = high sitting | score 2: 100% sat <10 h/week; score 6: 100% sat ≥41 h/week |
| Score 2 (least sitting, reference) | Table 2, column 2 | 41/104 720 | 39.2 per 100 000 person-years |
| Score 6 (most sitting) | Table 2, column 6 | 16/14 565 | 109.9 per 100 000 person-years |
| Group labelled "most inactive" | Abstract | 41/104 720 | equals Table 2 score 2, the least-sitting group |
| Group labelled "least inactive" | Abstract | 16/14 565 | equals Table 2 score 6, the most-sitting group |
| Crude ratio, most v least, abstract's labels | Abstract | (implied) | 0.36 (39.2 ÷ 109.9) |
| Crude ratio, most v least, Table 2 labels | Table 2 | — | 2.81 (109.9 ÷ 39.2; approximate 95% CI 1.57 to 5.00) |
| HR, score 6 v score 2 | Table 2; Results; Abstract | 2.73 (age adjusted); 2.68 and 2.34 (multivariable) | consistent with 2.81, not with 0.36 |
The crude rates by score (39.2, 30.2, 49.8, 61.2, 109.9 per 100 000 person-years) follow the same pattern as the age-adjusted hazard ratios (1.00, 0.79, 1.31, 1.62, 2.73). Follow-up per woman is similar across scores (7.96 to 8.51 person-years), so person-time does not distort the comparison. The two counts in the abstract are correct numbers; only the group names attached to them are reversed.
Figure
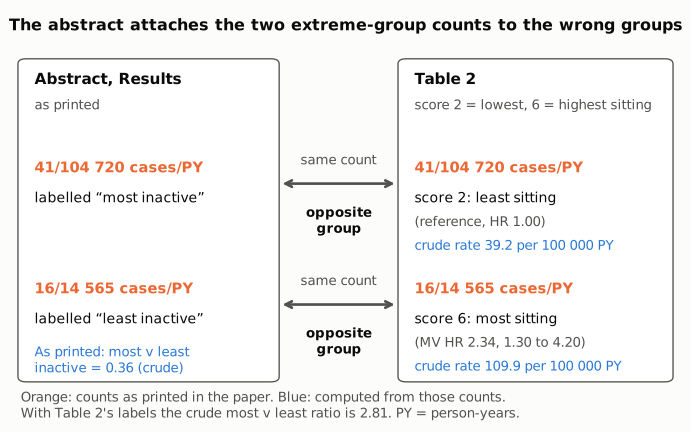
Figure 1. Left panel: the parenthetical in the abstract's Results, with each count (orange, as printed) and the group name the abstract gives it. Right panel: the same two counts in Table 2, with the column they occupy, the group the paper's Methods and Table 2 define for that column, and the reported hazard ratio. The crude rates (blue) are computed from the printed counts. The connectors join identical counts: 41/104 720 is "most inactive" in the abstract but the least-sitting reference group in Table 2, and 16/14 565 is "least inactive" in the abstract but the most-sitting group in Table 2. Taken as printed, the abstract's comparison gives a crude most-versus-least ratio of 0.36; with Table 2's labels it is 2.81.
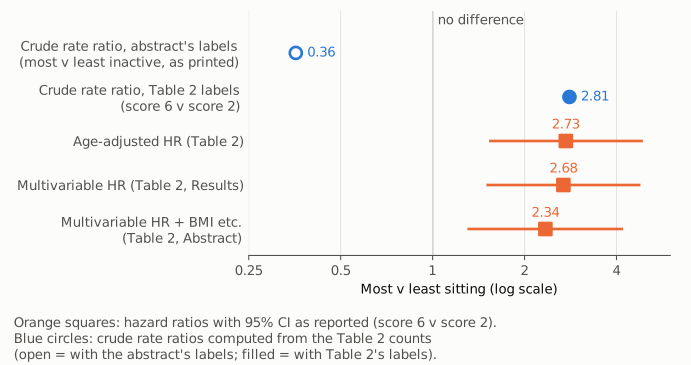
Figure 2. Most versus least sitting on one log axis, with a thin reference line at 1 (no difference). Orange squares with bars are the three hazard ratios (95% CI) for score 6 versus score 2 reported in Table 2, the Results and the abstract. Blue circles are crude rate ratios computed from the Table 2 counts: the open circle uses the abstract's labels (0.36), the filled circle uses Table 2's labels (2.81). Only the filled circle lies within the reported confidence intervals; the open circle lies on the other side of the null. The log scale is used because the quantities are ratios; it shows 0.36 and 2.81 as equally far from 1, which they are (one is the reciprocal of the other).
Why it matters
- The abstract's own illustration points the wrong way. The parenthetical is the abstract's only raw-data support for the primary finding. As printed, it says the most inactive women had 41 cases in 104 720 person-years and the least inactive 16 in 14 565, that is, a lower rate in the most inactive group. The next sentence then states a hazard ratio of 2.34 for most versus least sitting. A reader who checks the counts finds them contradicting the estimate they are meant to support.
- Abstract-only readers are the most exposed. The same sentence appears in the PubMed abstract. Clinicians, guideline writers and journalists who read only the abstract cannot resolve the conflict without Table 2.
- The conclusion is not affected. The hazard ratios (2.73, 2.68, 2.34), the trend tests (P<0.001), the Results text, the key points box ("more than twofold in women who spent the most time sitting") and the Conclusions all state the correct direction, and the corrected crude ratio of 2.81 agrees with them. No estimate changes in direction, size or significance.
Explanations considered
- The score runs the other way (2 = most sitting). Ruled out. The Methods define 2 as "low time sitting in 1988 and 1990" and 6 as "high time sitting in 1988 and 1990"; the Table 2 header says "score 2=lowest, 6=highest" and the Table 1 header "2=lowest, 6=highest"; and Table 1 shows that 100% of score 2 sat less than 10 hours a week in 1988 while 100% of score 6 sat 41 hours or more. The Methods also name the lowest-sitting group as the reference, and score 2 carries HR 1.00.
- "Inactive" refers to the secondary exposure (physical activity in MET). Ruled out. The sentence is about "time of sitting", and the counts in Table 3 for the physical activity analysis are different numbers. Both counts quoted in the abstract occur only in Table 2's first row.
- A different model, subset or population. Ruled out. The counts are raw cases and person-years from the combined 1988/1990 data (n = 69 950), and the five columns add up to the 268 cases stated in the abstract and Results.
- The phrase "X v Y in A v B" could be read in another order. No reading resolves it. Read in parallel, the first count goes with "most inactive", and that count is the reference (least sitting) group. No other pairing of the two counts with the two labels is supported by the sentence's structure.
- The crude ratio cannot be compared with an adjusted hazard ratio. It need not match exactly, but it should agree in direction. With Table 2's labels the crude ratio is 2.81, close to the age-adjusted HR of 2.73; with the abstract's labels it is 0.36, on the opposite side of the null from every hazard ratio the paper reports.
- A text-conversion artifact in the PMC copy. Ruled out. The publisher's typeset PDF has the same abstract sentence word for word. In that PDF, Table 2 puts 41/104 720 and HR 1.00 under column "2" and 16/14 565 and HRs 2.73 and 2.34 under column "6", judged by the positions of the words on the page. Plain text extraction prints the columns of that table in reverse order, but that is only reading order; the column positions are unambiguous. The Europe PMC full-text XML, the PMC page and the PubMed abstract agree.
- A correction already issued. None found (see Status).
Status
- Version of record. The publisher's pages on bmj.com (through doi.org, the article page, its PDF and its rapid responses) returned HTTP 403 to automated requests, and the Europe PMC and PMC PDF renders were also unavailable (403 and a CAPTCHA). I therefore checked the publisher's typeset BMJ PDF as deposited in Harvard's DASH repository, whose page footers read "BMJ 2011;342:d3867 doi: 10.1136/bmj.d3867 (Published 4 July 2011)". It has the abstract sentence word for word, and Table 2 (PDF page 10) has the same column assignment as the PMC text. The Europe PMC full-text XML, the PMC HTML page and the PubMed abstract (PMID 21727169) agree. Every quotation above was checked verbatim against the PMC-archived text with
src/show.py. - Supplements. Europe PMC lists no supplementary files for PMC3266839, its full-text XML has no supplementary-material element, and neither the PMC page nor the typeset PDF mentions web extras. A data supplement on bmj.com could not be excluded because the site refused access, but none is needed: the main text fixes the direction of the score, and Table 2 matches it.
- Corrections and comments. As of 2026-10-24 I found no correction, erratum, retraction or expression of concern.
src/known.pyreturns no Crossref update relations and no PMC or Europe PMC notices; the Crossref record has empty update-to and updated-by fields. The PubMed CommentsCorrections list holds only two "CommentIn" links, the accompanying BMJ editorial (d3865, PMID 21727168) and a 2012 comment in Clin J Sport Med (PMID 22388344); neither is an erratum. PubPeer returned no record (HTTP 404) to an automated DOI query and its search page refused access (403); a web search for the title together with "PubPeer" found no thread for this article. The BMJ rapid responses could not be read (403). - Sources. PMC article PMC3266839; Europe PMC full-text XML and supplementary-files endpoint for PMC3266839; typeset BMJ PDF on Harvard DASH; PubMed (PMID 21727169); Crossref; PubPeer; https://doi.org/10.1136/bmj.d3867.
Suggested correction
In the abstract's Results, replace
(41/104 720 v 16/14 565 cases in most inactive v least inactive in combined data; P<0.001 for trend)
with
(16/14 565 v 41/104 720 cases in most inactive v least inactive in combined data; P<0.001 for trend)
so that the counts match Table 2: score 6 (most sitting) 16 cases in 14 565 person-years, about 110 per 100 000 person-years, and score 2 (least sitting) 41 cases in 104 720 person-years, about 39 per 100 000 person-years. Keeping the order of the counts and swapping the labels ("in least inactive v most inactive") would be an equivalent fix. No other part of the paper needs to change.