← Back to the plain-language case
The abstract and the body disagree on nitric oxide after arg1 knockdown; which wording is right depends on the comparison
PLoS Pathog (2012) · doi:10.1371/journal.ppat.1002417 · PMC3261917
Summary
The abstract reports that miRNAi-mediated knockdown of host arginase 1 (arg1) in BHK cells "led to increased generation of nitric oxide and reduced parasite burden (p<0.005)." The other three places in the body that describe the nitric oxide (NO) result of the same Fig. 6I experiment use the opposite wording: the Results subsection heading reads "promotes parasite killing without enhanced NO production," the Results prose says the enhanced killing "was not accompanied by greater parasite-induced NO production (Fig. 6I)," the Fig. 6I legend says "Arg1 knockdown did not induce NO production," and the Discussion says the effect "did not appear to be driven by enhanced production of NO." This is a wording inconsistency about the direction of a single result.
It can be resolved only by naming the comparison, because the two descriptions refer to different control groups and both can be literally true. The paper prints no NO numbers — they appear only inside the Fig. 6I bar chart — so we digitised the four bars from the publisher's figure image. Relative to infected non-targeted control cells, knockdown NO is about 1.37 times higher (≈5.5 vs ≈4.0 µM); the figure draws no significance marker for that difference, and this is the comparison the abstract's "increased generation of nitric oxide" fits. Relative to uninfected cells, knockdown NO is essentially unchanged (≈5.5 vs ≈5.4 µM); that is the comparison the heading, prose, legend and Discussion fit when they say NO was not induced or not enhanced. So the inconsistency is in how the finding is phrased and against which reference, not a contradiction of the underlying measurement. It matters because the abstract and the body read as opposite directional claims about the same experiment, and the paper's stated mechanism is NO-independent (polyamine-mediated), so a reader of the abstract alone could take the opposite of what the body concludes.
What the paper reports
The abstract sentence (the two claims are "increased NO" and "reduced parasite burden"):
"miRNAi-mediated selective knockdown of hamster arginase 1 (arg1) in BHK cells led to increased generation of nitric oxide and reduced parasite burden (p<0.005)." (Abstract)
The Results subsection heading for the same experiment:
"Knockdown of host arg1 promotes parasite killing without enhanced NO production" (Results, subsection heading)
The Results prose, citing Fig. 6I directly:
"This enhancement of parasite killing by knockdown of arg1 in BHK cells was not accompanied by greater parasite-induced NO production (Fig. 6I), even though BHK cells were fully capable of generating NO (see Fig. 5B). Thus it would appear that parasite-induced macrophage arg1 contributes to L. donovani replication through mechanisms other than reduction of NO production." (Results, same subsection)
The Fig. 6I legend:
"Arg1 knockdown did not induce NO production in BHK cells infected with L. donovani." (Figure 6, legend, panel I)
The Discussion:
"This increased control of infection mediated by targeted arg1 knockdown did not appear to be driven by enhanced production of NO by the isolated infected macrophage, suggesting that the parasite-induced arginase has a pathological effect through the increase in polyamines that promote parasite growth." (Discussion)
What the paper's own figure shows
Method. No per-cell NO values are archived in text; the Fig. 6I bars are the only source. We downloaded the publisher's Figure 6 image (journals.plos.org, image g006, size=large) and measured the four bars in pixels against the panel's y-axis ticks (0 to 8 µM), using python. The extraction — axis calibration, bar tops, SD caps, and the position of the one significance bracket — is in recompute.py.txt, section 2, and reruns from the downloaded image. Reading precision is about ±0.05 µM (3 px), so the values below are estimates, not the authors' numbers.
Digitised Fig. 6I values (nitrites + nitrates, mean ± SD, µM):
| Uninfected | Infected (48 h) | |
|---|---|---|
| Arg1 knockdown | ≈5.4 ± 0.3 | ≈5.5 ± 0.4 |
| Non-targeted control | ≈6.3 ± 0.5 | ≈4.0 ± 0.5 |
The single significance bracket (**) runs between the two non-targeted bars (uninfected vs infected): infection lowered NO in control cells (≈6.3 → ≈4.0 µM). Knockdown cells held their baseline (≈5.4 → ≈5.5 µM). So:
- Relative to infected non-targeted control cells, knockdown NO is higher: ≈5.5 vs ≈4.0 µM, a ratio of about 1.37. The figure shows no significance marker for this difference.
- Relative to uninfected cells, infection did not induce NO in knockdown cells: ≈5.5 vs ≈5.4 µM (about +0.1 µM). Knockdown NO is also not above the uninfected non-targeted level (≈5.5 vs ≈6.3 µM).
Both the abstract and the body can therefore be read as literally true, each against a different control. The body's heading, prose and legend speak of "induction" and of NO relative to the uninfected or baseline state; the abstract's "increased generation of nitric oxide" fits a comparison of knockdown with the infected non-targeted control.
The second claim in the abstract sentence (reduced parasite burden) is supported by the Results, which give p<0.01 at 48 h and p<0.001 at 72 h (Fig. 6H); the abstract's bound p<0.005 is satisfied by the 72 h value. The knockdown efficiency (>90% reduction in arg1 mRNA, p=0.002; Fig. 6G) is not in dispute.
| Quantity | Location | Reported | Digitised / cross-check |
|---|---|---|---|
| NO after arg1 knockdown (wording) | Abstract | "increased generation of nitric oxide" | Fits KD vs infected non-targeted control: ≈5.5 vs ≈4.0 µM (×1.37; no significance marker drawn) |
| NO after arg1 knockdown (wording) | Results heading | "without enhanced NO production" | Fits KD infected vs uninfected: ≈5.5 vs ≈5.4 µM (not induced) |
| NO after arg1 knockdown (wording) | Results prose (Fig. 6I) | "not accompanied by greater parasite-induced NO production" | Infection did not raise NO in KD cells above its uninfected level |
| NO after arg1 knockdown (wording) | Fig. 6I legend | "did not induce NO production" | KD infected ≈5.5 µM vs KD uninfected ≈5.4 µM (no induction) |
| NO after arg1 knockdown (wording) | Discussion | "did not appear to be driven by enhanced production of NO" | Hedged; consistent with the no-induction reading |
| Only significance marker in Fig. 6I (**) | Fig. 6I | between non-targeted bars | Non-targeted uninfected ≈6.3 vs infected ≈4.0 µM (infection lowered control NO) |
| Reduced parasite burden p-value | Abstract | p<0.005 | Consistent: Results give p<0.01 (48 h), p<0.001 (72 h); the 72 h value satisfies p<0.005 |
| arg1 mRNA knockdown efficiency | Results / Fig. 6G | >90% reduction, p=0.002 | Stated once; not in dispute |
Figure
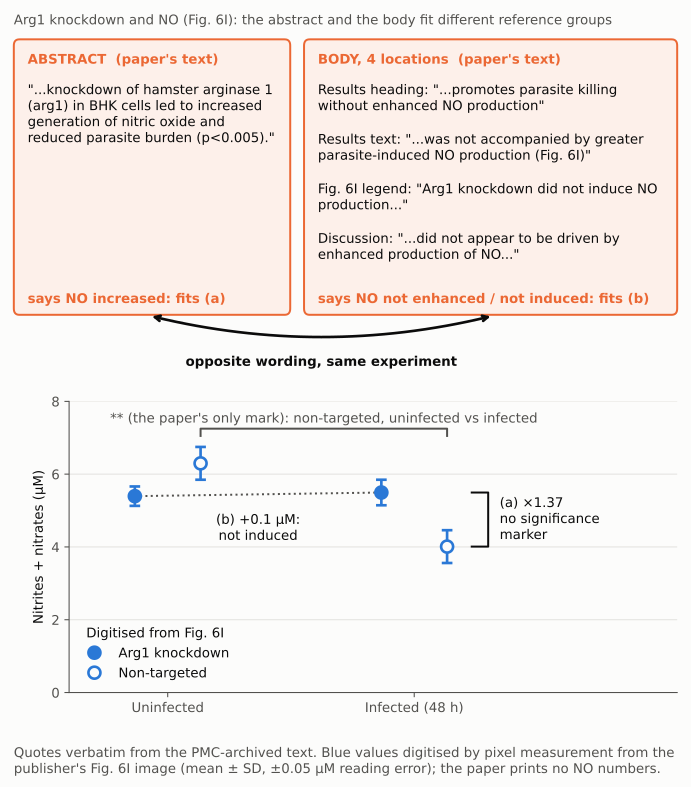
Figure 1. The abstract's wording (top left) and the body's wording (top right) describe the same Fig. 6I knockdown experiment but fit different reference groups. Below, the four Fig. 6I bars are shown as means ± SD on one axis, digitised from the publisher's figure image by pixel measurement (filled = Arg1 knockdown, open = non-targeted; the paper prints no NO numbers). Comparison (a): knockdown vs non-targeted among infected cells, ≈5.5 vs ≈4.0 µM (×1.37), which has no significance marker in the figure and matches the abstract's "increased" wording. Comparison (b): knockdown infected vs uninfected, ≈5.5 vs ≈5.4 µM, essentially unchanged, which matches the body's "not induced" wording. The paper's only significance mark (**) is between the two non-targeted bars (uninfected vs infected). All quotes are verbatim from the PMC-archived text; the blue values are digitised estimates, not the authors' numbers, and the paper's own figure is not reproduced.
Why it matters
The two statements sit in different parts of the paper — one in the abstract, which databases index, and the rest in the Results, legend and Discussion — and they read as opposite directional claims about the same measurement. The abstract's "increased generation of nitric oxide," taken on its own, suggests the canonical arginase-versus-NOS2 story in which inhibiting host arginase restores NO and that NO kills the parasite. The body instead concludes that enhanced parasite control was not driven by induction of NO and attributes it to reduced polyamine synthesis, explicitly NO-independent. Read against the Fig. 6I values, neither statement is simply wrong: the abstract's wording fits a comparison with infected control cells (for which the figure shows no significance marker), while the body's wording fits a comparison with uninfected or baseline cells. If a reader reconciles the abstract and the body by the wrong comparison, they could take away a mechanism the paper does not claim. The paper's principal conclusions are unaffected: arg1 knockdown reduces parasite burden, STAT6 knockdown reduces arg1 and enhances parasite control, and parasite-induced STAT6/arg1 drives progressive disease; these depend on the NO-independent reading. A secondary, cosmetic point: the abstract gives p<0.005 for the burden effect while the Results give p<0.01 at 48 h and p<0.001 at 72 h; the bound is satisfied by the 72 h value and changes no conclusion.
Explanations considered
- The two statements compare with different control groups. This is the resolution supported by the figure. "Increased generation of nitric oxide" is true relative to the infected non-targeted control (≈5.5 vs ≈4.0 µM; no significance marker shown). "Without enhanced NO production" / "did not induce NO" is true relative to the uninfected or baseline state (≈5.5 vs ≈5.4 µM). The inconsistency is which reference each text names, not the measurement. The appropriate fix is to make the comparison explicit in both places (see Suggested correction); intent is not assessed.
- Two separate NO measurements (different cells, time points, or stimuli). No. All five locations name the same model: miRNAi arg1 knockdown in BHK cells infected with L. donovani, NO measured in Fig. 6I by Griess assay at 48 h. The Results prose and the Fig. 6I legend describe exactly the experiment the abstract summarises.
- A word slip in the abstract (e.g. "increased" was meant to be "without increased"). Possible, but not required: the digitised values show that "increased" is defensible against the infected control, so a simple reversal of the abstract is not the only reconciliation and could itself misdescribe the data relative to that control. The write-up does not assert which phrasing the authors intended.
- A typesetting or PMC conversion artifact. No. The publisher's version of record carries the identical abstract sentence and the identical body statements; the wording difference is present in both.
- The supplements resolve it. No. The four supporting figures cover polyamine content, BHK infection, the nor-NOHA arginase inhibitor, and STAT6 activation. None reports NO after arg1 knockdown, which appears only in main Fig. 6I. There is no source-data file.
Two smaller, cosmetic inconsistencies, noted for completeness; neither changes any conclusion:
- The Fig. 6I legend ends "(p<0.001)" for the one significance bracket, but the same legend's key defines ", p<0.01" (and "*, p<0.001"). The two uses of "" disagree.
- The Results prose cites "see Fig. 5B" for BHK cells being able to make NO, but Fig. 5B is the arg1/NOS2 mRNA ratio in splenic macrophages; the BHK NO data are in Fig. 6B.
Status
As of 2026-10-23. Version of record checked at the publisher (journals.plos.org, PLoS Pathogens): the abstract sentence, the Results heading, the Results prose, and the Fig. 6I legend match the PMC archive word for word, and the Discussion sentence matches. The Fig. 6I values were digitised from the publisher's Figure 6 image (image g006, size=large); the SHA-256 of the downloaded image is printed by recompute.py.txt. Supplements S1-S4 were identified from the publisher page and none covers NO after arg1 knockdown; there is no source-data file. Corrections: none found. Crossref lists no update/correction relation; src/known.py returned no PMC or Europe PMC notices; the Europe PMC record for PMID 22275864 has no comment/correction list and no erratum citing the DOI; the publisher page shows no correction notice and zero reader comments. PubPeer could not be checked (API behind Cloudflare, search page returned HTTP 403); web searches found no PubPeer thread or Retraction Watch coverage. Sources: src/show.py PMC3261917 --full (PMC-archived abstract, Results, Fig. 5/6 legends, Discussion, Methods); publisher HTML and Figure 6 image; Crossref and Europe PMC via src/known.py.
Suggested correction
Reconcile the abstract and the body by stating, in both, the comparison being made. For example, the abstract and the Fig. 6I-related text could say that after infection, arg1-knockdown cells retained their baseline NO while non-targeted control cells lost NO, so that knockdown NO was higher than in infected controls but was not induced above uninfected levels. We do not recommend simply reversing the abstract to "without increased generation of nitric oxide," because against the infected non-targeted control that wording could itself be inaccurate; the correct phrasing depends on which comparison the authors intend. The two cosmetic points above (the "**" p-value in the Fig. 6I legend, and the "see Fig. 5B" vs Fig. 6B citation) could be corrected in the same notice. A published author correction is the appropriate mechanism; no data or main conclusions need revision.