← Back to the plain-language case
Abstract says three LIPG variants lower plasma endothelial lipase; Table 6 and Results show increases
PLoS Genet (2011) · doi:10.1371/journal.pgen.1002393 · PMC3234219
Summary
The abstract says that minor alleles of a common LIPG regulatory haplotype and of the noncoding GWAS SNPs "were associated with reduced plasma levels" of endothelial lipase (EL). The paper's own Table 6, the Results and the Discussion all report the opposite for the same three variants: plasma EL goes up with the minor allele (Table 6 up arrows, P = 0.041, 1.43×10⁻³ and 3.48×10⁻³). The genotype means in Table 6 rise with each minor-allele copy, and a per-allele trend recomputed from those means is positive for all three (+45.9, +74.0 and +76.3 ng/mL). The underlying data and the paper's main conclusion are not affected. But the abstract states the direction of a key mechanistic finding backwards, and as written it does not fit the paper's own argument that these alleles lower HDL cholesterol by raising the enzyme that breaks it down.
What the paper reports
Abstract:
Minor alleles of a common regulatory haplotype and noncoding GWAS SNPs were associated with reduced plasma levels of the LIPG gene product endothelial lipase (EL), consistent with its role in HDL-C catabolism.
Results, "Functional analysis of common LIPG regulatory variants", paragraph 3:
Consistent with these findings, the minor alleles of these variants were also associated with increased plasma EL (P<0.002 and P<0.004, respectively) (Table 6). The minor allele of the -1309 A>G variant was moderately associated with increased plasma EL (P<0.05), consistent with its role in decreasing plasma HDL-C, as suggested by the GLGC and FHS association studies.
("These variants" are rs4299883 and rs2156552, named in the previous sentence. The -1309 A>G variant is rs3829632, which Table 6 uses for the combined haplotype.)
Discussion, subsection "Putative haplotype involving a causal regulatory and a nonfunctional coding variant of LIPG is associated with HDL-C levels", paragraph 4 (haplotype) and paragraph 6 (GWAS SNPs):
Minor alleles of the haplotype variants were associated with decreased HDL-C in the FHS and GLGC GWAS studies, and the minor allele of 1 variant was associated with increased plasma EL.
In addition to being associated with decreased HDL-C, the minor alleles of these variants are associated with increased plasma EL in humans.
Table 6, "Association of common LIPG variants with plasma EL concentrations in SIRCA" (column "Effect of minor allele on plasma EL (P value)"; footnote h: "Association of log-transformed mean plasma EL concentration with minor allele for each variant in SIRCA"):
Variant Genotype (N) Mean plasma EL (ng/mL, mean ± SD) Effect of minor allele on plasma EL Combined Haplotype AA (537) / AG (202) / GG (21) 483.5±342.1 / 538.4±368.9 / 540.2±367.9 ↑ (0.041) rs4939883 (C>T) CC (542) / CT (203) / TT (10) 481.8±353.5 / 538.8±342.0 / 772.9±452.8 ↑ (1.43×10⁻³) rs2156552 (T>A) TT (419) / TA (146) / AA (5) 486.2±362.1 / 545.1±346.5 / 852.1±565.7 ↑ (3.48×10⁻³) rs34474737 (229 T>G) TT (391) / TG (305) / GG (70) 520.1±338.3 / 505.7±379.3 / 417.6±302.0 ↓ (3.38×10⁻³) rs2000813 (584 C>T; Thr111Ile) CC (352) / CT (330) / TT (79) 521.2±343.5 / 492.7±362.9 / 417.4±319.9 ↓ (7.00×10⁻⁴)
A second, smaller reversal appears in the same Discussion subsection, paragraph 1:
For example, the 229 T>G (rs34474737) variant in the 5′ UTR was found to decrease LIPG promoter activity in vitro and to raise plasma EL in humans.
Compare Results, same subsection, paragraph 4:
The minor allele of the rs344747347 (229 T>G) variant was highly associated with decreased plasma EL (P<0.004), consistent with the luciferase reporter assay results.
What the paper's own numbers show
Method. From the genotype counts, means and SDs in Table 6, I fitted an additive trend, the ordinary least-squares slope of EL on minor-allele count (0, 1, 2), using the group summaries, and computed each genotype's difference from the reference homozygote. The paper's P values come from regression of log-transformed individual EL values, which are not published. So the raw-scale P values below are approximations used only to check direction, and they are not expected to match. To check that the log transform cannot reverse the sign, I also approximated each group's mean log EL under a lognormal assumption (ln mean − ½ ln(1 + CV²)) and took the trend of those. Last, I compared the N stated in the Results with the Table 6 genotype counts. recompute.py.txt prints every number below.
| Quantity | Location | Reported | Recomputed from the paper's numbers |
|---|---|---|---|
| Direction for the haplotype and GWAS-SNP minor alleles | Abstract | "reduced plasma levels" of EL | Increased for all three (rows below) |
| Combined haplotype (rs3829632 A>G), effect on EL | Table 6 | ↑ (P = 0.041) | +45.9 ng/mL per allele (raw-scale approx. P = 0.059); AG − AA = +54.9 (+11.4%), GG − AA = +56.7 (+11.7%) |
| rs4939883 (C>T), effect on EL | Table 6; Results p3 ("P<0.002") | ↑ (P = 1.43×10⁻³) | +74.0 ng/mL per allele (approx. P = 0.005); CT − CC = +57.0 (+11.8%), TT − CC = +291.1 (+60.4%) |
| rs2156552 (T>A), effect on EL | Table 6; Results p3 ("P<0.004") | ↑ (P = 3.48×10⁻³) | +76.3 ng/mL per allele (approx. P = 0.019); TA − TT = +58.9 (+12.1%), AA − TT = +365.9 (+75.3%) |
| Same three, trend of approximate mean log EL | Table 6 (footnote h: log scale) | ↑ ↑ ↑ | +0.099, +0.180, +0.184 per allele: all up |
| HDL-C per minor allele, same three variants (FHS) | Table 5 | ΔSD −0.15, −0.16, −0.18 | −1.98, −2.11, −2.38 mg/dL (1 SD = 13.2 mg/dL) |
| rs34474737 (229 T>G), effect on EL | Table 6; Results p4 vs Discussion p1 | Table/Results: ↓ (P = 3.38×10⁻³); Discussion: "raise plasma EL" | −36.8 ng/mL per allele; GG − TT = −102.5 (−19.7%); log-scale trend −0.106 |
| rs2000813 (Thr111Ile), effect on EL | Table 6; Results p4 | ↓ (P = 7.0×10⁻⁴) | −43.6 ng/mL per allele; TT − CC = −103.8 (−19.9%) |
| N genotyped for rs34474737 | Results p2 vs Table 6 | n = 761 | 391 + 305 + 70 = 766 |
| N genotyped, the other four variants | Results p2, p4 vs Table 6 | 760, 755, 570, 761 | Table 6 sums match exactly |
"Results pN" is paragraph N of the Results subsection "Functional analysis of common LIPG regulatory variants"; "Discussion p1" is paragraph 1 of the Discussion subsection quoted above.
The Table 6 means, the Table 6 arrows, the Results text and the Discussion agree that these three minor alleles go with higher EL. The abstract is the only place in the paper that says "reduced". The two variants whose minor alleles do lower EL (rs34474737 and rs2000813) are covered in separate sentences of the abstract and are not the ones this sentence names.
Two smaller labeling slips do not change any direction. The Results and Discussion call the GWAS SNP "rs4299883", while Table 6 lists "rs4939883"; the counts match (755), so they are the same data. The Results also write "rs344747347" for rs34474737.
Figure
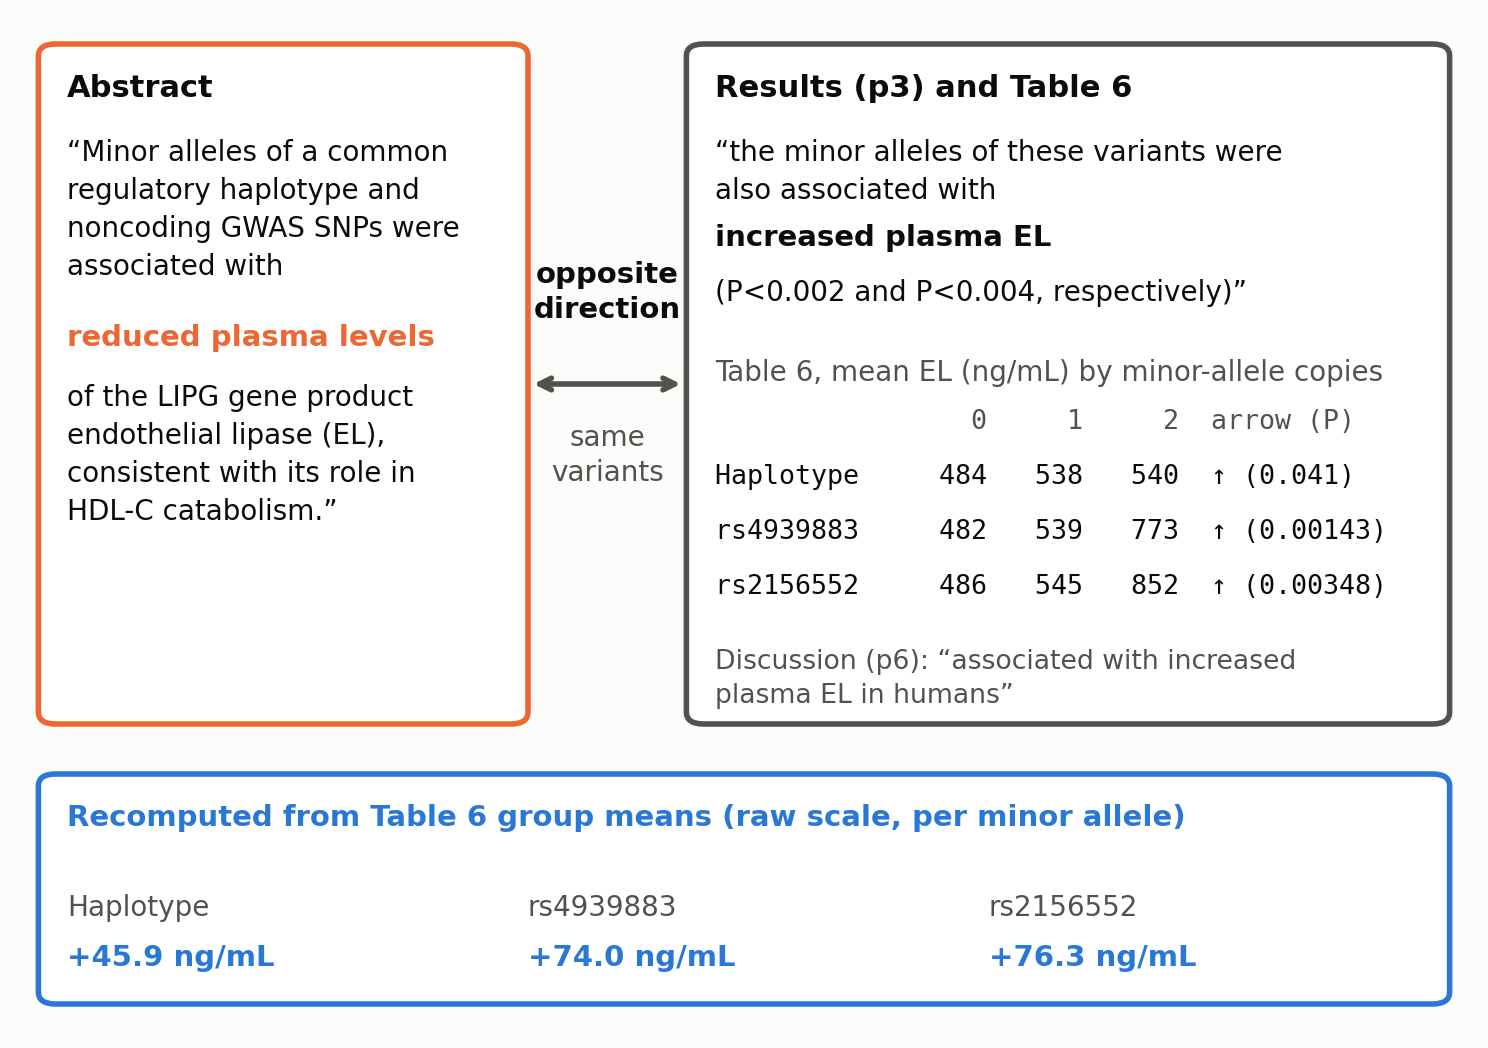
Figure 1. On the left is the abstract sentence, with its direction word ("reduced plasma levels", orange: the paper's reported claim at issue). On the right is the Results sentence on the same variants ("increased plasma EL") above the Table 6 mean EL for 0, 1 and 2 copies of the minor allele and the Table 6 arrow and P value, all copied from the paper. The lower panel (blue) gives the per-allele slope recomputed from those Table 6 group means. For all three variants the abstract's direction is opposite to the paper's own table, text and recomputed trend. Means are rounded to whole ng/mL for display; the exact values are in the table above.
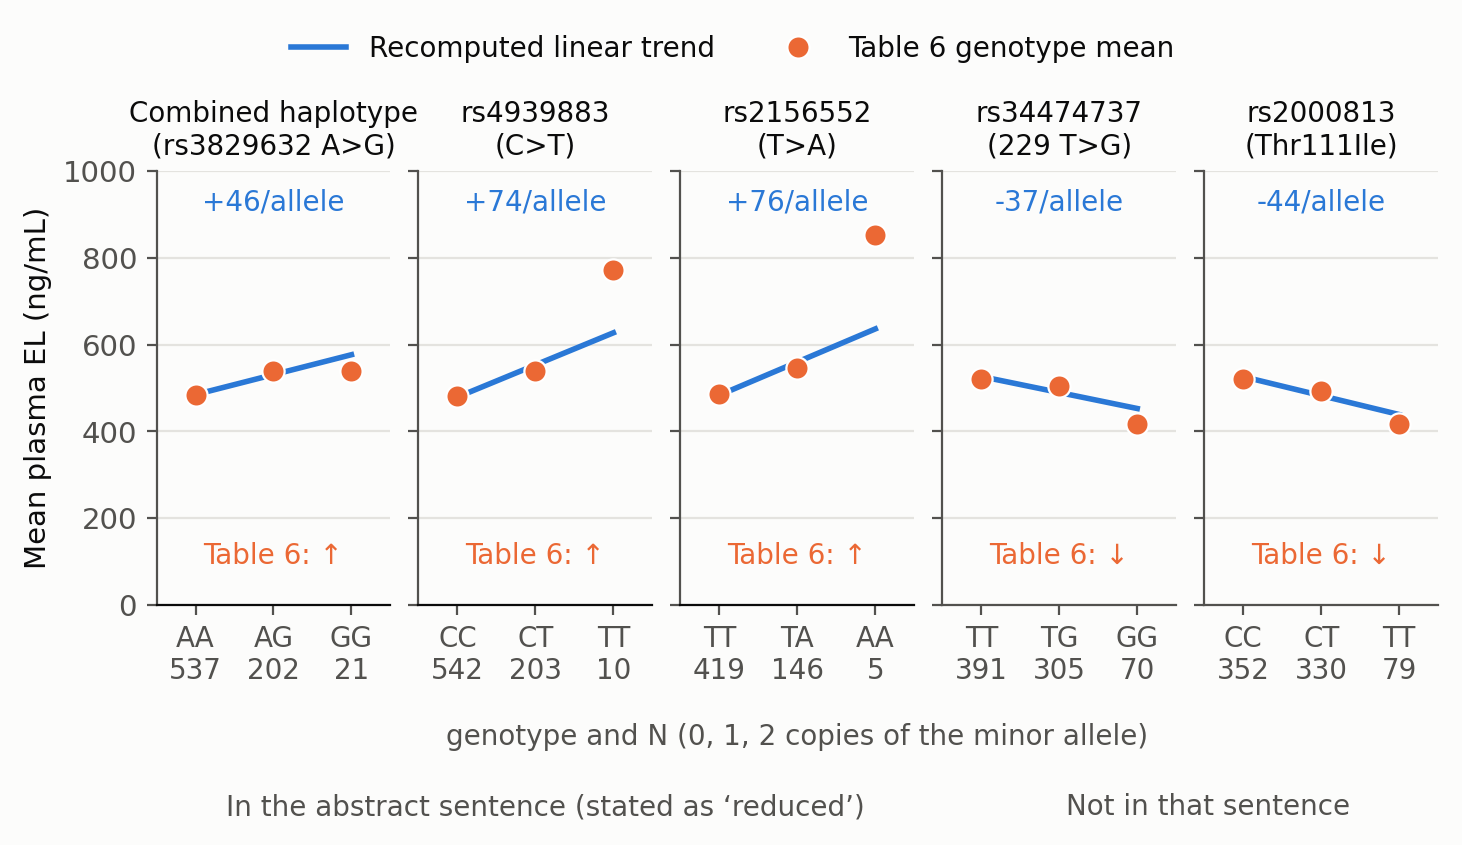
Figure 2. Table 6 mean plasma EL (orange dots) by genotype, with the number of people in each genotype under the axis, and the least-squares linear trend recomputed from those group summaries (blue line, slope printed at the top of each panel). The first three panels are the variants named in the abstract sentence, which calls their effect "reduced". In all three, EL rises with minor-allele count, as the Table 6 arrows (↑) say. The last two panels, rs34474737 and Thr111Ile, are the variants that do lower EL (↓), shown for contrast; the Discussion describes the first of these as raising EL. The rare homozygote groups are small (5 to 79 people), so their means are imprecise, but the heterozygote means alone already point the same way as the arrows. The y-axis starts at zero. The trend is on the raw scale; the paper's tests are on log EL.
Why it matters
The abstract is the part of the paper most readers and indexers use. Here it presents the EL result as a mechanism: the minor alleles change the amount of the enzyme, which explains their association with HDL-C. Read as written, the mechanism points the wrong way. Lower levels of an enzyme that breaks down HDL would predict higher HDL-C, yet the same paper reports that these minor alleles lower HDL-C (Table 5, about 2 mg/dL per allele in Framingham; GLGC P = 8.64×10⁻¹⁰ to 4.34×10⁻⁴⁹ in Table 6). The abstract's own phrase "consistent with its role in HDL-C catabolism" fits only the increased direction the body reports. A reader citing the abstract for the direction of the LIPG haplotype or of rs4939883/rs2156552 on EL levels would get the sign wrong.
The paper's main conclusion does not depend on this sentence. That conclusion is that rare and common noncoding regulatory variants contribute to the LIPG allelic spectrum, and the abstract states the rs34474737/rs2000813 linkage-disequilibrium argument correctly. So this is a wrong key result in the abstract, not a wrong headline conclusion. The Discussion's "raise plasma EL" for rs34474737 is the same kind of slip, in the opposite direction, about the variant the paper proposes as causal for the Thr111Ile signal.
Explanations considered
- "Reduced" might describe something other than EL. It cannot. The sentence names its object: "reduced plasma levels of the LIPG gene product endothelial lipase (EL)".
- The sentence might mean the variants that do lower EL. It does not. The variants with ↓ in Table 6 are rs34474737 and rs2000813, and the abstract covers them in its next two sentences. This sentence names the "common regulatory haplotype" (Table 6: rs3829632, ↑) and the "noncoding GWAS SNPs" (rs4939883/rs4299883 and rs2156552, ↑).
- The effect might be coded against the reference allele. The Table 6 column header is "Effect of minor allele on plasma EL", and the genotype means rise with minor-allele count (for example 481.8, 538.8, 772.9 ng/mL), so the direction does not depend on the coding convention.
- The log transform might reverse the sign. It cannot plausibly do so here. The approximate log-scale group means rise with minor-allele count for all three variants (trend +0.099 to +0.184 per allele), and the paper's own arrows, computed on the log scale, are ↑.
- The direction might differ between the publisher's version and the PMC copy, for instance through a lost symbol. In the publisher's PDF the arrows are set in a symbol font. Their mapping was checked against the HDL-C column and against rs34474737, whose ↓ matches the text's "decreased plasma EL"; the up arrows for these three rows are the same in the PDF, the publisher HTML, PMC and Europe PMC. The word "reduced" is in the abstract of every version, and the body text says "increased" in every version.
- The abstract might report a different analysis from Table 6. No other EL analysis appears in the paper or its supplement. Table 6 is the only source of EL by genotype, and the Methods describe a single analysis (log-transformed EL, linear regression).
None of these explains the difference. The most economical reading is a wording error in that one abstract sentence: "reduced" where the body says "increased".
Status
As of 2026-10-24:
- Version of record. The publisher HTML (journals.plos.org, reached through the DOI) and the publisher's 13-page PDF carry the same abstract wording ("reduced plasma levels"), the same Results and Discussion wording ("increased plasma EL") and the same Table 6 arrows and means as the PMC copy. Europe PMC's full-text XML agrees.
- Supplementary material. Six items (Figures S1 to S3, Tables S1 to S3) are listed: a promoter activity figure, a rare-variant luciferase figure, an LD plot, carrier characteristics, GLGC HDL-C associations for the haplotype variants, and mutagenesis primers. None reports plasma EL by genotype, so none can bear on the direction.
- Corrections. No correction, erratum, expression of concern or retraction was found. Crossref has no update relations, PMC and Europe PMC list no notices (the Europe PMC article record has no comment/correction list), and the PLOS article page shows "Reader Comments (0)".
- PubPeer. A web search found no PubPeer thread for the title or the DOI. PubPeer's own search refused automated access (HTTP 403, human verification required), so I could not query it directly.
- Sources. The article as archived in PubMed Central (PMC3234219); the publisher HTML and PDF at doi:10.1371/journal.pgen.1002393; Crossref and Europe PMC (MED/22174694) records.
Suggested correction
In the abstract, replace "were associated with reduced plasma levels of the LIPG gene product endothelial lipase (EL)" with "were associated with increased plasma levels of the LIPG gene product endothelial lipase (EL)". That matches Table 6, the Results and the Discussion, and makes the sentence's closing clause ("consistent with its role in HDL-C catabolism") follow. In the Discussion subsection "Putative haplotype involving a causal regulatory and a nonfunctional coding variant of LIPG is associated with HDL-C levels", paragraph 1, replace "and to raise plasma EL in humans" with "and to lower plasma EL in humans". Smaller fixes: in the Results, paragraph 2 of "Functional analysis of common LIPG regulatory variants", the N for rs34474737 should be 766 (391 + 305 + 70 in Table 6), not 761, unless the table counts are the ones in error. The GWAS SNP name should match between the text ("rs4299883") and Table 6 ("rs4939883"). And "rs344747347" in the Results should read rs34474737.