← Back to the plain-language case
Table 3 extrapolates VA costs with the 75% population share instead of the stated 5%
Diabetes Care (2009) · doi:10.2337/dc09-0670 · PMC2732170
Summary
The paper projects per-patient lifetime costs of Hurricane Katrina for three health care systems with the CORE Diabetes Model. It then scales them up to the diabetic adults of greater New Orleans (964,677 adults × 9.2%), with population shares stated as MCLNO 20%, VA 5% and TUHC 75%. In Table 3, the MCLNO and TUHC extrapolations reproduce exactly at their stated shares. All three VA extrapolations (direct, indirect, total), however, equal the per-patient effect times 0.75 × 964,677 × 9.2%, which is the TUHC share, not the stated 5%. The VA total is therefore 15 times too large ($260.1 million instead of $17.3 million). The population lifetime cost, the only dollar figure in the Abstract ("USD $504 million"), would be about $261.5 million (±10% range about $235–288 million) at the paper's own stated shares, not $504 million ($454–555 million).
What the paper reports
Methods, "Statistical analysis" (the extrapolation and its assumptions):
We further extrapolated the prevalence-based mean impact of an individual patient to the entire population in the greater New Orleans area using 2000 U.S. Census data.
MCLNO represented 20% of the population, VA represented 5%, and TUHC/privately insured represented 75%; the adult population affected in the greater New Orleans area was 964,677 adults; and an estimated diabetes prevalence of 9.2%
Table 3, footnotes to the "Extrapolated cost (US$)" column (they apply to every row):
Adult population (age ≥18 years): 964,677
Prevalence of diabetes in 2006 (Louisiana): 9.2%
Table 3, block headings: "MCLNO (20%)", "TUHC (75%)", "VA (5%)". Rows under the VA (5%) heading and the final row (columns: Effect | SD | P | Extrapolated cost | −10% variation | +10% variation):
Direct cost | 2,683 | 5,423 | <0.0001 | 178,587,759 | 160,728,983 | 196,446,535
Indirect cost | 1,224 | 2,850 | <0.0001 | 81,472,761 | 73,325,485 | 89,620,037
Total cost | 3,907 | 7,201 | <0.0001 | 260,060,520 | 234,054,468 | 286,066,572
Population cost | | | | 504,221,426 | 453,799,283 | 554,643,569
For comparison, the total-cost rows of the other two systems in Table 3:
Total cost | 5,243 | 8,664 | <0.0001 | 93,063,548 (MCLNO (20%) block)
Total cost | 2,270 | 6,927 | <0.0001 | 151,097,359 (TUHC (75%) block)
Abstract, "Results":
We estimate a lifetime cost of USD $504 million for the adult population affected, with the largest economic impact seen among MCLNO patients.
with the economic impact being quite substantial because of the large population size affected
Results, paragraph 3:
The largest economic impact was seen in MCLNO patients with $5,243 over their lifetime, followed by VA patients ($3,907), and privately insured TUHC patients ($2,270).
we estimated a lifetime cost of USD $504 million for the population affected by Hurricane Katrina. A 10% variation around the mean cost of each sample produced an estimate of lifetime costs of USD $454–$555 million due to the impact of Hurricane Katrina.
What the paper's own numbers show
Method. The diabetic adult population is N = 964,677 × 0.092 = 88,750.28. For each system and each cost row of Table 3, I divided the reported extrapolated cost by the per-patient effect. That gives the number of patients the effect was multiplied by, and dividing by N gives the population share actually used. I then recomputed each extrapolation at the share stated in the Methods and in the Table 3 heading, and summed the systems. I also checked that direct + indirect = total for every row, that the ±10% columns are 0.9× and 1.1× the extrapolated cost, and that the Population cost row is the sum of the three system totals. Every number below is printed by recompute.py.txt.
| Quantity | Location | Reported | Recomputed from the paper's numbers |
|---|---|---|---|
| Diabetic adults in the area | Methods; Table 3 footnotes | 964,677 adults; prevalence 9.2% | 88,750.28 |
| MCLNO patients implied (direct, indirect, total rows) | Table 3 | 62,160,699 / 3,502; 30,902,849 / 1,741; 93,063,548 / 5,243 | 17,750.06 each = 0.2000 × N (stated 20%) |
| TUHC patients implied (direct, indirect, total rows) | Table 3 | 122,475,392 / 1,840; 28,621,967 / 430; 151,097,359 / 2,270 | 66,562.71 each = 0.7500 × N (stated 75%) |
| VA patients implied (direct, indirect, total rows) | Table 3 | 178,587,759 / 2,683; 81,472,761 / 1,224; 260,060,520 / 3,907 | 66,562.71 each = 0.7500 × N (stated 5%: 4,437.51) |
| VA direct extrapolated cost | Table 3 | 178,587,759 | 11,905,851 at 5% (reported is 15.00×) |
| VA indirect extrapolated cost | Table 3 | 81,472,761 | 5,431,517 at 5% (15.00×) |
| VA total extrapolated cost | Table 3 | 260,060,520 | 17,337,368 at 5% (15.00×) |
| MCLNO and TUHC total extrapolated costs | Table 3 | 93,063,548; 151,097,359 | 93,063,548; 151,097,359 (reproduce to the dollar) |
| Population cost | Table 3; Abstract; Results | 504,221,426 ("USD $504 million") | Sum of the reported rows 504,221,427; unrounded with VA at 75% exactly 504,221,426.00. With VA at the stated 5%: 261,498,275 |
| ±10% range of the population cost | Table 3; Results | 453,799,283 – 554,643,569 ("USD $454–$555 million") | 0.9× and 1.1× of the reported total, as printed. With VA at 5%: 235,348,447 – 287,648,102 |
| Sum of population shares used | Methods vs Table 3 (implied) | 20% + 75% + 5% = 100% | 20% + 75% + 75% = 170%: 150,875 patients extrapolated vs 88,750 diabetic adults |
| Ranking of population-level costs by system | Table 3 | VA 260.1M > TUHC 151.1M > MCLNO 93.1M | With VA at 5%: TUHC 151.1M > MCLNO 93.1M > VA 17.3M |
| Overstatement of the population cost | derived | — | 504,221,426 − 261,498,275 = 242,723,151; reported / recomputed = 1.928 |
The internal arithmetic of Table 3 is otherwise consistent: per-patient direct + indirect equals total in every system (3,502 + 1,741 = 5,243; 1,840 + 430 = 2,270; 2,683 + 1,224 = 3,907), the extrapolated direct + indirect equals the extrapolated total, and every ±10% cell is 0.9× or 1.1× its extrapolated cost (to within $1). The only departure from the stated method is the multiplier in the three VA rows, and it carries through unchanged into the Population cost row, its ±10% range, the Abstract and the Results.
Figure
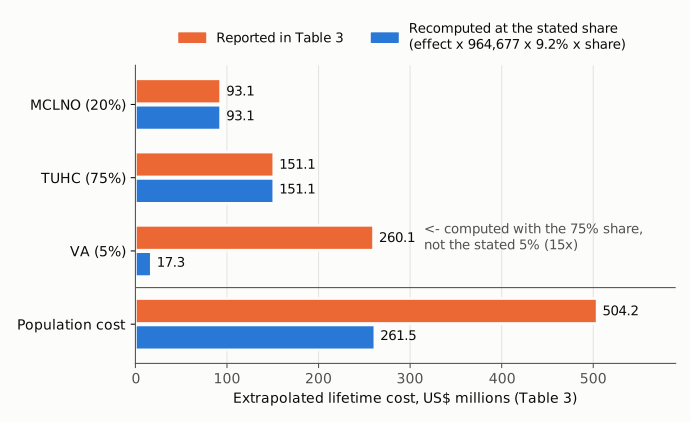
Figure 1. Extrapolated lifetime cost in US$ millions, drawn from zero on one axis. Orange bars are the values printed in Table 3. Blue bars are the per-patient effect from Table 3 multiplied by 964,677 × 9.2% × the share stated in the Methods and in the Table 3 heading (20%, 75%, 5%); the blue population bar is the sum of the three blue system bars. MCLNO and TUHC reproduce exactly. The VA row is 15 times the value at its stated 5% share, and the population cost falls from $504.2 million to $261.5 million.
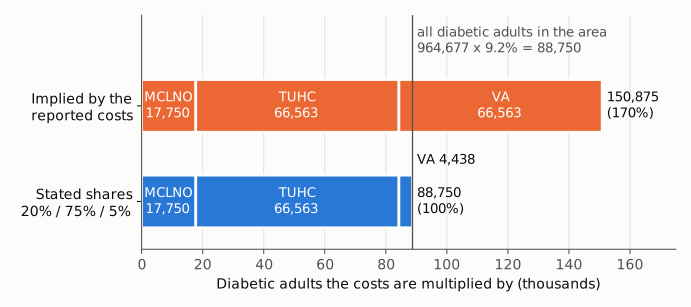
Figure 2. The number of diabetic adults each system's per-patient cost is multiplied by. The orange bar is implied by the reported Table 3 costs (reported extrapolated cost ÷ per-patient effect, identical for the direct, indirect and total rows). The blue bar uses the stated shares. The vertical line is the whole diabetic adult population (964,677 × 9.2% = 88,750). The reported extrapolation counts 150,875 patients, 170% of the population, because the VA block uses the same 66,563 patients as the TUHC block rather than 4,438.
Why it matters
The population lifetime cost is the only dollar figure in the Abstract ("We estimate a lifetime cost of USD $504 million for the adult population affected") and is repeated with its sensitivity range in the Results. At the paper's own stated assumptions it is overstated about 1.93-fold: about $261.5 million (±10%: about $235–288 million) instead of $504 million ($454–555 million). The whole overstatement comes from the VA block, whose printed contribution ($260.1 million) would be $17.3 million at 5%. A reader citing the paper's economic burden estimate would be using a figure roughly twice what the described method produces.
The error also changes the relative picture at population level. As printed, Table 3 makes the VA the largest contributor to population cost (VA $260.1M > TUHC $151.1M > MCLNO $93.1M). At the stated shares the VA is the smallest (TUHC $151.1M > MCLNO $93.1M > VA $17.3M). The Abstract's phrase "with the largest economic impact seen among MCLNO patients" holds per patient (the Results give $5,243 vs $3,907 vs $2,270) and is unaffected.
What is not affected: the clinical results (changes in A1C, blood pressure and lipids, Table 2, and their P values), the per-patient CORE Diabetes Model estimates of life expectancy, QALE and costs in Table 3, the disparity conclusions, and the direction of the economic finding. A modelled population cost of about $261 million is still large, so the qualitative statement that the economic impact was substantial stands; its magnitude is roughly halved.
Explanations considered
- The VA costs were extrapolated to a different base population (for example, all veterans). This does not account for the numbers. The Methods describe one base for all three systems (964,677 adults × 9.2%) and one set of shares. The Table 3 footnotes apply to the whole column and name no veteran-specific population. And the VA multiplier is not some other population: it equals 0.75 × 964,677 × 0.092 to the cent (66,562.71), the TUHC multiplier.
- The VA and TUHC labels or shares are swapped. This does not account for the numbers. The TUHC rows reproduce exactly at 75%; TUHC at 5% would give $10,073,157, not $151,097,359. Only the VA block departs from its stated share.
- Rounding, units or a misread digit. This does not account for the numbers. The MCLNO and TUHC rows reproduce to the dollar, the gap in the VA rows is an exact factor of 15.00 (0.75 / 0.05) in all three rows, and the same factor runs through the ±10% columns and the Population cost row. A single transcription slip would not reproduce consistently across nine VA cells.
- The 5% is the error, and 75% was intended for the VA. This does not account for the numbers either. The 5% appears in the Methods, in the Table 3 heading "VA (5%)", and is the value that makes the shares sum to 100%. With 75% for the VA, the shares sum to 170% and the extrapolation counts 150,875 patients out of 88,750 diabetic adults, which cannot be a share of one population.
- A text-conversion artifact in the archived copy. This is ruled out. The same figures appear in the live PMC page and in the Europe PMC full-text XML; all are plain positive integers with thousands separators, so no minus signs, decimals, superscripts or shifted cells are involved.
- The population total was computed separately and only the VA rows are misprinted. This does not account for the numbers. The printed Population cost (504,221,426) equals the unrounded sum of the three system totals with the VA at 75% (504,221,426.00), so the total was built from the same 75% multiplier.
Status
- Version of record. The publisher's page (doi.org/10.2337/dc09-0670, which redirects to diabetesjournals.org, Diabetes Care 32(9):1632) and the publisher PDF returned HTTP 403 or a challenge page to automated access. I checked the publisher-deposited full text instead: the live PMC article page and the Europe PMC full-text XML. Both carry the Table 3 values, the "VA (5%)" heading, the Methods share statement and the Abstract figure exactly as quoted above. Every quote in this write-up was confirmed verbatim against the PMC-archived text.
- Supplements. The Europe PMC supplementary-files archive for the article holds only the images of Figures 1–3. The JATS XML has no supplementary-material element. The CORE Diabetes Model inputs and outputs and the population calculation are not published, so they could not be checked.
- Corrections and comments. As of 2026-10-23, no correction, erratum, retraction or expression of concern was found. Crossref lists no update relations for the DOI (including the updated-by field that carries Retraction Watch data). PMC and Europe PMC list no correction notices (PMID 19542210; no comment/correction links), and the PubMed record has no CommentsCorrections or Erratum entries. Europe PMC lists one 2011 letter to the editor (PMID 22190890) that cites the paper only in passing. Earlier web searches for an erratum or a PubPeer thread found none; the PubPeer search page and API returned HTTP 403 to automated access, so PubPeer could not be checked directly. A further web search on 2026-10-23 could not be run because the session's search quota was exhausted.
- Sources. PMC: https://pmc.ncbi.nlm.nih.gov/articles/PMC2732170/ ; Europe PMC full-text XML and REST records for PMID 19542210; Crossref REST API for 10.2337/dc09-0670; PubMed E-utilities record for PMID 19542210.
Suggested correction
- Recompute the VA extrapolated costs in Table 3 at the stated 5% share: direct about $11,905,851 (−10%/+10%: $10,715,266 / $13,096,436), indirect about $5,431,517 ($4,888,366 / $5,974,669), total about $17,337,368 ($15,603,631 / $19,071,105).
- Correct the Population cost row to about $261,498,275 (−10%/+10%: $235,348,447 / $287,648,102), and the Abstract and Results figures from "USD $504 million" and "USD $454–$555 million" to about $261 million and $235–$288 million.
- If the 75% multiplier for the VA was in fact intended, state the VA base population and its source, and explain how the shares relate to a single diabetic population of 88,750 adults; otherwise, the shares as stated (20/75/5) should govern all three blocks.
- While revising Table 3, the VA QALE entry (−1.208, larger in magnitude than the VA life-expectancy change of −0.264 and unlike the other two systems, where the QALE change is smaller than the life-expectancy change) may be worth confirming against the model output. This write-up does not establish it as an error.