← Back to the plain-language case
Risk-difference confidence intervals for the primary outcome are about 23 to 31 times too narrow
JAMA Netw Open (2026) · doi:10.1001/jamanetworkopen.2026.25965 · PMC13434869
Summary
The Abstract and the Results report the trial's primary-outcome effect sizes, the absolute differences in first-pass intubation success between direct laryngoscopy (DL), Macintosh-blade video laryngoscopy (VLM) and hyperangulated video laryngoscopy (VLH), with 95% confidence intervals 0.22 to 0.33 percentage points wide, for example 4.66 (95% CI, 4.45-4.78) for VLM vs DL (written "DL vs VLM" in the paper). The paper's own Table 2 counts (625/799, 673/812, 711/812) reproduce every point estimate and, to within 0.03, the paper's own z statistics (exactly with a pooled standard error), but with the method the paper names (an unpooled z approach), they give intervals 6.9 to 7.7 points wide: 0.80 to 8.52, 5.69 to 12.99 and 1.24 to 8.12. The numbers needed to treat in the Discussion carry the same narrow intervals (VLM 21.5, reported 20.9-22.2; from the counts, 11.7-125.2). The direction and statistical significance of every comparison are unchanged, but the published intervals overstate the precision of the trial's headline result 23- to 31-fold. That matters most for VLM, where the data are compatible with a gain of anywhere from 0.8 to 8.5 points.
What the paper reports
Differences between success rates were tested applying the z test for unpooled variance and reported as absolute differences with corresponding 95% CIs.
Abstract, Main Outcomes and Measure
Unadjusted absolute risk differences for first-pass intubation success were 4.66 (95% CI, 4.45-4.78) percentage points for DL vs VLM, 9.34 (95% CI, 9.22-9.46) percentage points for DL vs VLH, and 4.68 (95% CI, 4.57-4.79) percentage points for VLM vs VLH.
Abstract, Results
In 2-sided z tests, VLM and VLH were significantly more effective in facilitating first-pass success than the DL (VLM vs DL: z = 2.36, P = .02; VLH vs DL: z = 4.98, P < .001). VLH was in turn superior to VLM (z = 2.66; P = .008). Unadjusted absolute risk differences for a successful first attempt were 4.66 (95% CI, 4.45-4.78) percentage points for DL vs VLM, 9.34 (95% CI, 9.22-9.46) percentage points for DL vs VLH, and 4.68 (95% CI, 4.57-4.79) percentage points for VLM vs VLH.
Results, Primary End Point and Crossover Between Groups
Relative risks (RRs) for successful first-attempt intubation were significantly higher for both VLM and VLH over DL (VLM vs DL: RR, 1.06 [95% CI, 1.01-1.11]; VLH vs DL: RR, 1.12 [95% CI, 1.07-1.17]) and for VLM over VLH (RR, 1.06 [95% CI, 1.01-1.10]) (eTable 2 in Supplement 1).
Results, same paragraph
Numbers needed to treat were 21.5 (95% CI, 20.9-22.2) for VLM and 10.7 (95% CI, 10.6-10.8) for VLH.
Discussion
Table 2 ("First-Pass Success Rates of Tracheal Intubations Using Different Laryngoscopes"), mITT population, row "Yes": DL 625 (78.2), VLM 673 (82.9), VLH 711 (87.6); row "Total": 799, 812, 812.
What the paper's own numbers show
Method. For each pair of arms I took the Table 2 counts and computed the risk difference, its unpooled standard error √(p₁(1−p₁)/n₁ + p₂(1−p₂)/n₂), and the 95% Wald interval RD ± 1.96·SE, which is the interval that goes with the unpooled z test the paper says it used. As checks I also computed the Newcombe (hybrid Wilson score) and Agresti–Caffo intervals, the z statistics (unpooled and pooled), the log-scale Wald interval for the relative risk, and the NNT interval obtained by inverting the risk-difference limits. Finally, I worked backwards from the reported intervals: dividing a reported width by 2 × 1.96 gives the standard error that interval implies, and dividing the reported risk difference by the reported z gives a second implied standard error. Comparisons are labelled higher-success arm vs lower-success arm (VLM vs DL, VLH vs DL, VLH vs VLM); the paper writes them as DL vs VLM, DL vs VLH and VLM vs VLH, with the same positive values. All numbers below are printed by recompute.py.txt.
| Quantity | Location | Reported | Recomputed from the paper's numbers |
|---|---|---|---|
| First-pass success, DL / VLM / VLH | Table 2 | 625/799 (78.2), 673/812 (82.9), 711/812 (87.6) | 78.22%, 82.88%, 87.56% |
| RD, VLM vs DL (pp) | Abstract; Results | 4.66 | 4.66 |
| 95% CI, VLM vs DL | Abstract; Results | 4.45 to 4.78 (width 0.33) | Wald 0.80 to 8.52 (width 7.72); Newcombe 0.79 to 8.52; Agresti–Caffo 0.79 to 8.51 |
| RD, VLH vs DL (pp) | Abstract; Results | 9.34 | 9.34 |
| 95% CI, VLH vs DL | Abstract; Results | 9.22 to 9.46 (width 0.24) | Wald 5.69 to 12.99 (width 7.31); Newcombe 5.68 to 12.99; Agresti–Caffo 5.66 to 12.97 |
| RD, VLH vs VLM (pp) | Abstract; Results | 4.68 | 4.68 |
| 95% CI, VLH vs VLM | Abstract; Results | 4.57 to 4.79 (width 0.22) | Wald 1.24 to 8.12 (width 6.89); Newcombe 1.23 to 8.13; Agresti–Caffo 1.22 to 8.12 |
| Recomputed width ÷ reported width | derived | — | 23.4×, 30.4×, 31.3× |
| z, VLM vs DL | Results | 2.36 (P = .02) | unpooled 2.37 (P = .018); pooled 2.36 |
| z, VLH vs DL | Results | 4.98 (P < .001) | unpooled 5.01 (P = 5.4 × 10⁻⁷); pooled 4.98 |
| z, VLH vs VLM | Results | 2.66 (P = .008) | unpooled 2.66 (P = .0077); pooled 2.66 |
| SE implied by reported RD ÷ reported z (pp) | derived | 1.975, 1.876, 1.759 | unpooled SE from counts 1.970, 1.864, 1.757 |
| SE implied by reported CI width ÷ 3.92 (pp) | derived | 0.084, 0.061, 0.056 | — |
| z that the reported CIs would imply | derived | — | 55.4, 152.6, 83.4 |
| Per-arm sample size at which a Wald CI would be as narrow as reported | derived | — | about 441,000, 746,000 and 796,000 (trial: 799–812) |
| Reported CI, distance below / above point | Abstract; Results | VLM vs DL −0.21 / +0.12; others −0.12 / +0.12 and −0.11 / +0.11 | Wald is symmetric (±3.86, ±3.65, ±3.44) |
| RR, VLM vs DL | Results; eTable 2 | 1.06 (1.01–1.11) | 1.060 (1.010–1.112) |
| RR, VLH vs DL | Results; eTable 2 | 1.12 (1.07–1.17) | 1.119 (1.070–1.171) |
| RR, VLH vs VLM | Results; eTable 2 | 1.06 (1.01–1.10) | 1.056 (1.014–1.100) |
| NNT, VLM vs DL | Discussion | 21.5 (20.9–22.2) | 21.5 (11.7–125.2) |
| NNT, VLH vs DL | Discussion | 10.7 (10.6–10.8) | 10.7 (7.7–17.6) |
| NNT limits from inverting the reported RD CIs | derived | — | VLM 20.9–22.5; VLH 10.6–10.8 |
Two independent routes give the same standard errors. The counts give 1.97, 1.86 and 1.76 points, and the paper's own risk differences divided by its own z statistics give 1.98, 1.88 and 1.76 points. The reported intervals imply standard errors of 0.06 to 0.08 points, about 23 to 31 times smaller. The relative-risk intervals in the same paragraph and in eTable 2 match the counts to the printed decimal, so the precision the paper reports on the ratio scale agrees with the wide intervals, not the narrow ones. The NNT intervals match the reciprocals of the reported risk-difference limits (exactly for VLH; for VLM the upper limit is 22.2 against 22.5), so they inherit the same error.
Figure
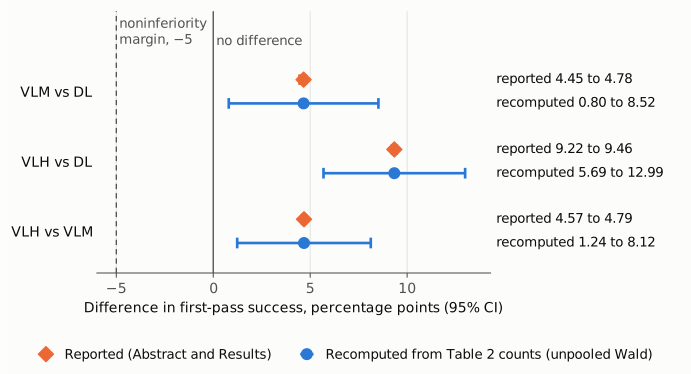
Figure 1. Each row is one of the three primary-outcome comparisons. Orange diamonds show the risk difference and 95% CI reported in the Abstract and Results. The reported intervals are narrower than the marker, so the bars are hidden behind it; the right-hand labels give their limits. Blue circles with capped bars show the 95% CI recomputed from the Table 2 counts with an unpooled Wald interval, the method the paper states. The solid gray line marks no difference and the dashed line marks the −5 point noninferiority margin. Every recomputed interval lies to the right of both, so significance and noninferiority are unchanged, but each is 23 to 31 times wider than reported. The axis is linear and includes zero.
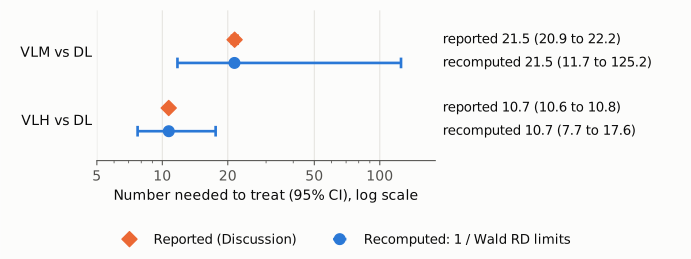
Figure 2. Numbers needed to treat with VLM or VLH instead of DL to gain one additional first-pass success, as reported in the Discussion (orange diamonds) and as obtained by inverting the recomputed Wald risk-difference limits (blue circles). The axis is logarithmic because the NNT is a reciprocal. For VLM, the interval the counts support runs from about 12 to about 125 intubations, against a reported 20.9 to 22.2.
Why it matters
- The headline result. First-pass success is the primary outcome, and these intervals are the only interval estimates for it on the absolute scale in the Abstract. As printed, they say the VLM gain is known to lie between 4.45 and 4.78 points. The data support 0.8 to 8.5 points. The lower end is a small effect.
- Clinical translation. The NNT is the quantity a clinician or guideline panel would use. The published VLM interval (20.9–22.2) pins it near 21; the counts allow anything from about 12 to about 125. For VLH the corrected range is 7.7 to 17.6 instead of 10.6 to 10.8.
- Comparison between video blades. VLH vs VLM (the paper's "VLM vs VLH") is reported as 4.68 (4.57–4.79). The corrected interval, 1.24 to 8.12, still excludes zero, but the gap between the two blades is far less precisely determined than printed.
- Reuse. Meta-analyses and decision models that take the published interval, or back-calculate a standard error from it, would give this trial roughly 550 to 980 times its correct inverse-variance weight on the risk-difference scale (the square of the width ratios).
- What does not change. The point estimates, the ordering VLH > VLM > DL, the P values, the relative risks, the noninferiority conclusions and the superiority conclusions all stand. The Conclusions do not quote the intervals.
Explanations considered
- Different analysis population. The point estimates, the z statistics and the relative-risk intervals all match the mITT counts in Table 2, so the narrow intervals refer to the same 2423 patients. The per-protocol set (eTable 1: 590/758, 663/799, 704/804) is smaller and gives similarly wide intervals: 5.14 (1.20 to 9.08), 9.73 (5.99 to 13.46) and 4.58 (1.12 to 8.05). It does not account for the numbers.
- A different interval method. Wald, Newcombe score and Agresti–Caffo intervals all come out 6.9 to 7.7 points wide. A pooled standard error changes the z values only in the second decimal. No standard interval for about 800 patients per arm is 0.2 to 0.3 points wide; that width would need roughly 440,000 to 800,000 patients per arm.
- An adjusted or model-based estimate. The intervals are labelled "unadjusted" and sit next to unadjusted point estimates that equal the raw differences. Adjustment for site or covariates would not reduce the standard error 23- to 31-fold in a trial of this size, and the site-random-effect model is reported separately (eTable 3).
- A different confidence level. The text says "95% CI" each time. At the standard errors the counts imply, intervals of the reported widths would have confidence levels of about 5% to 7%, which no report uses.
- Units (proportion vs percentage points). All three quantities are labelled percentage points, the point estimates are correct in percentage points, and the reported limits are not the Wald limits divided or multiplied by 100. Unit confusion does not reproduce them.
- Conversion or typesetting artifact. The same intervals appear in the Abstract and, word for word, in the Results, as running text rather than table cells, in the archived JATS XML and, as checked earlier in this review, in the publisher's HTML. No dropped digit, sign or decimal mark turns 0.80–8.52 into 4.45–4.78.
- An arithmetic route that would reproduce the printed limits. I did not find one that reproduces all three intervals, and the first interval is asymmetric about its point estimate (−0.21 / +0.12), which a Wald interval cannot be. The write-up therefore states only that the printed intervals are inconsistent with the paper's own counts, z statistics and stated method; it does not say how they were produced.
Two smaller observations, which do not affect the main finding:
- The Results give the same z statistics (2.36 and 4.98) for the 1-sided noninferiority tests as for the 2-sided superiority tests. A noninferiority z against the stated −5 point margin, using the unpooled standard error, would be 4.90 (VLM) and 7.69 (VLH). Both conclusions hold either way. The reported z values match the pooled-variance statistic against zero to the printed decimal (2.36, 4.98, 2.66), while the unpooled values are 2.37, 5.01 and 2.66.
- The Results describe the third relative risk as "for VLM over VLH (RR, 1.06 ...)"; 1.06 is the ratio of VLH to VLM (87.56 / 82.88 = 1.056), and eTable 2 labels it "VLH vs. VLM".
Status
As of 2026-10-23:
- Version of record. The JAMA Network Open full text (via doi.org) carries the same intervals in the Abstract and Results, the same z statistics, the same Table 2 counts and the same NNT intervals as the PubMed Central archive (checked in an earlier step of this review; the publisher PDF was not retrievable). The quotes above were checked verbatim against the PMC-archived text.
- Supplements. Supplement 1 (eMethods, eFigure, eTables 1–8) was read; it gives no confidence intervals for the risk differences. Its eTable 2 relative-risk intervals match the counts (see above), and eTable 1 gives the per-protocol counts used above. Supplement 2 (protocol and statistical analysis plan) specifies one-sided and two-sided z tests with unpooled variance and a 95% interval for the difference judged against the −5 point margin; it does not describe a method that would give narrower intervals. Supplement 4 (data sharing statement) is covered under Data below. Supplement 3 (collaborators) was not relevant.
- Corrections and retractions. Crossref, PubMed Central and Europe PMC list no correction, erratum, expression of concern or retraction for this DOI.
- PubPeer. Web searches for the title and trial name found no PubPeer entry; PubPeer's own search endpoint was not reachable from this machine (HTTP 403), so its absence is not confirmed directly.
- Related content. PubMed links a commentary on the trial (PMID 42545704); it was not reviewed here.
- Data. The registration (NCT05228288) lists IPD sharing as No, but the article's Data Sharing Statement (Supplement 4) says deidentified participant data and a data dictionary are available from the corresponding author for non-commercial use. They were not requested for this check, so the Table 2 counts are its basis; with those data the journal or the authors could recompute the intervals directly.
Sources: the article in PubMed Central (PMC13434869) and at doi:10.1001/jamanetworkopen.2026.25965; Supplements 1, 2 and 4 from the Europe PMC supplementary files; ClinicalTrials.gov NCT05228288; Crossref and Europe PMC metadata.
Suggested correction
Replace the risk-difference intervals in the Abstract and in the Results (Primary End Point and Crossover Between Groups) with intervals computed from the Table 2 counts by the stated method. With the unpooled Wald interval these are:
- VLM vs DL: 4.66 (95% CI, 0.80–8.52) percentage points
- VLH vs DL: 9.34 (95% CI, 5.69–12.99) percentage points
- VLH vs VLM: 4.68 (95% CI, 1.24–8.12) percentage points
and replace the Discussion's NNT intervals with 21.5 (95% CI, 11.7–125.2) for VLM and 10.7 (95% CI, 7.7–17.6) for VLH. If a score-based interval is preferred, the Newcombe limits (0.79–8.52, 5.68–12.99, 1.23–8.13) differ only in the second decimal. Optionally, the authors could also report the noninferiority z statistics against the −5 point margin, state whether the reported z statistics used pooled or unpooled variance, and change "for VLM over VLH" to "for VLH over VLM".