← Back to the plain-language case
Abstract reports 45.6% Faradaic efficiency at 50 mA cm⁻²; the paper's own numbers give 37%
Nat Commun (2026) · doi:10.1038/s41467-026-72987-4 · PMC13377095
Summary
The Abstract, the closing paragraph of the Introduction and the Discussion all state that the CuO/Ag catalyst, in a membrane electrode assembly (MEA) reactor, gives an ethylene oxide (EO) production rate of 345 μmol cm⁻² h⁻¹ at 50 mA cm⁻² over 60 h, "with a Faradaic efficiency of 45.6%". By the paper's own Faradaic-efficiency definition (Methods Eq. 5) and the two-electron oxidation of ethylene to EO, 345 μmol cm⁻² h⁻¹ at 50 mA cm⁻² corresponds to an FE of 36.99%. The Results text reports 37% for this condition (Fig. 5g), and the Source Data lists 37.05%. The Results give 45.6% for a different operating point: the initial MEA at 3.2 V, about 10 mA cm⁻² and 100 μmol cm⁻² h⁻¹. The headline triple therefore overstates the FE of the high-rate condition by 8.6 percentage points (23% in relative terms). No single reported condition reaches both 345 μmol cm⁻² h⁻¹ and 45.6%.
What the paper reports
All quotations were checked verbatim against the PMC-archived text with src/show.py. The publisher's version of record has the same numbers (see Status).
Abstract:
In a membrane electrode assembly reactor, a stable ethylene oxide production rate of 345 μmol·cm-2·h-1 is achieved at 50 mA·cm-2 over 60 hours, with a Faradaic efficiency of 45.6% and a selectivity of 92.8%.
Introduction, closing paragraph:
When evaluated in a membrane electrode assembly (MEA) reactor, continuous direct ethylene epoxidation is enabled, with a stable EO production rate of 345 μmol cm-2 h-1 maintained over 60 hours at 50 mA cm-2, accompanied by a Faradaic efficiency of 45.6% and selectivity of 92.8%.
Discussion:
When implemented in a membrane electrode assembly reactor, a stable EO production rate of 345 μmol cm-2 h-1 is maintained over 60 h at 50 mA cm-2, with a Faradaic efficiency of 45.6% and selectivity of 92.8%.
Results, "Performance of CuO/Ag for electrochemical epoxidation of ethylene" (the two MEA conditions):
As the voltage increases, both the EO production and the FE first rise and then decline (Fig. 5f), reaching the optimal values at 3.2 V (production: 100 μmol cm-2 h-1; FE: 45.6%). However, the initial MEA configuration operated at a low current density of approximately 10 mA cm-2.
To bridge the gap toward industrial requirements, the Al foils was employed as the current collector to upgrade the MEA design (Supplementary Fig. 22), which significantly reduced the internal resistance of MEA.
The optimized system achieved an EO production rate of 345 μmol cm-2 h-1 at a current density of 50 mA cm-2, while maintaining a relatively high FE of 37% (Fig. 5g). Moreover, the CuO/Ag catalyst can operate stably in the MEA reactor for 60 h (Fig. 5h).
Results, same paragraph (comparison with earlier work):
This approach demonstrates competitive performance to other reported direct epoxidation methods in current density, production rate, and operating duration, while maintaining high FE and EO selectivity (Supplementary Table 3).
The CuO/Ag catalyst exhibits competitive direct-epoxidation performance in the MEA reactor, surpassing previously reported results in FE, production, current density and long-term stability.
Introduction, on the field's limitation:
typically result in low FE (<40%) and limited selectivity
Methods, Product analysis (Eq. 5, FE = ni z F / (I t); the equation itself is flattened in the archived text):
z is the number of electrons involved in the reaction, F is the Faraday constant, I is the reaction current, and t is the reaction time.
Methods, Membrane electrode assembly reactor:
were used as the work electrode (2 × 2 cm2) and counter electrode, respectively.
Supplementary material (publisher ESM files, values transcribed here). Supplementary Table 2, "Faradaic efficiencies, production, and selectivity of products on CuO/Ag", lists EO production 345 μmol/h, FE 45.6% and selectivity 92.8%, together with five by-products (CO2 17.8 μmol/h, FE 7.0%; CO 8.6, 2.3%; CH3OH 16.5, 2.1%; CH2O 9.8, 1.3%; CH3CHO 7.6, 1.0%). It does not state the current density. Supplementary Table 3 lists "This work" as FE 45.6%, "EO partial current density (mA/cm2)" 50, stability 60 h, selectivity 92.8% and EO production 345.16 μmol/h. In the Source Data file, sheet "Figure 5g" lists, by current density, EO production and FE: 10 mA cm⁻², 101.45, 45.54%; 25, 198.77, 42.63%; 50, 345.16, 37.05%; 75, 303.96, 21.72%; 100, 203.61, 10.91%. Sheet "Figure 5f" lists the 3.2 V point as 101.45 and 45.54%. Sheet "Figure 5h" (the 60 h stability test) contains only cell voltage against time, with no FE.
What the paper's own numbers show
Method. For a rate r (mol cm⁻² h⁻¹) and current density j (A cm⁻²) on the same area, Methods Eq. 5 becomes FE = r z F / (3600 j), with F = 96,485 C mol⁻¹. Direct water-mediated epoxidation, C2H4 + H2O → C2H4O + 2H⁺ + 2e⁻, has z = 2. The paper does not state z in the text, but its Source Data FE values for 25, 50, 75 and 100 mA cm⁻² are reproduced by this formula with z = 2 to within 0.05 points, so z = 2 is the electron count the authors used. The same formula was then applied to the headline numbers, to the 3.2 V point and to the rows of Supplementary Table 2 (with standard electron counts for each by-product formed from ethylene). Every number below is printed by recompute.py.txt.
| Quantity | Location | Reported | Recomputed from the paper's own numbers |
|---|---|---|---|
| FE at 345 μmol cm⁻² h⁻¹, 50 mA cm⁻² (z = 2) | Abstract; Introduction; Discussion | 45.6% | 36.99% |
| FE at 345 μmol cm⁻² h⁻¹, 50 mA cm⁻², Al-foil MEA | Results text (Fig. 5g) | 37% | 36.99% (consistent) |
| FE at 345.16 μmol cm⁻² h⁻¹, 50 mA cm⁻² | Source Data, sheet Figure 5g | 37.05% | 37.00% (consistent) |
| FE at 25, 75, 100 mA cm⁻² | Source Data, sheet Figure 5g | 42.63%, 21.72%, 10.91% | 42.62%, 21.72%, 10.91% (consistent) |
| EO rate that 50 mA cm⁻² at FE 45.6% would give | derived | 345 μmol cm⁻² h⁻¹ | 425 μmol cm⁻² h⁻¹ |
| Current density at which 345 μmol cm⁻² h⁻¹ is FE 45.6% | derived | 50 mA cm⁻² | 40.6 mA cm⁻² |
| Electron count that would make the Abstract triple consistent | derived | z = 2 | 2.47 (not a valid electron count for EO) |
| Current density implied by 100 μmol cm⁻² h⁻¹ at FE 45.6% (3.2 V) | Results text (Fig. 5f) | "approximately 10 mA cm-2" | 11.8 mA cm⁻² (consistent with "approximately 10") |
| Current density implied by the 3.2 V row, 101.45 at 45.54% | Source Data, sheets Figure 5f and 5g (10 mA row) | 10 mA cm⁻² (5g row label) | 11.9 mA cm⁻²; at exactly 10 mA cm⁻² this rate would be FE 54.4% |
| Total current density implied by each row of Supplementary Table 2 (EO z = 2, CO2 6, CO 4, CH2O 2, CH3CHO 2) | Supplementary Table 2 | not stated | 40.1 to 40.9 mA cm⁻² for all five rows (EO 40.55); none fits 50 |
| FEs of the Supplementary Table 2 rows if the current density is 50 mA cm⁻² | Supplementary Table 2 | 45.6, 7.0, 2.3, 1.3, 1.0% | 37.0, 5.7, 1.8, 1.1, 0.8% |
| EO partial current density carried by 345.16 μmol cm⁻² h⁻¹ | Supplementary Table 3 | 50 mA cm⁻² ("EO partial current density") | 18.5 mA cm⁻²; a 50 mA cm⁻² EO partial current would mean 933 μmol cm⁻² h⁻¹ |
| FE if 345 were per 4 cm² electrode with j per cm² | area check | — | 9.2% (cannot give 45.6%) |
| FE overstatement at the headline condition | Abstract vs Results | 45.6% vs 37% | 8.6 points; 23.2% relative |
The 45.6% figure is reproduced at only one current density, about 11.8 mA cm⁻² (the 3.2 V point), and, within Supplementary Table 2, by a charge basis of about 40.6 mA cm⁻². It is not reproduced at the 50 mA cm⁻² that the Abstract, the Introduction and the Discussion name. Supplementary Table 2 is internally consistent: each of its five FE values for products with a net electron transfer points to the same total current density, 40.1 to 40.9 mA cm⁻², which agrees with neither 50 mA cm⁻² nor the 10 to 11.8 mA cm⁻² of the 3.2 V point. The paper does not say which current the table refers to. (For CH3OH, whose formation from ethylene involves no net electron transfer, the listed FE implies about 2 electrons per molecule at that charge basis; this row was left out of the check.)
Figure
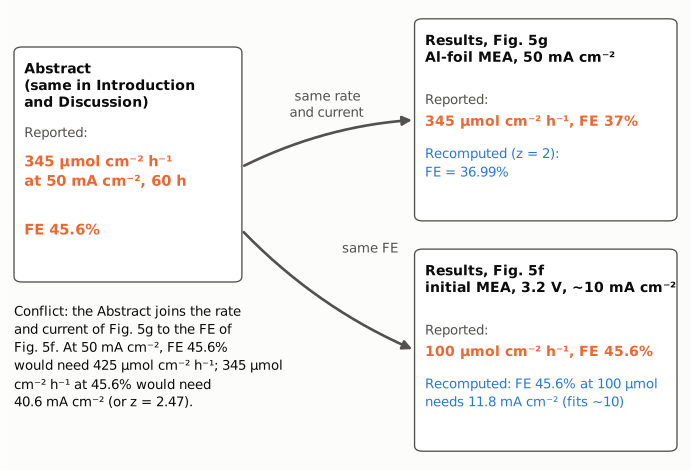
Figure 1. The two MEA conditions in the Results, and what the Abstract takes from each. Left: the headline numbers repeated in the Abstract, the Introduction and the Discussion. Right, top: the Al-foil MEA at 50 mA cm⁻² (Fig. 5g), which has the same rate and current density as the Abstract but an FE of 37%. Recomputing from 345 μmol cm⁻² h⁻¹ and 50 mA cm⁻² with z = 2 gives 36.99%. Right, bottom: the initial MEA at 3.2 V (Fig. 5f), which has the Abstract's FE of 45.6% at 100 μmol cm⁻² h⁻¹. That pair implies 11.8 mA cm⁻², consistent with the text's "approximately 10 mA cm-2". Reported values are labelled "Reported" (orange) and values recomputed from the paper's own numbers are labelled "Recomputed" (blue). The Abstract's triple would need 425 μmol cm⁻² h⁻¹ at 50 mA cm⁻², or 40.6 mA cm⁻² for 345 μmol cm⁻² h⁻¹.
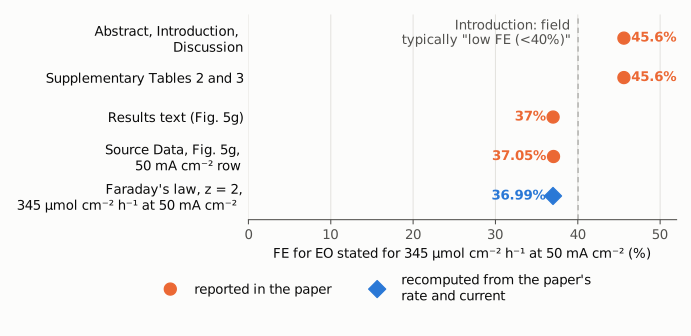
Figure 2. Faradaic efficiency stated for the 345 μmol cm⁻² h⁻¹, 50 mA cm⁻² condition, by location in the paper, on one axis starting at 0. Orange circles: values reported in the paper (Abstract, Introduction and Discussion, 45.6%; Supplementary Tables 2 and 3, 45.6%; Results text, 37%; Source Data sheet Figure 5g, 50 mA cm⁻² row, 37.05%). Blue diamond: FE recomputed from the paper's rate and current density with Faraday's law and z = 2 (36.99%). The dashed line marks the 40% level that the Introduction gives for the field ("typically result in low FE (<40%)"). The reported 45.6% lies above that line, and the recomputed value lies below it.
Why it matters
- It is the paper's headline performance number. The FE of 45.6% appears in the Abstract, in the Introduction's summary of the work and in the Discussion, each time attached to the 345 μmol cm⁻² h⁻¹, 50 mA cm⁻², 60 h condition. A reader of any of these sections would conclude that high rate, practical current density and 45.6% FE were reached together. The paper's own Results, Source Data and Faraday's law show 37% for that condition, and the 45.6% point was measured at about one-fifth of the current density and less than one-third of the rate.
- It changes the position relative to the stated limitation of the field. The Introduction describes direct epoxidation as typically limited to "low FE (<40%)". At the headline condition the recomputed and Results value, 37%, falls below that threshold, while the Abstract's 45.6% lies above it.
- It affects the comparison with earlier work. Supplementary Table 3 lists "This work" with FE 45.6% alongside 50 mA cm⁻² and 345.16 μmol/h, and the Results state that the catalyst is "surpassing previously reported results in FE, production, current density and long-term stability". A comparison of FE at the 50 mA cm⁻² operating point should use 37%. Supplementary Table 3 also labels 50 mA cm⁻² as the "EO partial current density". The EO partial current density at 345.16 μmol cm⁻² h⁻¹ is 18.5 mA cm⁻², so that column entry is not consistent with the rate either.
- The 60 h stability claim does not carry an FE. The Source Data for Fig. 5h contain cell voltage only. The paper therefore reports no FE measured over the 60 h run; the "60 h with FE 45.6%" wording has no FE data behind it in the Source Data.
- What is not affected. The mechanistic and catalyst-design conclusions (strain-gradient interface, Ag-to-CuO electron transfer, OO* stabilization) do not depend on this number. The production rate of 345 μmol cm⁻² h⁻¹ at 50 mA cm⁻² is consistent throughout. The correction changes the FE attached to the headline condition, not the direction of the findings.
- A separate observation, not part of this finding. The selectivity of 92.8% quoted with the headline triple could not be reproduced. Methods Eq. 6 defines selectivity as moles of EO over moles of all ethylene-derived products. Applied to the production row of Supplementary Table 2, it gives 85.1% (ethylene glycol, which Eq. 6 includes, is not listed and would lower this further). The table does not state the condition it refers to, so this was not pursued.
Explanations considered
- A different operating condition. This is what the numbers show, but it does not make the headline correct. The Results describe two MEA conditions. The initial MEA reached its best FE, 45.6%, at 3.2 V with 100 μmol cm⁻² h⁻¹ at about 10 mA cm⁻²; that pair is self-consistent (11.8 mA cm⁻²). The Al-foil MEA gave 345 μmol cm⁻² h⁻¹ at 50 mA cm⁻² with FE 37%. The Abstract, the Introduction and the Discussion combine the rate and current density of the second with the FE of the first.
- A different electron count or FE definition. Does not account for it. Methods Eq. 5 is the standard FE = n z F / (I t). With z = 2, the same formula reproduces the Source Data FE values at 25, 50, 75 and 100 mA cm⁻² to within 0.05 points, so the authors' own calculation uses z = 2. The headline triple would require z = 2.47, which is not an integer and not an electron count for any EO pathway.
- Area normalization (per electrode rather than per cm²). Does not account for it. The working electrode is 2 × 2 cm². If 345 were μmol h⁻¹ for the whole electrode while j is per cm², FE would be 9.2%, further from 45.6%. The Source Data and Supplementary Table 2 give production in μmol/h without "cm⁻²", but the Source Data FE values are reproduced only on a per-cm² basis.
- A peak or best value during the 60 h run. Not supported. The paper never says that 45.6% was reached during the 60 h test, and the Fig. 5h Source Data contain no FE. The Results tie 45.6% to the 3.2 V point and 37% to the 50 mA cm⁻² system.
- Supplementary Table 2 as the source of the headline. It explains where the pairing appears but does not resolve it. The table pairs 345 with 45.6% and gives no current density. Its five by-product rows with net electron transfer are mutually consistent with a total current density of 40.1 to 40.9 mA cm⁻², not with 50. At 50 mA cm⁻² the same production values give EO 37.0% and by-product FEs of 5.7, 1.8, 1.1 and 0.8%. The table is therefore not consistent with the Fig. 5g Source Data for the 50 mA cm⁻² condition. The paper gives no current density near 40 mA cm⁻² for the CuO/Ag MEA.
- Rounding or typesetting. Ruled out. The gap is 8.6 points, far beyond rounding. The numbers are identical in the PMC text, the Europe PMC XML and the publisher's HTML. The supplementary tables and the Peer Review File print 45.6 as a plain decimal, and the Source Data hold the FE values as plain numbers (37.05 and 45.54).
- A published correction. None found (see Status).
Status
- Version of record. Checked on the publisher's page (nature.com, reached through doi.org; published 11 May 2026). The Abstract, Introduction, Results and Discussion sentences quoted above have the same numbers there. The Europe PMC full-text XML and the PMC archive agree. The page carries no "Change history" section and no Author or Publisher Correction notice.
- Supplements. All five ESM files on the publisher page were opened in the version-of-record check: Supplementary Information PDF (40 pp; Supplementary Tables 2 and 3 used here), description of additional files, Supplementary Data 1 (atomic coordinates only), the Peer Review File and the Source Data workbook (sheets Figure 5f, 5g and 5h used here). For this write-up the Supplementary Information, the Source Data and the Peer Review File were downloaded again and re-read. The Peer Review File reproduces Supplementary Table 2 with the same 345 / 45.6% pairing, and the reviewer comments describe the result as "345 μmol·cm-2·h-1 over 60 hours with high Faradaic efficiency and selectivity"; the discrepancy is not discussed there.
- Corrections and comments. As of 2026-10-24:
src/known.pyfinds no Crossref update, no PMC notice and no Europe PMC notice. The Crossref record has no update-to or updated-by entries and an empty relation field. The PubPeer API returned no record (HTTP 404) for the DOI, and web searches for the title with "PubPeer", "correction" or "Retraction Watch" found no thread or notice. - Sources. PMC13377095 (via
src/show.py); https://doi.org/10.1038/s41467-026-72987-4 and its ESM files (MOESM1 Supplementary Information, MOESM4 Peer Review File, MOESM5 Source Data); Europe PMC; Crossref; PubPeer.
Suggested correction
The Abstract, the closing paragraph of the Introduction and the Discussion could attach the FE measured at the stated condition, for example:
In a membrane electrode assembly reactor, a stable ethylene oxide production rate of 345 μmol·cm-2·h-1 is achieved at 50 mA·cm-2 over 60 hours, with a Faradaic efficiency of 37%. A maximum Faradaic efficiency of 45.6% is obtained at a lower current density (about 10 mA·cm-2; 100 μmol·cm-2·h-1).
The selectivity quoted alongside (92.8%) should be checked and stated for the same operating point. Supplementary Table 2 could state the current density it refers to and, if it is meant to describe the 50 mA cm⁻² condition, be recomputed with that current (EO FE 37.0%). In Supplementary Table 3, the "This work" row could give FE 37% for the 50 mA cm⁻² / 345.16 μmol cm⁻² h⁻¹ entry, and the 50 mA cm⁻² column could be relabelled as total current density (the EO partial current density is 18.5 mA cm⁻²). The Results sentence on "surpassing previously reported results in FE" could then be checked against the corrected value.