← Back to the plain-language case
Abstract's caregiver-burden results match 14 of the 17 studies analysed in Results and Figure 3
BMJ Glob Health (2026) · doi:10.1136/bmjgh-2024-016028 · PMC13059920
Summary
This systematic review reports a DerSimonian–Laird meta-analysis of caregiver burden, measured with the Zarit Burden Interview (ZBI), which is its primary outcome. The Abstract gives a pooled mean difference (MD) of 8.7 (95% CI 4.1 to 13.3) and delivery-mode subgroups of 10 + 2 + 2 = 14 studies. The Results text and Figure 3 give MD 8.1 (4.0 to 12.2) from 17 studies, split 10 + 4 + 3, with different remote and hybrid estimates. Re-pooling the 17 study rows printed in Figure 3 reproduces the Results figures. Leaving out the three studies dated 2024–2025 reproduces every Abstract figure, and no other way of dropping three studies comes close. The Abstract therefore appears to describe an analysis made before the 2025 search update. The pooled effect stays positive and statistically significant either way, but the Abstract overstates it by 0.6 points. It also presents the hybrid subgroup as significant (5.8 to 36.0) when the paper's own analysis gives an interval that includes zero (−2.7 to 31.7).
What the paper reports
Abstract, Findings:
NPIs in LMICs have a significant improvement post intervention on caregiver burden (MD 8·7, 95% CI 4·1 to 13·3; I2=89·9%)
Interventions were delivered in person (10 studies; MD 6.4, 95% CI 1.4 to 11.5; I² = 88.7%), remotely (two studies; MD 8.0, 95% CI 1.9 to 14.1; I² = 37.5%) or as a hybrid of both (two studies; MD 20.9, 95% CI 5.8 to 36.0; I² = 90.1%), with all showing improvement in caregiver burden except for two studies.
Key-messages box ("What this study adds"). This box appears in the publisher-supplied JATS XML (Europe PMC) but not in the PMC text extract:
We identified 32 studies (35 reports), including pooled results from 14 studies (2664 participants) using the Zarit Burden Interview.
Results, "Meta-analysis of the effects of NPIs":
Of the original 21 studies assessing the effects of NPIs on caregiver burden, 17 (2011 participants) contributed data to the meta-analysis using the ZBI.
Results indicated that NPIs in LMICs have a significant improvement on caregiver burden immediately or to first follow-up post intervention (MD 8·1, 95% CI 4·0 to 12·2); although there was substantial heterogeneity between studies (I2=89·0%), there was consistency in direction of effects with 15 suggesting an improvement in the ZBI (figure 2).
Overall, 11 studies were determined to have low risk of bias or some concern of bias (MD 6.7, 95% CI 1·9 to 11·5; I2=86·6%) and high risk of bias for the remaining six
10 studies were delivered in person (MD 6·4, 95% CI 1·4 to 11·5; I2=88·7%), four remotely (MD 7.6, 95% CI 4.2 to 11.1; I2=0.0%) and three a combination of inperson and remote (MD 14.5, 95% CI -2.7 to 31.7; I2=95·8%).
There were significant differences between delivery method subgroups (p<0·001)
Methods, "Search strategy and selection criteria", and "Data synthesis and statistical methods":
Searches were conducted in April–July 2021 and updated in April–May 2023 and re-updated in June 2025.
Meta-analyses were conducted using DerSimonian-Laird random-effects models
Discussion:
There were no clear patterns of intervention effect based on delivery mode
Figure 3 ("Forest plot of Zarit Burden Interview and intervention delivery modes") is an image. It lists 17 studies: 10 in person (dated 2009–2023), 4 remote (two dated 2021 and 2022, two dated 2024) and 3 hybrid (two dated 2019, one dated 2025). It prints subgroup results of 6.4 (1.4, 11.5), I² 88.7%; 7.6 (4.2, 11.1), I² 0.0%; and 14.5 (−2.7, 31.7), I² 95.8%, with an overall result of 8.1 (4.0, 12.2), I² 89.0%, and "Heterogeneity between groups: p < 0.001". These are the Results values.
What the paper's own numbers show
Method. I transcribed the MD and 95% CI of each of the 17 study rows in Figure 3. Each study's standard error was recovered as (upper − lower) / (2 × 1.96). I then pooled the rows with the DerSimonian–Laird random-effects model that the Methods name, overall and by delivery mode. This was done twice: once with all 17 rows, and once with only the 14 rows dated 2023 or earlier, which leaves out the two remote studies dated 2024 and the hybrid study dated 2025. To test whether that subset is the only one that fits, I pooled all 18 ways of keeping the 10 in-person studies, 2 of the 4 remote studies and 2 of the 3 hybrid studies, as the Abstract's counts require. Rounding was checked by perturbing every printed input by up to ±0.05. Every number below is printed by recompute.py.txt.
| Quantity | Location | Reported | Recomputed from the paper's numbers |
|---|---|---|---|
| Studies in the delivery-mode subgroups | Abstract | 10 + 2 + 2 | sum = 14 |
| Studies in the delivery-mode subgroups | Results; Figure 3 | 10 + 4 + 3 | sum = 17, which matches the 17 studies in the ZBI meta-analysis and the 11 + 6 risk-of-bias split |
| Studies in the pooled ZBI analysis | Key-messages box | 14 studies (2664 participants) | 2664 is the participant total for all 32 included studies (Results, Discussion); the ZBI analysis is stated as 17 studies, 2011 participants |
| Overall ZBI MD, all 17 rows | Results; Figure 3 | 8.1 (4.0 to 12.2), I² 89.0% | 8.11 (4.00 to 12.22), I² 89.0% |
| Overall ZBI MD | Abstract | 8.7 (4.1 to 13.3), I² 89.9% | not reproducible from 17 rows; 14 rows dated ≤ 2023 give 8.69 (4.06 to 13.32), I² 90.0% |
| In person | Abstract; Results; Figure 3 | 10 studies, 6.4 (1.4 to 11.5), I² 88.7% (identical in both) | 6.44 (1.41 to 11.46), I² 88.7% (all 10 are dated ≤ 2023) |
| Remote | Results; Figure 3 | 4 studies, 7.6 (4.2 to 11.1), I² 0.0% | 7.62 (4.14 to 11.11), I² 0.0% |
| Remote | Abstract | 2 studies, 8.0 (1.9 to 14.1), I² 37.5% | the 2 remote studies dated 2021–2022 give 8.00 (1.94 to 14.06), I² 36.3% (34.5–37.9% under input rounding) |
| Hybrid | Results; Figure 3 | 3 studies, 14.5 (−2.7 to 31.7), I² 95.8% | 14.52 (−2.74 to 31.77), I² 95.9% |
| Hybrid | Abstract | 2 studies, 20.9 (5.8 to 36.0), I² 90.1% | the 2 hybrid studies dated 2019 give 20.95 (5.78 to 36.12), I² 90.2% |
| Other ways to keep 2 remote + 2 hybrid studies | derived | — | of 18 subsets, only the "dated ≤ 2023" one matches all nine Abstract MD/CI values (largest gap 0.12); the next best is off by 1.97 |
| Rounding range, overall MD | derived | 8.1 (Results), 8.7 (Abstract) | 8.09–8.12 for 17 rows; 8.67–8.70 for 14 rows |
| Implied two-sided P, overall | derived | CI excludes 0 in both | Abstract P = 0.00021; Results P = 0.00011 |
| Implied two-sided P, hybrid | derived | Abstract CI excludes 0; Results CI includes 0 | Abstract P = 0.0067; Results P = 0.098 |
| Between-subgroup heterogeneity | Results; Figure 3 | p < 0.001 | fixed-effect Q decomposition: Q = 15.8, df = 2, P = 0.00036, which is consistent; a test on the three random-effects subgroup means gives P = 0.67 |
| Studies with no improvement | Abstract; Results | "except for two"; 15 suggest improvement | 2 rows with MD ≤ 0 and 15 with MD > 0 among the 17; the same 2 rows are among the 14 dated ≤ 2023 |
The 17-row pooling reproduces the Results values to within the 0.1 rounding of the printed inputs. The 14-row pooling does the same for the Abstract values. The one remaining gap of about 0.1, in the upper limit of the hybrid subgroup, appears in both sets (36.12 vs 36.0 and 31.77 vs 31.7), so it comes from input rounding, not from a difference between the sets. The Abstract's numbers for distress (NPIQ, MD 4.3) and depression (BDI, MD 5.9) are the same as those in the Results. The supplementary NPIQ and BDI forest plots contain no study dated after 2019. That fits an update that added studies only to the ZBI analysis.
Side observations, separate from the main finding. (a) The archived Figure 2, captioned "Forest plot for Zarit Burden Interview main results", is a funnel plot that prints p = 0.024. It shows 18 markers, not 17. One of them lies at about MD 8.1, SE 2.1, which is where the pooled 17-study estimate falls (8.11, SE 2.10). (b) The Abstract says "Of 2369 records screened". Figure 1 gives 2365, which equals 2942 + 335 + 222 + 196 − 1330. The Results sentence "474 full-text publications were screened (350 from databases and registers and 109 identified via other methods)" has parts that sum to 459.
Figure
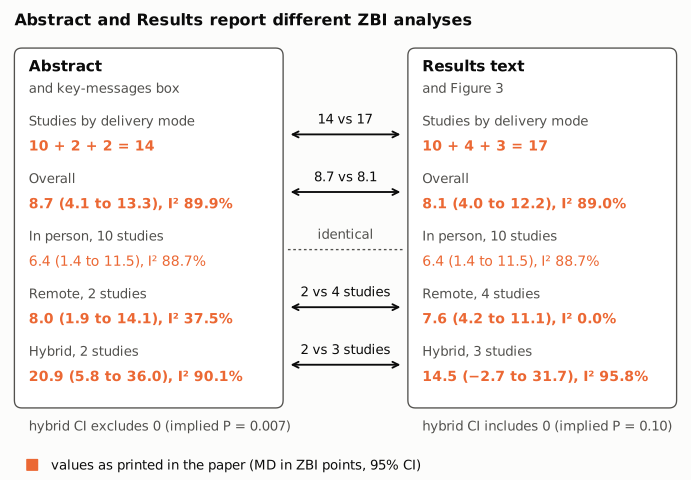
Figure 1. The caregiver-burden (ZBI) results as printed in the Abstract (left) and in the Results text and Figure 3 (right), in orange. Values are mean differences in ZBI points with 95% CIs. The key-messages box gives only the study count (14). The in-person subgroup is identical in both places. The total study count, the overall estimate and both the remote and hybrid subgroups differ, and so does the number of studies in those two subgroups. The gray notes below the panels give the two-sided P value implied by each hybrid estimate and CI, computed in recompute.py.txt. Under the Abstract's numbers the hybrid subgroup is significant; under the Results numbers it is not.
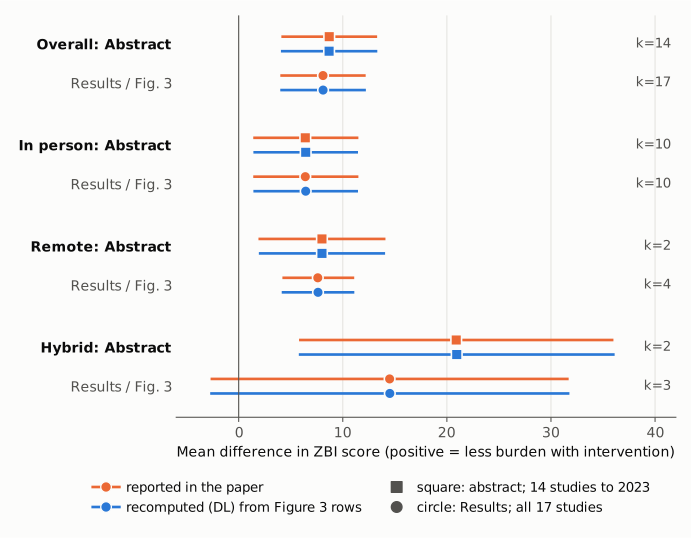
Figure 2. Pooled ZBI mean differences with 95% CIs on one axis. Orange marks the values reported in the paper and blue marks DerSimonian–Laird estimates recomputed from the 17 study rows of Figure 3. Squares pair each Abstract value with the pooled estimate from the 14 studies dated 2023 or earlier; circles pair each Results / Figure 3 value with the pooled estimate from all 17 studies. The thin vertical line marks MD = 0 (no effect), and k gives the number of studies. Each reported value sits on its recomputed counterpart, so the Abstract and the Results are each internally consistent but describe different study sets. The largest consequence is in the hybrid row, where dropping the 2025 study moves the estimate from 14.5 to 20.9 and the interval off zero.
Why it matters
Caregiver burden is the review's primary outcome, and the Abstract is the part most readers, indexers and guideline developers use. Its numbers come from a 14-study analysis, while the paper's stated analysis, its Figure 3 and its risk-of-bias subgroups use 17 studies. The headline survives: in both versions the pooled MD is positive and its CI excludes zero (implied P about 0.0002 and 0.0001). The Abstract overstates the magnitude by 0.6 ZBI points, about 7% of 8.1, and reports a slightly wider interval.
The delivery-mode results are affected more. The Abstract reports that interventions delivered as a hybrid of in-person and remote contact give the largest effect, MD 20.9, with a CI (5.8 to 36.0) that excludes zero. In the 17-study analysis the hybrid estimate is 14.5 and its CI (−2.7 to 31.7) includes zero, so this subgroup gives no statistically significant evidence of benefit on its own. A reader of the Abstract would infer that hybrid delivery is clearly effective and probably the most effective mode. That inference conflicts with the paper's own Results and with its Discussion ("no clear patterns of intervention effect based on delivery mode"). The remote subgroup also changes, from 2 studies with I² 37.5% to 4 studies with I² 0.0%. Remote delivery stays significant in both versions.
The key-messages box adds a second inconsistency. It describes the ZBI analysis as "14 studies (2664 participants)", but 2664 is the participant total for all 32 included studies, and the Results give 2011 participants for the 17-study ZBI analysis.
The between-subgroup test (p < 0.001) matches a fixed-effect (inverse-variance) decomposition of heterogeneity. A test on the random-effects subgroup means gives P = 0.67. That is a methodological point about interpretation, not an error, but readers should know that the "significant differences between delivery method subgroups" rest on the fixed-effect statistic, which the very large within-subgroup heterogeneity (I² up to 95.8%) makes hard to interpret.
Explanations considered
- Typographical error in the Abstract. This does not account for the numbers. Every value in the overall, remote and hybrid results differs (MD, both CI limits, I² and the study counts), while the in-person values agree exactly. Every differing value is reproduced, to rounding, by one coherent analysis of a specific subset of studies.
- The Abstract reports a different but deliberate analysis, such as a sensitivity analysis. Nothing in the paper describes a 14-study ZBI analysis. The only sensitivity analysis named in the Results removes studies at high risk of bias, and it splits the studies 11 + 6, not 14 + 3. The Abstract presents its numbers as the main burden result.
- The Abstract reflects the analysis before the June 2025 search update. This is consistent with all the numbers. The three studies whose removal reproduces the Abstract are exactly the three dated 2024–2025 in Figure 3. All 10 in-person studies are dated 2023 or earlier, which explains why the in-person subgroup is identical in both places. The Methods state that searches were "re-updated in June 2025". The paper does not say this happened, so it remains an inference, though it is the only one of the 18 possible subsets that fits.
- Transcription error in my reading of Figure 3. Pooling all 17 transcribed rows reproduces the published 17-study results to within 0.1 on every MD, CI limit and I², so the transcription is accurate at the precision that matters here.
- Conversion or typesetting error in the archived text. This is excluded. The PMC text, the publisher-supplied JATS XML in Europe PMC and the PubMed abstract carry the same Abstract values. Figure 3, which is the publisher's own image, carries the Results values.
- A correction already issued. This is excluded as of the date below (see Status).
Status
- Version of record. The publisher's site (doi.org redirects to gh.bmj.com/content/11/1/e016028) returned HTTP 403 to automated requests, so its HTML could not be read directly. I compared the PMC-archived text with the publisher-deposited JATS XML in Europe PMC (PMC13059920/fullTextXML) and the PubMed record (PMID 41506756; first published 2026-01-08). All three carry the Abstract and Results values quoted above. Every quotation was confirmed verbatim against the PMC text with
src/show.py, except the key-messages box, which was confirmed in the Europe PMC XML, and the contents of Figures 1–3, which were read from the published images (bmjgh-11-1-g001.jpg to g003.jpg). - Supplements. The single supplement, online supplemental file 1 (bmjgh-11-1-s001.docx, from the Europe PMC supplementary-files archive), holds search strategies, excluded full texts, study characteristics, risk-of-bias figures and the secondary-outcome forest plots (NPIQ, BDI and WHOQOL-BREF, overall and by delivery mode). It contains no ZBI forest plot, no 14-study analysis and no study-level ZBI data beyond Figure 3.
- Corrections and comments. As of 2026-10-24 I found no correction, erratum, expression of concern or retraction. Crossref lists no update relations for the DOI, and PMC and Europe PMC list no correction notices. Web searches for corrections or comments on the article found none. PubPeer refused automated access (Cloudflare challenge, HTTP 403), so it could not be checked directly.
- Sources. PMC article PMC13059920; Europe PMC full-text XML and supplementary-files archive for PMC13059920; Europe PMC/PubMed record 41506756; Crossref metadata for 10.1136/bmjgh-2024-016028; PROSPERO CRD42021283611 (cited in the paper).
Suggested correction
- Replace the Abstract's caregiver-burden results with those of the 17-study analysis reported in the Results and Figure 3: MD 8.1 (95% CI 4.0 to 12.2; I² = 89.0%). Replace the delivery-mode results with in person (10 studies; MD 6.4, 1.4 to 11.5; I² = 88.7%), remote (four studies; MD 7.6, 4.2 to 11.1; I² = 0.0%) and hybrid (three studies; MD 14.5, −2.7 to 31.7; I² = 95.8%).
- Revise any Abstract wording that implies every delivery mode produced a statistically significant improvement, since the hybrid subgroup's interval includes zero.
- In the key-messages box, change "pooled results from 14 studies (2664 participants)" to the ZBI analysis as reported in the Results, "17 studies (2011 participants)".
- Minor, in the same correction: replace the Figure 2 image or caption so that the forest plot of the main ZBI result is shown (the archived image is a funnel plot), and confirm whether the funnel plot should show 17 or 18 points. Reconcile the records-screened count (2369 in the Abstract, 2365 in Figure 1) and the full-text breakdown in the Results (350 + 109 against 474).
- Optionally, state in the Methods or the Figure 3 legend that the between-subgroup p value is the fixed-effect (inverse-variance) heterogeneity statistic.