← Back to the plain-language case
Abstract calls a MELD–referral odds ratio of 1.13 "lower referral odds"
JAMA Netw Open (2026) · doi:10.1001/jamanetworkopen.2026.2567 · PMC13003376
Summary
The study follows 325 patients hospitalized with severe alcohol-associated hepatitis at 5 US transplant centers and models referral for liver transplant evaluation. The abstract states that "higher MELD scores were associated with lower referral odds" and gives, in the same sentence, an odds ratio of 1.13 (95% CI 1.07–1.18; P < .001). An odds ratio above 1, with a confidence interval wholly above 1, means that higher MELD scores go with higher odds of referral. The Results text, Table 2, Table 1 (mean MELD 32.3 in referred vs 27.4 in non-referred patients) and Supplement 1 eTable 3 all show that direction. All the numbers agree with each other. The error is a single direction word in the abstract, which reverses the stated direction of the association for one of the study's primary outcomes.
What the paper reports
Abstract, Results:
In multivariable analysis, higher MELD scores were associated with lower referral odds (odds ratio, 1.13 [95% CI, 1.07-1.18]; P < .001).
Results, "Factors Associated With Referral for Transplant Evaluation", paragraph 1:
In multivariable logistic regression, adjusting for age, sex, race, ethnicity, educational level, insurance, marital status, living with children, MELD score, ADI, and site of care, a higher MELD score was associated with increased odds of referral (odds ratio [OR], 1.13 [95% CI, 1.07-1.18]; P < .001) (Table 2).
Table 2 (Multivariable Logistic Regression Analyses at Each Step in the Liver Transplant Cascade), referral column (n = 299):
MELD score (≤40)c | 1.13 (1.07-1.18) | <.001
Table 2, footnote c (the same definition appears in Table 1 and in the Methods):
Scores range from 6 to 40, with higher scores indicating severe liver disease.
Results, "Patient Characteristics", paragraph 3, and Table 1:
Compared with those who were not referred, patients who were referred for LT evaluation had significantly higher mean (SD) MELD scores (32.3 [7.7] vs 27.4 [6.9]; P < .001)
Discussion, paragraph 2:
As expected, the MELD score was associated with the transplant cascade.
Supplement 1, eTable 3 (referral model with an insurance-by-site interaction), row "Meld_cap": estimate 0.1432, standard error 0.0284, Wald χ² 25.4024, P < .0001.
All quotes from the article were checked verbatim against the PMC-archived text with src/show.py PMC13003376 --grep. The eTable 3 values were read from the supplement PDF.
What the paper's own numbers show
Method. In a logistic model, OR = exp(β). An OR above 1 means a positive coefficient: the odds of the outcome (here, referral) rise as the covariate rises. I converted the printed OR and CI bounds to the log scale and took the standard error from the CI width to get a z statistic. I compared the abstract's numbers with the Results text and Table 2. I computed the OR that a "lower odds" statement would need, which is the reciprocal OR per one-point lower MELD. I converted the eTable 3 coefficient to an OR with a Wald CI. As a descriptive check, I compared the Table 1 MELD means by referral status with a Welch t test, and approximated the crude logistic slope with the normal-discriminant formula (difference in means divided by pooled variance). That approximation is unadjusted and assumes normal MELD distributions with equal variances. It is used only to check the sign. All calculations are in recompute.py.txt.
| Quantity | Location | Reported | Recomputed |
|---|---|---|---|
| MELD → referral, adjusted OR | Abstract, Results | 1.13 (1.07–1.18), P < .001, described as "lower referral odds" | ln OR = +0.122; ln CI bounds +0.068 and +0.166, both > 0; z = 4.90, p ≈ 1.0 × 10⁻⁶: higher odds |
| MELD → referral, adjusted OR | Results, paragraph 1 | 1.13 (1.07–1.18), P < .001, "increased odds" | Same numbers as the abstract; direction word consistent with them |
| MELD → referral, adjusted OR | Table 2, referral column | 1.13 (1.07–1.18), P < .001 | Geometric CI midpoint 1.124, consistent with 1.13 |
| Size of the effect | derived | — | +13% odds per MELD point (CI +7% to +18%); 1.13¹⁰ = 3.39 (1.97–5.23) per 10 points |
| OR that "lower odds" would require | derived | not reported anywhere | 1/1.13 = 0.885 (0.847–0.935), per 1-point lower MELD |
| Sensitivity referral model | Supplement 1, eTable 3, Meld_cap | β = 0.1432, SE 0.0284, χ² 25.40, P < .0001 | (β/SE)² = 25.42; OR = 1.154 (1.091–1.220): higher odds |
| Mean MELD, referred vs not referred | Table 1; Results, Patient Characteristics | 32.3 (7.7) vs 27.4 (6.9), P < .001; SMD 0.68 | Difference +4.9 points; Welch t = 5.75 (df 228), p = 2.9 × 10⁻⁸; SMD 0.67 |
| Crude OR per MELD point (approximation) | from Table 1 | — | Pooled SD 7.21; slope 0.0944; OR ≈ 1.099 (> 1) |
| Referral rate | Abstract; Results | 120 (36.9%) | 120/325 = 36.9% |
Every number in the abstract sentence matches the Results and Table 2. The adjusted estimates, the sensitivity model and the descriptive data all point the same way: patients with higher MELD scores were more likely to be referred. Only the word "lower" in the abstract disagrees.
Figure
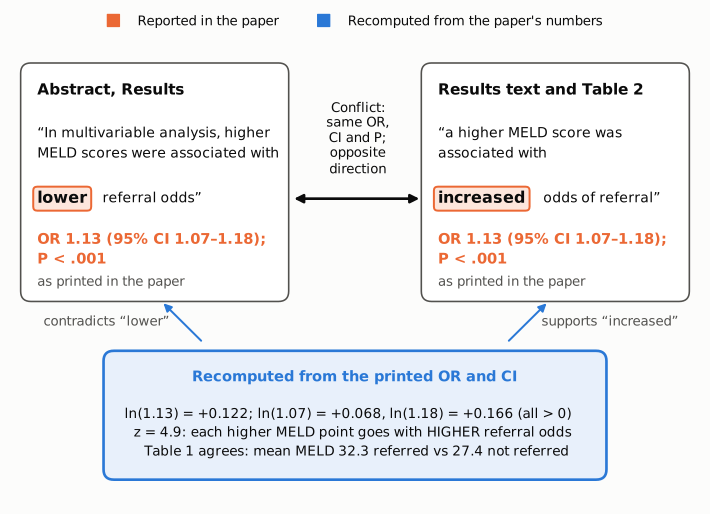
Figure 1. On the left is the abstract's sentence and on the right the Results text and Table 2 row. Both are short excerpts, and both printed estimates are shown in orange: OR 1.13 (95% CI 1.07–1.18), P < .001. The double arrow marks the conflict: the numbers are identical, but the abstract says "lower" and the Results say "increased". The blue box gives values recomputed from the printed numbers. The log OR and both log CI bounds are positive (z = 4.9), which contradicts "lower" and supports "increased". The Table 1 means (32.3 in referred vs 27.4 in non-referred patients) point the same way.
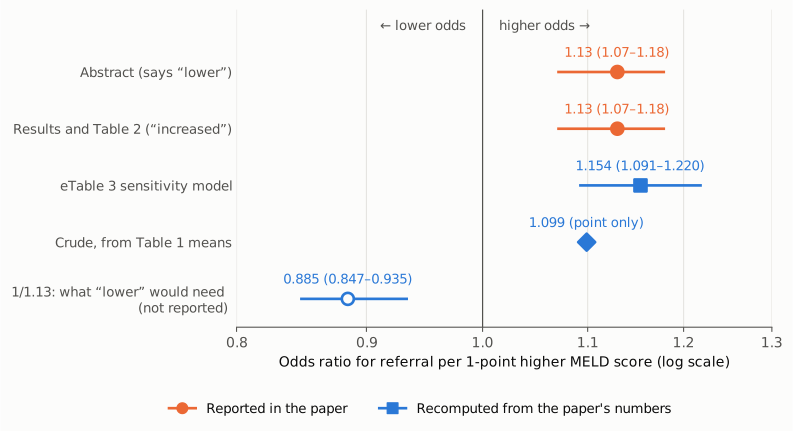
Figure 2. Odds ratios for referral per 1-point higher MELD score, on a log axis with a thin reference line at OR = 1. Orange: the estimate as printed in the abstract and in the Results and Table 2. It is identical in both places and lies entirely to the right of 1. Blue: values recomputed from the paper's own numbers. These are the eTable 3 sensitivity model, exp(0.1432 ± 1.96 × 0.0284) = 1.154 (1.091–1.220), and the crude normal-discriminant approximation from the Table 1 means (1.099, point estimate only), both above 1. The hollow blue marker is the reciprocal, 1/1.13 = 0.885 (0.847–0.935). This is the estimate a "lower referral odds" statement would require. The paper does not report it.
Why it matters
The abstract is the part of a paper that most readers see, and the part that indexing services, evidence summaries and citing articles most often take statements from. Referral is one of the study's primary outcomes, and MELD is one of its two named exposures. As printed, the abstract sentence tells a reader that sicker patients were less likely to be referred for transplant evaluation. That would be a clinically surprising result, and it is the opposite of what the paper's analysis shows. A reader who knows how to read an odds ratio can see that the sentence contradicts itself. A reader who takes in only the words, or a tool that extracts the claim from the text, would record the reversed direction.
The consequences are limited. No number is wrong, and the significance and size of the estimate are as printed: each additional MELD point goes with about 13% higher adjusted odds of referral. The title, Key Points and abstract Conclusions do not mention the MELD main effect. The Results, Table 2, Table 1, the Discussion and the supplement are all consistent with each other. The paper's headline finding is unaffected. That finding is the MELD × ADI interaction at intermediate MELD scores (P for interaction = .01) and the referral probabilities by ADI band, and neither depends on this sentence. The ADI, wait-listing, transplant and mortality results are also unaffected.
Explanations considered
- A different model or population in the abstract. The abstract says "in multivariable analysis" and gives the same OR, CI and P value as the multivariable referral model in the Results and the referral column of Table 2 (n = 299). No other referral model with a MELD estimate of 1.13 appears in the paper or the supplement. This does not explain the wording.
- MELD coded so that the OR is per lower score. The Methods, Table 1 and Table 2 (footnote c) define MELD as a score from 6 to 40 "with higher scores indicating severe liver disease". The Results describe the same OR of 1.13 as "increased odds" with higher MELD. If the abstract meant an OR per point of lower MELD, it would report 0.885 (0.847–0.935), not 1.13. This does not explain the wording.
- A different outcome (non-referral, or mortality). The sentence is explicitly about "referral odds". Under a non-referral coding the OR would be 0.885. The 180-day mortality OR for MELD (1.07 [1.03–1.12]) is also above 1 and is a different number. This does not explain the wording.
- The adjusted association could differ in sign from the crude one. It could in principle, but it does not here. The adjusted OR printed in the sentence is itself above 1. The crude data (Table 1, referred patients' MELD 4.9 points higher) and the eTable 3 sensitivity model agree in sign. This does not explain the wording.
- A text-conversion artifact. The error is a word, not a sign, superscript or decimal mark. The publisher's full-text page, the Europe PMC full-text XML and the local PMC archive all carry the same wording. This does not explain the wording.
- Rounding, one-sided tests or another stated convention. None of these can change the direction of an OR whose whole CI lies above 1, and the paper states no convention that would. This does not explain the wording.
The evidence fits a single wrong direction word in the abstract's Results paragraph. Nothing in the paper shows how it arose.
Status
As of 2026-10-23:
- Version of record. doi.org resolves to the publisher's full-text page (jamanetwork.com/journals/jamanetworkopen/fullarticle/2846714, published online March 19, 2026), which was read in this workflow. Its abstract Results has the same sentence, "higher MELD scores were associated with lower referral odds (odds ratio, 1.13 [95% CI, 1.07-1.18]; P < .001)". Its body Results has "a higher MELD score was associated with increased odds of referral". Its Table 2 MELD row gives 1.13 (1.07-1.18), P < .001. The Europe PMC full-text XML and the PMC archive have identical text. The direct PMC web page returned only a bot-verification screen.
- Supplements. The Europe PMC supplementary-files archive was downloaded. It contains Supplement 1 (jamanetwopen-e262567-s001.pdf, eTables 1–4), Supplement 2 (Data Sharing Statement) and the figure images. Supplement 1 was read. eTable 3 gives the MELD (Meld_cap) coefficient as +0.1432 (SE 0.0284, P < .0001), which is a positive association with referral. eTable 1 gives mean MELD 29.2 overall and 32.3 among referred patients. Nothing in the supplement supports "lower" odds. The supplement agrees with the body text.
- Corrections. None found.
src/known.pyreturned no Crossref updates and no PMC or Europe PMC notices. The Crossref works record has no update-to or updated-by relation. Europe PMC (PMID 41854611) lists no comment or correction. The publisher page shows no correction notice and no posted comments. A web search for the title together with "correction", "erratum" or "PubPeer" (repeated for this write-up) found no notice, and a Retraction Watch site search found nothing. - PubPeer. The PubPeer search returned HTTP 403 and could not be queried directly. Web searches found no PubPeer thread for this article.
Sources: publisher full text; PMC13003376; Europe PMC REST full-text XML and supplementary files for PMC13003376; Crossref REST API for doi:10.1001/jamanetworkopen.2026.2567.
Suggested correction
Abstract, Results. Replace "In multivariable analysis, higher MELD scores were associated with lower referral odds (odds ratio, 1.13 [95% CI, 1.07-1.18]; P < .001)." with:
In multivariable analysis, higher MELD scores were associated with higher referral odds (odds ratio, 1.13 [95% CI, 1.07-1.18]; P < .001).
The numbers stay as printed, and they match the Results text, Table 2 and Supplement 1. No other part of the paper needs to change.