← Back to the plain-language case
Table 1 crystallographic statistics do not match the AcrIIA19 structure described in the text and deposited
Commun Biol (2025) · doi:10.1038/s42003-025-09417-6 · PMC12855784
Summary
The paper's central result is a crystal structure of the anti-CRISPR protein AcrIIA19. The Results text describes it as a C222₁ crystal with four molecules in the asymmetric unit (ASU), solved at 1.98 Å, and refers the reader to Table 1 for the crystallographic statistics. Table 1 instead reports a tetragonal P4₁2₁2 cell (a = b = 64.43, c = 62.82 Å), data to 1.45 Å and one molecule in the ASU. These cannot describe the same crystal: four molecules per ASU in Table 1's cell would give a Matthews coefficient of 0.56 ų/Da, far below the physical minimum. The deposited entry the paper cites (PDB 9WA8) agrees with the text, not with Table 1, so the published data-collection and refinement statistics (resolution, R factors, completeness, B factors, atom counts, geometry) do not appear to belong to the structure the paper analyses.
What the paper reports
Results, "High-resolution structural analysis of AcrIIA19 reveals a previously uncharacterized structural fold", paragraph 1:
Following successful crystallization, the structure of AcrIIA19 was solved at a 1.98 Å resolution using MR, with the AlphaFold2 model used as a search template. Details on crystallographic and refinement statistics are listed in Table 1.
Same section, paragraph 2:
The crystal belonged to space group C2221 and contained four molecules (MolA to MolD) in the asymmetric unit (ASU; Fig. 1 C). The final structural model covered the complete AcrIIA19 (residues M1 to G115).
B-factor analysis showed relatively higher values at the N-terminus; however, the overall B-factor was low (average 48.8 Å), indicating that the structure was highly rigid (Fig. 1G).
The observation that all four molecules in the same ASU exhibited nearly identical structures served as additional indirect evidence supporting the high structural stability of AcrIIA19 (Fig. 1H).
Table 1, "Data collection and refinement statistics" (selected rows, as archived):
Space group | P 41 21 2
a, b, c (Å) | a = 64.43, b = 64.43, c = 62.82
Resolution range (Å) | 28.81–1.45
Total reflections | 616,092
Unique reflections | 24,054
Wilson B-factor (Å2) | 20.90
Rwork (%)a | 20.91 (27.03)
Rfree (%)a | 21.89 (25.83)
No. of molecules in the asymmetric unit | 1
No. of non-hydrogen atoms | 821
Macromolecules | 733
Average B-factor values (Åb) | 23.55
(Both resolution-range rows, under "Data collection" and under "Refinement", read 28.81–1.45. On the publisher's page the space group is typeset P 4₁ 2₁ 2.)
Figure 1 legend, panels C and H:
C Four molecules of AcrIIA19 in the same crystallographic asymmetry unit (ASU).
H Four superimposed AcrIIA19 structures in ASU.
Results, "AcrIIA19 forms a stable dimer in solution", paragraph 2:
The PISA complex formation score, which ranges from 0 to 1 with higher values indicating greater biological relevance, was 1.0 for both the AB and CD dimers.
Since the AB dimer and CD dimer represent essentially the same dimeric form (Fig. 2C, D), we selected the AB dimer as a representative structure to analyze in detail.
Data availability (back matter):
The coordinate and structural factors have been deposited in the Research Collaboratory for Structural Bioinformatics (RCSB) Protein Data Bank (PDB) under the PDB code 9WA8.
What the paper's own numbers show
Method. I compared the three crystallographic descriptors the text gives (space group, resolution, ASU content) with Table 1. I then tested whether each description is physically self-consistent. For each cell I computed the volume, and from it the Matthews coefficient Vm = V / (n_sym × n_mol × M), with n_sym = 8 general positions (true of both P4₁2₁2 and C222₁) and M = 14,545 Da, the chain mass of the deposited construct (residues 1–115 plus the LEHHHHHH tag). I counted the non-hydrogen atoms of a complete residue 1–115 chain from its sequence, and I enumerated the symmetry-unique reflections that Table 1's cell, space group and resolution range allow. Finally I compared both descriptions with the deposited entry PDB 9WA8 (RCSB metadata, coordinates and wwPDB validation report). Every number below is printed by recompute.py.txt.
| Quantity | Location | Reported | Recomputed |
|---|---|---|---|
| Space group | Results ¶2 vs Table 1 | C222₁ (text); P4₁2₁2 (Table 1) | Orthorhombic vs tetragonal: different crystal systems, not alternative settings. PDB 9WA8: C 2 2 2₁ |
| High-resolution limit | Results ¶1 vs Table 1 | 1.98 Å (text); 28.81–1.45 Å (Table 1, both rows) | Differ by 0.53 Å (26.8% of 1.98). PDB 9WA8: 28.95–1.98 Å |
| Molecules in the ASU | Results ¶2, Fig. 1C/H vs Table 1 | four (MolA to MolD); 1 | PDB 9WA8: 4 chains (A–D) |
| Cell | Table 1 | a = b = 64.43, c = 62.82 Å | Tetragonal metric (a = b), consistent with P4₁2₁2. V = 260,780 ų. PDB 9WA8 cell 63.41 × 98.98 × 196.66 Å, V = 1,234,301 ų (4.73× larger) |
| Matthews coefficient, Table 1 cell, 1 molecule per ASU | derived from Table 1 | — | 2.24 ų/Da (45% solvent): normal |
| Matthews coefficient, Table 1 cell, 4 molecules per ASU | derived from Table 1 + text | — | 0.56 ų/Da: impossible (protein crystals typically lie at about 1.7–3.5) |
| Matthews coefficient, deposited cell, 4 molecules per ASU | PDB 9WA8 | — | 2.65 ų/Da (54% solvent); the entry itself records 2.65 and 53.62% |
| Protein non-H atoms | Table 1 vs sequence | 733 | One complete chain M1–G115 has 946 (deposited chains C and D: 945 each), so 733 is 0.77 of one complete chain; four chains need about 3784. PDB 9WA8: 3845 |
| Unique reflections | Table 1 | 24,054 at 99.98% complete | Table 1's cell and space group allow 24,053 to 28.81–1.45 Å: consistent. The deposited cell would allow 109,549 over that range |
| Multiplicity | Table 1 | 25.6 | 616,092 / 24,054 = 25.6: consistent. PDB 9WA8 redundancy 13.2 |
| R-work / R-free | Table 1 vs PDB 9WA8 | 20.91 / 21.89% | PDB 9WA8: 23.88 / 27.5%; 42,609 reflections in refinement vs Table 1's 24,052 |
| Average B-factor | Results ¶2 vs Table 1 | 48.8 (text); 23.55, Wilson 20.90 (Table 1) | PDB 9WA8: mean atomic B 64.4, Wilson B 50.9 (validation report). The text's value is not reproduced by either source; it is far from Table 1's |
Table 1 is internally consistent: its cell is tetragonal as its space group requires, the reflection count matches the cell and resolution almost exactly, the multiplicity matches its totals, and the atom count fits a single chain. It therefore reads as a complete statistics table for a single-chain, 1.45 Å, P4₁2₁2 crystal. The Results text, the Figure 1 and 2 legends, the dimer analysis and the deposited entry all describe a different crystal: C222₁, 1.98 Å, four chains. Table 1's model is also not a complete 1–115 chain, which the text says the final model is.
Figure
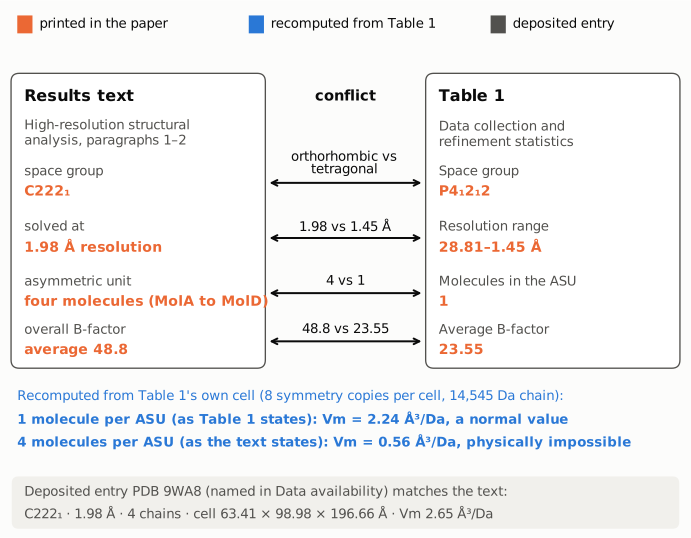
Figure 1. The four descriptors on which the Results text and Table 1 disagree, as printed (orange). Each connector names the conflict. The blue lines are recomputed from Table 1's own cell: with the eight symmetry copies of P4₁2₁2 and a 14,545 Da chain, one molecule per ASU leaves a normal 2.24 ų/Da, while the text's four molecules would leave 0.56 ų/Da, which is impossible. The gray strip gives the deposited entry PDB 9WA8 that the paper's Data availability statement names; it matches the text on space group, resolution and ASU content.
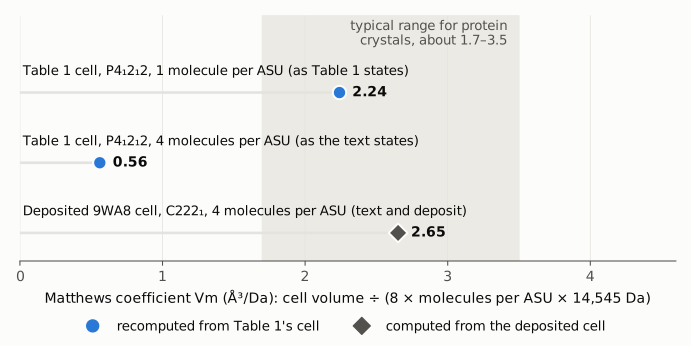
Figure 2. Matthews coefficient (unit-cell volume per dalton of protein) for each combination of cell and ASU content, on a scale starting at zero. The shaded band is the typical range for protein crystals (about 1.7–3.5 ų/Da). Table 1's cell is plausible only with the one molecule Table 1 lists. The four molecules described in the text and in Figure 1C/H fit only the deposited C222₁ cell (2.65 ų/Da, the value recorded in the PDB entry).
Why it matters
The crystal structure is the paper's headline deliverable ("Here, we present the crystal structure of AcrIIA19" in the Abstract). Table 1 is where a reader, referee or re-user checks its quality: resolution, completeness, R-work/R-free, geometry, Ramachandran statistics and B factors. As published, those numbers appear to describe a different crystal. The quality indicators a reader would rely on for the 1.98 Å, four-chain structure are therefore not in the paper. Its deposited R-free (27.5%) is noticeably higher than Table 1's 21.89%, and the deposited 1.98 Å resolution is lower than Table 1's 1.45 Å.
The four-molecule ASU is not incidental. The near-identity of the four copies is offered as evidence of rigidity (Fig. 1H), and the dimer analysis (PISA scores for the AB and CD dimers, the AB interface, Fig. 2B–H) depends on four chains in the ASU. Those analyses are consistent with the deposited entry, so they are not themselves refuted; what is missing is the correct statistical description of the data behind them.
The main biological conclusions (a new fold, a homodimer in solution by SEC-MALS, WED-domain binding and inhibition of several Cas9 orthologs) rest largely on the deposited structure and on independent biochemical data, and are not contradicted by this problem.
Two smaller inconsistencies sit in the same section and do not change any conclusion. The Figure 2C legend says "The model shows two dimers formed by MolA/MolD and MolC/MolD", which names MolD twice, while the text analyses AB and CD dimers. The B-factor is given in Å in the text and "Åb" in Table 1, where Ų is meant.
Explanations considered
- Two crystal forms, one described in the text and one in the table. This does not account for the paper as written. The text says that the statistics for the structure it describes "are listed in Table 1"; Table 1 has a single data column and no label for a second form; and only one entry (9WA8) is deposited. A second crystal form would have to be described and deposited separately.
- Resolution range vs a single high-resolution limit. This does not account for the numbers. Table 1's high-resolution limit is 1.45 Å in both its data-collection and refinement rows, not 1.98 Å. The deposited entry's limit is 1.98 Å.
- "Molecules in the ASU" counted per unique chain or per protomer. This does not account for the numbers. The row is the literal ASU content, and Table 1's cell is too small to hold four chains per ASU (Vm 0.56 ų/Da). Its 733 protein atoms are fewer than one complete chain.
- Alternative space-group setting or notation. Not possible. C222₁ is orthorhombic and P4₁2₁2 is tetragonal; no change of setting converts one into the other, and the two cells differ in volume by a factor of 4.73.
- A typing error in one or two Table 1 fields. This is unlikely. The cell, space group, reflection count, multiplicity, atom count and ASU content agree with one another for a single-chain tetragonal crystal, so many fields would have to be wrong together, consistently.
- Conversion or typesetting artifact in PMC. Excluded. The publisher's article page and its separate Table 1 page carry the same values as the PMC archive. Each value sits in its own labelled cell, with no minus signs or decimal shifts involved.
- The text, not the table, is wrong. This does not fit the deposited entry. The PDB entry cited in Data availability (primary citation: this DOI) records C 2 2 2₁, 1.98 Å, four chains and a Matthews coefficient of 2.65, which agrees with the text and the figure legends.
The paper does not say what crystal Table 1 describes. The average B-factor in the text (48.8) matches neither Table 1 (23.55) nor the deposited coordinates (mean 64.4; Wilson estimate 50.9). That leaves its source unclear.
Status
- Version of record. The publisher's article page (nature.com/articles/s42003-025-09417-6) and its Table 1 page give the same values as the PMC archive: "space group C 222 1", "four molecules (MolA to MolD)", "1.98 Å", "average 48.8 Å" in the text; "P 4 1 2 1 2", a = b = 64.43, c = 62.82, 28.81–1.45, 1 molecule in the ASU, 733 macromolecule atoms in Table 1. Every quote above was checked verbatim against the PMC-archived text. The Data availability sentence is in the article's back matter.
- Deposited data. PDB 9WA8 (deposited 2025-08-11, released 2026-07-08; primary citation this DOI): space group C 2 2 21, cell 63.41 × 98.98 × 196.66 Å, 4 polymer chains, 28.95–1.98 Å, R-work 0.2388, R-free 0.275, 42,893 reflections, redundancy 13.2, 3904 atoms (3845 protein, 59 water), Matthews coefficient 2.65. Checked through the RCSB REST API, the mmCIF header and coordinates, and the wwPDB validation report (Wilson B 50.871).
- Supplements. All publisher supplementary files were checked: the Transparent Peer Review File (the reviewers do not raise the crystallographic statistics), the Supplementary Information (uncropped gels), the description of additional files and Supplementary Data 1 (assay data only). The Reporting Summary was listed but not opened. None contains crystallographic statistics.
- Corrections and comments. As of 2026-10-23, no correction, erratum, retraction or expression of concern was found. Crossref lists no update relations, PMC and Europe PMC list no notices, and the publisher's page shows none. The PubPeer API and search page both refused automated access (HTTP 403, Cloudflare), so PubPeer could not be checked directly. A web search found no PubPeer thread or correction.
- Sources. PMC article PMC12855784; https://www.nature.com/articles/s42003-025-09417-6 and its /tables/1 page; Europe PMC full-text XML; https://www.rcsb.org/structure/9wa8; https://data.rcsb.org/rest/v1/core/entry/9WA8; https://files.rcsb.org/download/9WA8.cif; the wwPDB validation report for 9WA8; Crossref.
Suggested correction
- Replace Table 1 with the data-collection and refinement statistics for the deposited 9WA8 dataset: space group C222₁, cell 63.41 × 98.98 × 196.66 Å, 28.95–1.98 Å, four molecules per ASU, and the matching reflection counts, completeness, multiplicity, I/σ(I), R-merge, R-work/R-free, atom counts, B factors and geometry. The values should match those in the PDB entry and its validation report.
- If the present Table 1 describes another AcrIIA19 crystal (or another protein) from the same work, identify it, state its relation to the structure analysed, and deposit it, or remove it.
- Reconcile the "average 48.8" B-factor in the Results with the corrected table, and give its unit as Ų.
- Minor: correct the Figure 2C legend ("MolA/MolD and MolC/MolD") to the AB and CD dimers analysed in the text.