← Back to the plain-language case
Abstract reports a 2-point fall in IHD prevalence; the paper's Table 2 shows no change
Epidemiology (2026) · doi:10.1097/EDE.0000000000001932 · PMC12851546
Summary
The abstract and the Results say that a two-thirds cut in red and processed meat would lower the prevalence of ischemic heart disease (IHD) in 2050 by 2 percentage points (%pt), 95% prediction interval (PI) 1 to 4. They say a 100% increase in whole grain would lower it by 2%pt (PI 0 to 3). The paper's Table 2 gives an IHD difference of 0 (−1 to 1) for both scenarios, and its scenario and current-diet IHD levels are both 4%. The two figures in the text are exactly the Table 2 differences for the Healthy state (+2, 1 to 4 for meat; +2, 0 to 3 for whole grain), and the paper's own Discussion says these diets keep IHD prevalence constant. As a result, the abstract's IHD estimates, the meat estimate's PI that excludes zero, and the abstract conclusion that more plant-based diets reduce IHD prevalence are not supported by the paper's own projections. The mortality findings and the pooling method are not affected.
What the paper reports
Abstract, Results:
We estimated that a two-thirds reduction in red and processed meat consumption would decrease the prevalence of IHD by 2 (95% prediction intervals [PI] 1, 4) percentage points (%pt) in the 2017 cohort and deaths by 2%pt (95% PI 1, 4) by 2050. We estimated that a 100% increase in whole grain consumption would reduce IHD by 2%pt (95% PI 0, 3) and deaths by 2%pt (95% PI 0, 3).
Abstract, Conclusions:
Our estimates support the hypothesis that more plant-based diets reduce mortality and IHD prevalence.
Results, "Projections":
The large total scenario was associated with nearly 3 percentage points (%pt) increased prevalence of healthy individuals and over 4%pt lower deaths, but also increased the prevalence of IHD by 1 %pt. We estimate that a large reduction in meat consumption could decrease the prevalence of individuals with IHD by 2%pt (95% PI 1, 4) and reduce deaths by 2%pt (95% PI 1, 4) by 2050. For a large increase in whole grain consumption, the estimated decrease in prevalence of individuals with IHD was as high as 2%pt (95% PI 0, 3) and in deaths 2%pt (95% PI 0, 3).
Methods, "Projections" (how the IHD state and the differences are defined):
...and for IHD morbidity, those whose simulated time of IHD occurred before and death after the time point...
We compared the scenarios with the current diet scenario by calculating the differences in the state probabilities along their 95% PI.
Table 2, 2050 rows (state probability, %, with 95% PI; difference from current diets, %pt, with 95% PI):
Current diets | 2050 | Healthy 33 (32–34) | IHD 4 (3–5) | Dead w/o IHD 46 (45–47) | Dead w IHD 18 (17–19)
Large; Meat | 2050 | Healthy 35 (34–36), difference 2 (1–4) | IHD 4 (4 – 5), difference 0 (-1 to 1) | Dead w/o IHD 44 (43–45), difference -2 (-4 to 0) | Dead w IHD 17 (16–18), difference -1 (-2 to 1)
Large; Whole grain | 2050 | Healthy 34 (33–35), difference 2 (0–3) | IHD 4 (4 – 5), difference 0 (-1 to 1) | Dead w/o IHD 44 (43–46), difference -2 (-3 to 0) | Dead w IHD 17 (17–18), difference 0 (-1 to 1)
(Rows are shown here as one line per scenario; the cell values are as printed.)
Table 2 footer:
The differences of the large dietary change scenarios were calculated with respect to the current diets scenario in 2050.
Discussion, fifth paragraph:
Both reductions in red and processed meat, and increases in whole grain consumption would raise the prevalence of healthy individuals and reduce deaths by 2050, while maintaining the prevalence of IHD constant.
Conclusion:
We estimate that dietary changes, such as reducing red and processed meat consumption, and increasing whole grain intake, can improve cardiovascular health and reduce mortality. These findings align well with previous research and may have implications for policy actions.
What the paper's own numbers show
Method. I took the 2050 rows of Table 2 for current diets and for the large meat, whole grain and total scenarios. For each state I recomputed the difference from the printed levels (scenario minus current) and compared it with the printed difference. I then compared both with the figures in the text. A stated "decrease of 2 (PI 1, 4)" corresponds to a difference of −2 with PI −4 to −1 in the table's sign convention. Because the table rounds to whole percentage points, I also checked whether any unrounded values could make the text and table figures agree. I checked two other IHD definitions, the total-death figures, and the age and sex subgroups in Table 3. Every number below is printed by recompute.py.txt.
| Quantity | Location | Reported | Recomputed from the paper's own numbers |
|---|---|---|---|
| Meat: change in IHD prevalence, 2050 | Abstract; Results | decrease of 2 (95% PI 1, 4), i.e. −2 (−4 to −1) | Table 2 IHD difference 0 (−1 to 1); levels 4 − 4 = 0 |
| Meat: could rounding reconcile them? | Abstract vs Table 2 | −2 vs 0 | unrounded values that print as −2 lie in [−2.5, −1.5) and those that print as 0 lie in [−0.5, 0.5); the ranges do not overlap. The text's point estimate −2 is outside the table's PI (−1 to 1) |
| Meat: does the PI exclude zero? | Abstract; Results vs Table 2 | yes (1 to 4) | no: Table 2 IHD PI is −1 to 1 |
| Meat: change in Healthy prevalence | Table 2 | +2 (1–4) | levels 35 − 33 = +2. Same magnitude and PI as the text's IHD figure; it is the only Table 2 row that matches |
| Whole grain: change in IHD prevalence | Abstract; Results | decrease of 2 (95% PI 0, 3), i.e. −2 (−3 to 0) | Table 2 IHD difference 0 (−1 to 1); levels 4 − 4 = 0; no rounding overlap |
| Whole grain: change in Healthy prevalence | Table 2 | +2 (0–3) | same magnitude and PI as the text's IHD figure (levels 34 − 33 = +1, within rounding of +2). The Dead w/o IHD row, −2 (−3 to 0), also matches when read as a reduction |
| "Ever IHD" (IHD + dead with IHD), meat | Table 2, derived | — | 22 → 21, change −1 (summed differences 0 + (−1) = −1), not −2 |
| "Ever IHD", whole grain | Table 2, derived | — | levels 22 → 21 (−1); summed differences 0 + 0 = 0 |
| Meat: change in total deaths | Abstract; Results | decrease of 2 (95% PI 1, 4) | levels (44 + 17) − (46 + 18) = −3; summed death differences −2 + (−1) = −3; minus the change in the alive states −(2 + 0) = −2. The unrounded total lies between −3 and −2, so −2 is consistent. A PI for total deaths is not reported and cannot be derived from the two per-state PIs |
| Whole grain: change in total deaths | Abstract; Results | decrease of 2 (95% PI 0, 3) | summed death differences −2 + 0 = −2; minus alive change −(2 + 0) = −2; consistent |
| Total scenario: Healthy, IHD, deaths | Results, "Projections" | "nearly 3", IHD "by 1", deaths "over 4" | Table 2: +3 (2–4), +1 (0–2), and −6 + 2 = −4. The text matches the table here |
| Meat, IHD difference in age/sex subgroups | Table 3 | — | 0, +1, 0, +1, +1, +1; none is −2 |
| Sum of the four rounded state probabilities | Table 2, 2050 | — | 101 (current), 100 (meat), 99 (whole grain), 100 (total): the cells are rounded independently |
In both scenarios the IHD figure given in the text equals the Healthy-state difference in Table 2, in point estimate and in both PI limits. The IHD row of the same table shows no change, and so do the printed IHD levels (4% under every diet). The Discussion's statement that IHD prevalence stays constant agrees with the table. The same Results paragraph reads the total scenario's IHD row correctly (+1%pt), so the paragraph is not using a different IHD definition throughout.
Figure
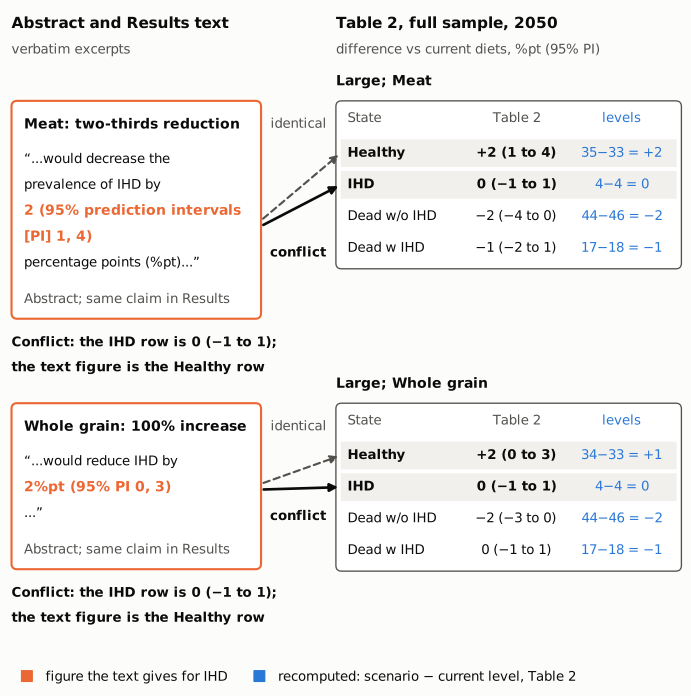
Figure 1. Left: verbatim excerpts of the IHD figures in the abstract (the Results repeat them), with the stated values in orange. Right: the 2050 rows of Table 2 for the large meat and whole grain scenarios, giving the printed difference from current diets with its 95% PI. Beside it, in blue, is the same difference recomputed from the printed state levels. The solid arrow joins each text figure to the IHD row it describes, which shows 0 (−1 to 1). The dashed arrow joins it to the Healthy row, whose difference is identical to the text figure: +2 (1 to 4) for meat and +2 (0 to 3) for whole grain. The whole-grain Healthy levels give 34 − 33 = +1, which is within rounding of the printed +2.
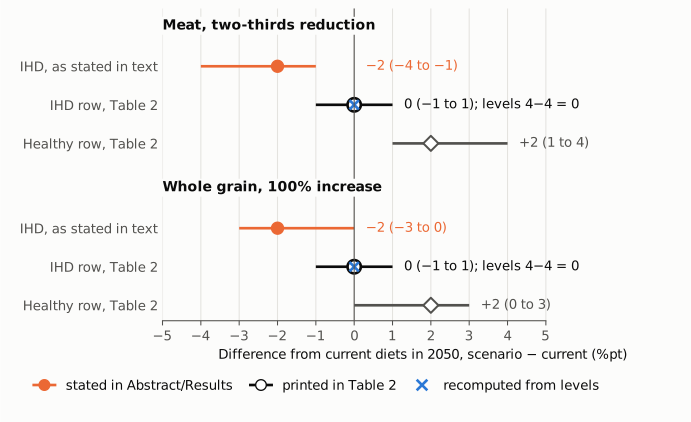
Figure 2. The differences from current diets in 2050, in percentage points (scenario − current), on one axis, with the null value 0 as a thin vertical line. Orange: the IHD change stated in the abstract and Results, converted to the table's sign convention (−2, −4 to −1 for meat; −2, −3 to 0 for whole grain). Black open circles: the IHD difference printed in Table 2, 0 (−1 to 1), with the difference recomputed from the printed levels (4 − 4 = 0) as a blue cross. Gray diamonds: the Healthy difference printed in Table 2, the mirror image of the stated IHD change. For meat, the stated interval excludes zero but the table's IHD interval does not. The stated point estimate lies outside the table's IHD interval in both scenarios.
Why it matters
- The abstract's main applied estimates do not match the paper's results. A reader of the abstract would conclude that cutting meat by two-thirds lowers IHD prevalence by 2%pt with a PI that excludes zero, and that more whole grain does the same. The paper's own projections show no change in IHD prevalence in either scenario.
- The abstract conclusion depends on it. "More plant-based diets reduce mortality and IHD prevalence" is supported for mortality by Table 2 (death states fall by about 2 to 3%pt), but not for IHD prevalence. The paper's Discussion says IHD prevalence stays constant. The Conclusion's "can improve cardiovascular health" and its reference to policy implications now rest on more people staying healthy and fewer deaths, not on lower IHD prevalence.
- The stated precision is overstated. For meat, the text's PI (1 to 4) excludes zero. The table's IHD PI (−1 to 1) does not.
- What is not affected. The pooling method, the simulation study, the hazard-ratio results, Table 2 itself, and the direction and size of the projected fall in deaths are all unaffected. The stated 2%pt fall in total deaths is consistent with the table within rounding. The stated total-death PIs cannot be checked from the published per-state intervals, so I do not count them as errors.
Explanations considered
- A different time point, population or subgroup. Not supported. The text says "by 2050" and, in the abstract, "in the 2017 cohort", which is the full-sample 2050 block of Table 2. The subgroup projections in Table 3 give meat-scenario IHD differences of 0 or +1, never −2. The supplement's eTable 8 covers subgroups only.
- A different IHD definition (for example, ever having had IHD). Not supported. Methods define the IHD state as people whose simulated IHD came before the time point and whose death came after it, which is the Table 2 "IHD" row. Counting everyone who ever had IHD (IHD plus dead with IHD) changes by −1 for meat (22 to 21), not −2 with a PI of 1 to 4. In the same paragraph, the total scenario's IHD change (+1%pt) is read from the IHD row.
- Sign convention or wording of a reduction as a positive number. Not able to explain it. The IHD difference is 0 (−1 to 1), so no change of sign gives 2 (1, 4) or 2 (0, 3).
- Rounding. Not able to explain it. A printed 0 corresponds to an unrounded value in [−0.5, 0.5) and a printed 2 to one in [1.5, 2.5). The two cannot be the same quantity, and the text's point estimate lies outside the table's own PI.
- The text figures are correct and the table's IHD row is wrong. Not supported by the paper. The printed IHD levels (4% under current diets and under both scenarios) agree with the 0 difference, and the Discussion independently says IHD prevalence stays constant. The text figures do equal, to the last digit, a different row of the same table (Healthy).
- A text-conversion artifact (for example, lost minus signs or shifted table cells). Ruled out. In the Europe PMC full-text XML the minus signs are true U+2212 characters and every value sits in its own correctly aligned table cell. The live PMC page shows the same values.
- A total-death PI that contradicts the table. An earlier screening pass suggested this, but it is not established. A PI for the sum of the two death states needs the joint bootstrap draws. It cannot be built from the two marginal PIs, and both marginal intervals including zero does not imply that the interval for their sum includes zero. Because IHD hardly changes, the total-death change is about minus the Healthy change, so a death interval similar to the Healthy interval is plausible.
- A correction already issued. None found (see Status).
Status
- Version of record. The DOI resolves to the publisher's Ovid/LWW page, which returned HTTP 402 (paywall) to automated requests, so I could not read the typeset page there. I checked the publisher-deposited full text in two other places: the live PMC article page and the Europe PMC full-text XML. Both carry the abstract and Results sentences quoted above, the same Table 2 cells, and the Discussion sentence. Crossref lists the article as Epidemiology volume 37, issue 2, pages 187–197. Every quotation here was checked verbatim against the PMC-archived text with
src/show.py. - Supplements. The supplementary digital content (https://links.lww.com/EDE/C292; a 46-page PDF with eAppendix 1–4 and eTables 1–8) was opened and its text extracted. eAppendix 3 describes the projection and bootstrap steps. eTable 8 gives 2050 projections by sex and age subgroup only. The supplement has no full-sample total-death interval and no other IHD definition that would give a 2%pt (1, 4) reduction. It confirms that the reported contrasts are differences in state probabilities, as in Table 2.
- Corrections and comments. As of 2026-10-24 I found no correction, erratum, retraction or expression of concern.
src/known.pyreturns no Crossref update relations, no PMC notices and no Europe PMC notices. The Crossref record has no update-to or updated-by field and an empty relation field, and a Crossref search for works related to this DOI returned none. The PubPeer API returned no record (HTTP 404) for the DOI, and a web search for the title together with "PubPeer" found no thread. - Sources. PMC article PMC12851546; Europe PMC full-text XML for PMC12851546; supplementary digital content at links.lww.com/EDE/C292; Crossref REST API; Europe PMC; PubPeer; https://doi.org/10.1097/EDE.0000000000001932.
Suggested correction
In the abstract, Results, replace
would decrease the prevalence of IHD by 2 (95% prediction intervals [PI] 1, 4) percentage points (%pt) in the 2017 cohort and deaths by 2%pt (95% PI 1, 4) by 2050. We estimated that a 100% increase in whole grain consumption would reduce IHD by 2%pt (95% PI 0, 3) and deaths by 2%pt (95% PI 0, 3).
with wording that follows Table 2, for example:
would increase the prevalence of healthy individuals by 2 (95% prediction intervals [PI] 1, 4) percentage points (%pt) in the 2017 cohort and reduce deaths by 2%pt by 2050, with no change in the prevalence of IHD (0%pt, 95% PI −1, 1). We estimated that a 100% increase in whole grain consumption would increase the prevalence of healthy individuals by 2%pt (95% PI 0, 3) and reduce deaths by 2%pt, with no change in IHD prevalence (0%pt, 95% PI −1, 1).
The authors would need to give the total-death PIs from their bootstrap draws. The same changes apply to the two sentences in the Results "Projections" paragraph. The abstract conclusion could read "Our estimates support the hypothesis that more plant-based diets reduce mortality", consistent with the Discussion's statement that IHD prevalence stays constant. If the authors intended a different IHD quantity for these two scenarios, the correction should define it and report its values, since none of the paper's tables contains a −2%pt IHD change.