← Back to the plain-language case
The firearm death-in-ED estimate is reported as 88.82, 83.82, 77.63 and 379.00
Lancet Reg Health Am (2026) · doi:10.1016/j.lana.2025.101343 · PMC12811418
Summary
The paper's headline mortality result is the adjusted relative risk (RR) of dying in the emergency department (ED) for women injured by firearms compared with women injured by other assault mechanisms. The same estimate appears with four different values: 88.82 ("89 times") in the abstract, 83.82 in Table 3, 77.63 in the Results text, and 379.00 in the Discussion. The paper's own numbers show where each value comes from. The abstract prints Table 3's confidence interval (72.38–97.06), and that interval is centred on 83.82, not 88.82. The Results paragraph that cites Table 3 reproduces the age 18–29 column of Table 4. The Discussion's 379.00 (266.15–539.7) is the odds ratio from the supplementary logistic regression, which the Methods say was set aside because it gave inflated estimates. All versions are far above 1, so the direction and significance of the association hold. But the size of the paper's key finding is misstated in the abstract, and the Discussion overstates it by a factor of about 4.5.
What the paper reports
The abstract:
Female patients who were injured by firearms had 89 times higher risk of dying in the ED (RR = 88.82; 95% CI 6 = 72.38–97.06) compared to female patients injured by non-firearm injury mechanisms.
— Abstract, Findings (the stray "6" is in the source, and in the PubMed abstract too)
Table 3, model (b), "firearm-related assault compared to all other adult female assault patients". The columns are all-assault RR, its CI, firearm RR, its CI:
In ED | 1.04 | 0.89, 1.21 | 83.82 | 72.38, 97.06
— Table 3, Death: In ED row
The Results paragraph on the firearm model, which ends by citing Table 3:
Female patients with firearm injuries had far greater risk of dying in the ED (RR = 77.63; 95% CI 62.60–96.27) or hospital (RR = 3.29; 95% CI 2.57–4.22). They also had substantially higher risk of being admitted to the hospital (RR = 19.94; 95% CI 18.04–22.02). Compared to White female patients with firearm injuries, Black (RR = 4.15; 95% CI 3.61–4.78), Hispanic (RR = 1.77; 95% CI 1.48–2.13) and Other (RR = 2.01; 95% CI 1.51–2.68) patients had greater risk of firearm injury (Table 3).
— Results, paragraph 4 ("In the firearm injury model for women…")
Table 4 gives the age-stratified models. In the In ED row, the second estimate is the 18–29 y firearm model:
In ED | 3.14 (2.45, 4.02) | 77.63 (62.60, 96.27)
— Table 4, Death: In ED row (first two of eight columns)
The same 18–29 y value restated:
There appeared to be a bimodal distribution of increased mortality for firearm injuries for 18–29 years (death in ED: RR = 77.65; 95% CI 62.60–96.27, death in hospital: RR = 3.29; 95% CI 2.57–4.22)
— Results, paragraph 5
The Discussion:
Female patients who were injured by firearms specifically had 379.00 (95% CI 266.15–539.7) times higher risk of dying in the ED compared to all-cause female assault patients.
— Discussion, paragraph 1
On the logistic model:
We initially employed a survey-weighted binary logistic regression model. However, several results were affected by sparse-data bias and quasi-complete separation, leading to inflated odds ratio estimates.
The results from the initial survey-weighted logistic regression are provided in the Supplement for comparison.
— Methods, statistical analysis
The initial logistic regression was affected by sparse-data bias and quasi-complete separation, which inflated the odds ratios for several variables.
— Discussion, final paragraph
Supplementary Table 1 ("Adjusted Logistic Regression Model…", file mmc1.docx), firearm model, Death row: "ED | 1.04 | 0.89 – 1.21 | 379.00 | 266.15 – 539.71".
Every quotation from the article was checked character for character against the text archived in PubMed Central (src/show.py PMC12811418). Each occurs exactly once, and recompute.py.txt reruns that check. The supplementary row is transcribed from the publisher's mmc1.docx. Paragraphs are numbered from 1 under the Results and Discussion headings.
What the paper's own numbers show
Method. The model is a survey-weighted Poisson GLM with a log link (Methods; Table 3 caption), so its 95% intervals are Wald intervals on the log scale: L = exp(b − 1.96·SE) and U = exp(b + 1.96·SE). The point estimate that belongs with a printed interval is therefore its geometric midpoint, exp(b) = √(L·U). Comparing each printed value with √(L·U), and then searching the paper's tables for the matching cell, shows which numbers belong together. No outside data are used. The underlying NEDS microdata are licensed and not public, so the model itself cannot be refitted. The check is limited to the internal consistency of the reported values.
| Quantity | Location | Reported | Recomputed from the paper's own numbers |
|---|---|---|---|
| Firearm vs other assault, death in ED, all ages | Table 3 (b) | 83.82 (72.38, 97.06) | √(72.38 × 97.06) = 83.816 → 83.82. Consistent (log distance 0.147 to each limit) |
| Same estimate | Abstract | "89 times", RR = 88.82 (72.38–97.06) | Same CI as Table 3, whose centre is 83.82. 88.82 is off-centre (log distance 0.205 to L, 0.089 to U), 0.77 SE above the centre, and 6.0% above Table 3. "89" is round(88.82); round(83.82) = 84 |
| Same estimate, "firearm injury model … (Table 3)" | Results para 4 | 77.63 (62.60–96.27) | √(62.60 × 96.27) = 77.631. Identical to Table 4, 18–29 y firearm column; 7.4% below Table 3 |
| Same paragraph: death in hospital, admitted, Black, Hispanic, Other | Results para 4 | 3.29 (2.57–4.22); 19.94 (18.04–22.02); 4.15 (3.61–4.78); 1.77 (1.48–2.13); 2.01 (1.51–2.68) | Table 3 gives 3.34 (2.79, 4.00); 16.50 (15.29, 17.80); 4.12 (3.75, 4.52); 1.87 (1.64, 2.12); 1.90 (1.55, 2.33); none of these 15 numbers agree. Table 4 18–29 y gives 3.29 (2.57, 4.22); 19.94 (18.05, 22.02); 4.16 (3.61, 4.78); 1.78 (1.48, 2.14); 2.01 (1.51, 2.68). Across all six outcome and race rows, 14 of 18 numbers are identical to Table 4 18–29 y and the other 4 are within 0.01 |
| Same paragraph: age | Results para 4 | 0.98 (0.97–0.98) | Matches Table 3 (0.98, 0.97–0.98), not Table 4 18–29 y (0.96, 0.95–0.98). This is the only row of the paragraph that comes from Table 3 |
| 18–29 y firearm, death in ED | Results para 5 | 77.65 (62.60–96.27) | Table 4 gives 77.63; √(L·U) = 77.631 |
| Firearm death in ED, "times higher risk" | Discussion para 1 | 379.00 (266.15–539.7) | √(266.15 × 539.7) = 379.00. Equal to Suppl. Table 1 logistic adjusted odds ratio 379.00 (266.15–539.71). It appears in no RR table and is 4.52 × Table 3's RR |
| Firearm model, Black vs White | Discussion para 1, "nearly five times" | — | Table 3 RR = 4.12 (3.75, 4.52), as in the abstract. Suppl. Table 1 OR = 4.74 (4.29–5.24). "Nearly five" fits the odds ratio |
| All-assault model, Native American vs White | Abstract | RR = 2.81 (2.67–2.97), no age group stated | Equal to Table 4, 18–29 y column (stated as such in Results para 7). The all-ages Table 3 value is 2.68 (2.60, 2.77) |
| All-assault model, 18–29 y, death in ED | Results para 5 | 3.14 (2.45–4.20) | Table 4 gives 3.14 (2.45, 4.02). √(2.45 × 4.02) = 3.138 fits 3.14, while √(2.45 × 4.20) = 3.208 does not, so 4.20 is a transposition of 4.02 |
So the one value that is internally consistent is Table 3's 83.82 (72.38–97.06). The abstract pairs a different point estimate with Table 3's interval. The two differ in a single digit (88.82 vs 83.82), which looks like a typographical slip. The Results paragraph on the firearm model reports the 18–29 y stratum of Table 4 instead of the all-ages model it cites. The Discussion reports the logistic odds ratio as a risk. The last three rows of the table are minor slips of the same kind and are listed for completeness.
Figure
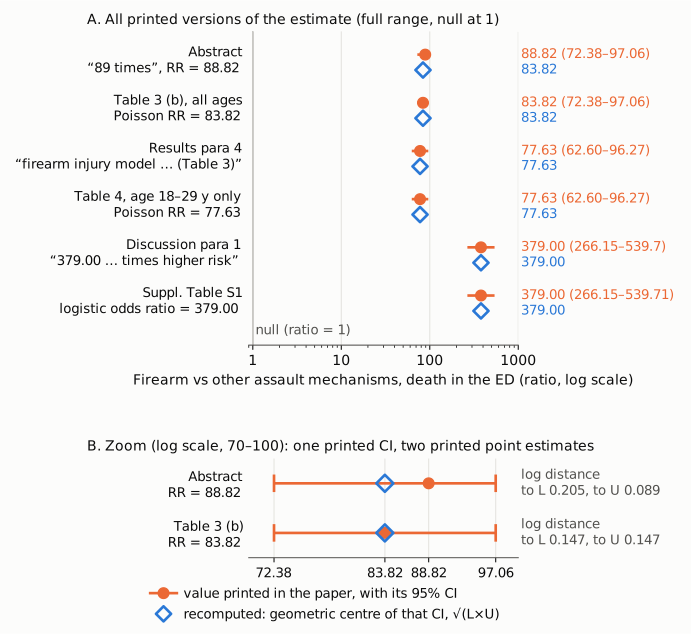
Figure 1. The printed versions of one estimate, and the centres of their printed intervals. Panel A shows each printed value (orange dot) with its printed 95% CI (orange line), on a logarithmic axis that runs from the null value (thin line at 1) to 1000. Next to it is the geometric centre of that CI, √(L×U), recomputed (blue open diamond). The Results para 4 value equals the age 18–29 y value in Table 4. The Discussion value equals the logistic odds ratio in Supplementary Table S1 and lies about 4.5 times above the Poisson estimates. Panel B zooms in (log axis, 70–100) on the two rows that print the same interval, 72.38–97.06. Table 3's 83.82 sits at the centre (log distance 0.147 to each limit). The abstract's 88.82 does not (0.205 and 0.089). All intervals lie far from 1.
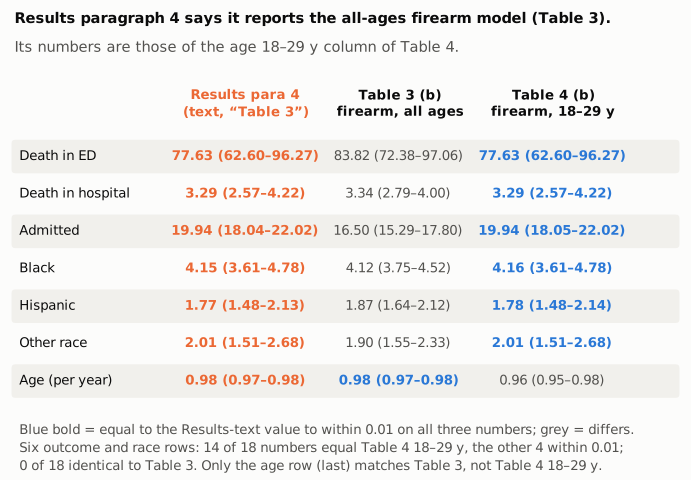
Figure 2. Results paragraph 4 against the two table columns it could come from. The left column (orange) holds the values printed in the Results paragraph that cites Table 3. The middle and right columns hold the firearm-model values printed in Table 3 (all ages) and Table 4 (age 18–29 y). A cell is blue and bold when all three of its numbers (estimate and both limits) equal the Results-text value to within 0.01, and grey otherwise. For death in the ED, death in hospital, admission and the three race contrasts, the Results text matches Table 4's 18–29 y column (14 of 18 numbers identical, the rest within 0.01) and none of Table 3's 18 numbers. Only the age coefficient matches Table 3.
Why it matters
- It is the headline quantitative finding. The abstract's only mortality estimate is this RR, and the abstract, Results and Discussion each lead with it. A reader, or an indexing service that shows only the abstract, gets 88.82. A reader of the Discussion gets 379. The value the paper's own tables support is 83.82: about 84 times, not 89. The Discussion overstates it by a factor of 4.52.
- The Discussion figure uses the model the paper itself rejects. The Methods and the closing Discussion paragraph explain that the logistic model was replaced because it "inflated the odds ratios". The 379.00 in the Discussion's summary of findings is that model's odds ratio, presented as "times higher risk". For an outcome this rare among non-firearm assaults, an odds ratio and a relative risk are not interchangeable. Here they differ by a factor of 4.5. The same paragraph's "nearly five times more likely to identify as Black" also matches the odds ratio (4.74), not the RR the abstract reports (4.12).
- The Results text attributes subgroup numbers to the overall model. The firearm-model paragraph says "(Table 3)" but gives the 18–29 y estimates for death in the ED, death in hospital, admission and race. For admission, the stated 19.94 is 21% higher than the all-ages 16.50. A reader who compares text with table finds that they disagree on most of the rows.
- What is not affected. Every version of the estimate excludes 1 by a wide margin, so the direction and statistical significance of the firearm–mortality association do not change. The title and the qualitative Conclusion ("significantly higher mortality rates") also stand. Table 3 and Table 4 are internally consistent: each of the 15 cells used here sits at the centre of its CI to within 0.006, which is rounding. The problem is therefore in how the tables were carried into the text, not in the models as tabulated.
Explanations considered
- The abstract reports a different model or population than Table 3. This does not work. The abstract's comparison ("compared to female patients injured by non-firearm injury mechanisms") is Table 3 model (b), and it prints exactly Table 3's interval, 72.38–97.06. No estimate of 88.82 appears in any table or in the supplement. A point estimate of 88.82 cannot come from a log-scale Wald interval of 72.38–97.06, because it lies 0.77 standard errors from the centre. The abstract's own interval therefore implies 83.82.
- A rounding or significant-figure difference. This does not work. 88.82 and 83.82 differ by 5.00 (6%), and "89 times" rounds 88.82, not 83.82 (84).
- Results paragraph 4 deliberately describes the youngest age group. This does not work. The paragraph opens "In the firearm injury model for women", gives no age group, and ends "(Table 3)". Its age coefficient (0.98, 0.97–0.98) is the all-ages Table 3 value; within a single age stratum the coefficient differs (0.96 for 18–29 y). The age-stratified results are introduced only in the next paragraph ("We re-ran 8 survey-weighted Poisson regression models by age category … in Table 4"). That paragraph restates the same 18–29 y firearm values, which confirms where they came from.
- The Discussion intentionally quotes the logistic model. The value is indeed the logistic odds ratio (Supplementary Table 1: 379.00, 266.15–539.71). But the sentence calls it "times higher risk" without saying it is an odds ratio from the supplementary model, and it sits in the summary of the paper's own findings. The Methods say that model gave inflated odds ratios and was replaced. The comparator in the sentence ("all-cause female assault patients") also differs from the model's comparator (assault by all other mechanisms). So even read as intentional, the sentence misdescribes the measure and does not report the paper's primary estimate.
- A conversion or typesetting artifact in PMC. This is ruled out. The same values appear in the Europe PMC full-text JATS XML (each of "RR = 88.82", "RR = 77.63", "RR = 77.65", "379.00" and "83.82" exactly once) and in the PubMed abstract (PMID 41551920), which also carries the stray "95% CI 6 =". The table cells line up with their headers, and no minus signs, superscripts or decimal commas are involved.
- A table rather than the text is wrong. This is unlikely. Each of the 15 Table 3 and Table 4 cells examined sits at the geometric centre of its own interval to within 0.006 (rounding), against 5.00 for the abstract's 88.82. The textual values match specific cells of other tables (Table 4 18–29 y; Supplementary Table 1). The only value with no source in any table is the abstract's 88.82, and its interval is Table 3's.
None of these explanations reconciles the four values. The consistent reading is that Table 3 holds the primary estimate, 83.82 (72.38–97.06), and that the abstract, the Results paragraph and the Discussion each misreport it in a different way.
Status
As of 2026-10-23:
- Version of record: checked through publisher-deposited copies. The publisher's own pages could not be opened: doi.org leads to linkinghub.elsevier.com, which returned a redirect stub, and thelancet.com and sciencedirect.com returned HTTP 403. The Europe PMC full-text XML for PMC12811418 and the PubMed record (PMID 41551920) both carry every quoted passage unchanged. The Elsevier article metadata lists The Lancet Regional Health – Americas, February 2026, open access, CC BY 4.0.
- Supplements: the article's only supplementary file, mmc1.docx ("Supplementary Tables", 31,729 bytes), was downloaded from the publisher CDN and read in full. It holds Supplementary Tables 1 and 2, both logistic regression (adjusted odds ratios), all ages and by age group. Supplementary Table 1 is the source of the Discussion's 379.00 (266.15–539.71) and of OR 4.74 for Black women. No RR of 88.82 appears in it.
- Corrections and notices:
src/known.py 10.1016/j.lana.2025.101343returns no Crossref update and no PMC or Europe PMC notice. The Europe PMC record lists no comment or correction links. No erratum, correction, expression of concern or retraction was found. - PubPeer: PubPeer's API returned "Human verification required" (HTTP 403), so it could not be queried directly. A web search for the title together with "pubpeer" returned no PubPeer page. A thread therefore cannot be ruled out with certainty, but none was found.
- Sources: PMC12811418 (
src/show.py); https://www.ebi.ac.uk/europepmc/webservices/rest/PMC12811418/fullTextXML; PubMed 41551920; https://ars.els-cdn.com/content/image/1-s2.0-S2667193X25003540-mmc1.docx; https://doi.org/10.1016/j.lana.2025.101343.
Suggested correction
- Abstract, Findings: replace "89 times higher risk of dying in the ED (RR = 88.82; 95% CI 6 = 72.38–97.06)" with "84 times higher risk of dying in the ED (RR = 83.82; 95% CI 72.38–97.06)", matching Table 3.
- Results, paragraph 4: replace the age 18–29 y values with the all-ages Table 3 values: death in ED RR = 83.82 (72.38–97.06), death in hospital RR = 3.34 (2.79–4.00), admitted RR = 16.50 (15.29–17.80), Black RR = 4.12 (3.75–4.52), Hispanic RR = 1.87 (1.64–2.12), Other RR = 1.90 (1.55–2.33). Alternatively, label them explicitly as the 18–29 y estimates and cite Table 4.
- Results, paragraph 5: change "RR = 77.65" to "RR = 77.63", and change the upper limit of the 18–29 y all-assault death-in-ED interval from "4.20" to "4.02", matching Table 4.
- Discussion, paragraph 1: replace "379.00 (95% CI 266.15–539.7) times higher risk of dying in the ED compared to all-cause female assault patients" with the primary Poisson estimate: "an 84-fold higher risk of dying in the ED (RR = 83.82; 95% CI 72.38–97.06) compared to female patients injured by other assault mechanisms". If the logistic estimate is kept, label it as an odds ratio from the supplementary model. Similarly, "nearly five times more likely to identify as Black" should read about four times (RR = 4.12; 95% CI 3.75–4.52), matching the abstract and Table 3.
- Abstract, Native American estimate (optional): either state that RR = 2.81 (2.67–2.97) refers to women aged 18–29 y, or give the all-ages Table 3 value, RR = 2.68 (2.60–2.77).