← Back to the plain-language case
Abstract reports 84% of ST2621 isolates as clinical; the Results count gives 98 of 164 (60%)
PLoS Pathog (2026) · doi:10.1371/journal.ppat.1013859 · PMC12810914
Summary
The abstract says that most isolates of the dominant clone ST2621 came from adult patients (59%) and from clinical samples (84%). The Results section, describing the same 164 ST2621 isolates, gives 95 adult (58%) and 98 clinical (60%) isolates, and the isolate-level S1 Table reproduces those counts exactly. An 84% clinical share would need 137 or 138 clinical ST2621 isolates. That is incompatible with the Results count, and also with the paper's own totals: Table 1 lists 186 clinical isolates in the whole collection, which leaves room for at most 135 clinical ST2621 isolates. The direction of the finding (most ST2621 isolates were clinical) is unchanged, but the abstract overstates the clinical share by 24 percentage points in the sentence that describes the clone.
What the paper reports
All quotes are from the article as archived in PubMed Central and were checked verbatim.
Abstract:
Sequence type (ST) 2621 (164, 40%) and ST39 (164, 40%) predominated with several minor STs making up the remainder. The majority of ST2621 associated with blaOXA-181 were isolated from adult patients (59%) and clinical samples (84%).
Results, first MLST paragraph:
ST2621 and ST39 were overwhelmingly dominant in the collection (S1 Table), represented by 164 isolates (39.6%) each.
Results, "Characteristics of ST2621":
blaOXA-181 was the predominant carbapenemase gene associated with this ST, being detected in all isolates, with one isolate having an additional blaNDM–1 gene.
The majority of the ST2621 isolates were from adult patients (95, 58%) and from clinical samples (98, 60%).
Results, carbapenemase genes (counts used for the upper bound below):
The predominant genes were blaOXA-181 (194, 46.9%) and blaNDM-1 (191, 46.2%).
Interestingly, most isolates with blaNDM-1 were from carriage samples (146, 72.6%), whereas those with blaOXA-181 were mostly clinical isolates (125, 64.4%) (Fig 1C).
Results, ST48 paragraph:
All ST48 isolates were blaOXA-181 producers, except for the first ST48 isolate from 2019, which produced blaOXA-48 (Fig 2). This ST was predominantly in adult patients (16, 84.2%) and from clinical samples (15, 79.0%).
Results, "Characteristics of ST39":
The majority of the ST39 isolates were obtained from neonatal (92, 56.1%) and paediatric (64, 39.0%) patients and mostly in carriage samples (128, 78.0%).
Table 1, "Source" rows (total isolates n = 778 | stored isolates n = 413):
Clinical | 357 (45.9) | 186 (45.0)
Carriage | 421 (54.1) | 227 (55.0)
Discussion:
In contrast, ST2621 was more associated with adult patients and clinical samples. Given that limited CRE colonization screening was undertaken in the adult wards, this almost certainly presents an underestimation of the true spread, and the propensity to cause more disease cannot be quantified sufficiently.
What the paper's own numbers show
Method. I divided the Results counts for ST2621 by the stated clone size (164) and found which integer counts out of 164 round to the abstract's percentages. I then bounded the number of clinical ST2621 isolates in two ways that use only counts printed in the text: (A) the 186 clinical isolates in Table 1, minus the clinical isolates of ST39 (164 − 128 carriage = 36) and ST48 (15); and (B) the 125 clinical blaOXA-181 isolates, since the Results say all ST2621 isolates carry blaOXA-181, minus at least 14 clinical blaOXA-181 isolates of ST48 (15 clinical ST48 isolates, of which at most one is the single blaOXA-48 isolate). Finally, I recounted the isolate-level rows of S1 Table (supplementary file s006, sheet "metadata_PRJEB63349"), stripping trailing spaces from six cells. Every number below is printed by recompute.py.txt.
| Quantity | Location | Reported | Recomputed from the paper's own numbers |
|---|---|---|---|
| ST2621 from clinical samples | Abstract | 84% | 98/164 = 59.8%; 84% of 164 needs 137 or 138 isolates |
| ST2621 from clinical samples | Results, "Characteristics of ST2621" | 98, 60% | 98/164 = 59.8% (consistent) |
| ST2621 from adult patients | Abstract | 59% | 95/164 = 57.9%; 59% needs 96 or 97 isolates |
| ST2621 from adult patients | Results, "Characteristics of ST2621" | 95, 58% | 95/164 = 57.9% (consistent) |
| Ceiling A on clinical ST2621 | Table 1; ST39 and ST48 paragraphs | 186 clinical in all | 186 − 36 − 15 = 135, so at most 135/164 = 82.3%; 137 + 36 + 15 = 188 and 138 + 36 + 15 = 189, both above 186 |
| Ceiling B on clinical ST2621 | blaOXA-181 and ST48 paragraphs | 125 clinical blaOXA-181 isolates | at most 125/164 = 76.2%; after subtracting ST48, at most 111/164 = 67.7% |
| ST2621 counts in S1 Table | S1 Table, isolate rows | — | n = 164: 95 adult (57.9%), 54 paediatric, 15 neonate; 98 clinical (59.8%), 66 screening (40.2%) |
| ST2621 with OXA-181 in the class D column | S1 Table | — | n = 147: 89 adult (60.5%), 92 clinical (62.6%) |
| Clinical share among ST2621 adults | S1 Table cross-tabulation | — | 78/95 = 82.1% (74/89 = 83.1% in the OXA-181 subset) |
| Adult share among ST2621 clinical isolates | S1 Table cross-tabulation | — | 78/98 = 79.6% |
| ST48 adults | Results, ST48 paragraph | 16, 84.2% | 16/19 = 84.2% (the same rounded value as the abstract's 84%) |
| ST39 carriage, neonatal, paediatric | Abstract vs Results, "Characteristics of ST39" | 76%, 57%, 38% vs 128 (78.0%), 92 (56.1%), 64 (39.0%) | 128/164 = 78.0%, 92/164 = 56.1%, 64/164 = 39.0% |
The Results percentages agree with their own counts and with the supplement. The abstract's 84% does not match any ST2621 quantity in the paper or the supplement, and it is also larger than the most clinical ST2621 isolates the paper's totals can hold (ceiling A, 82.3%). Ceiling A uses only the Table 1 total and the per-ST counts in the text, not the gene data. S1 Table has 187 clinical rows in the whole collection rather than 186. Using 187 in ceiling A gives 136/164 = 82.9%, still below 84%.
Figure
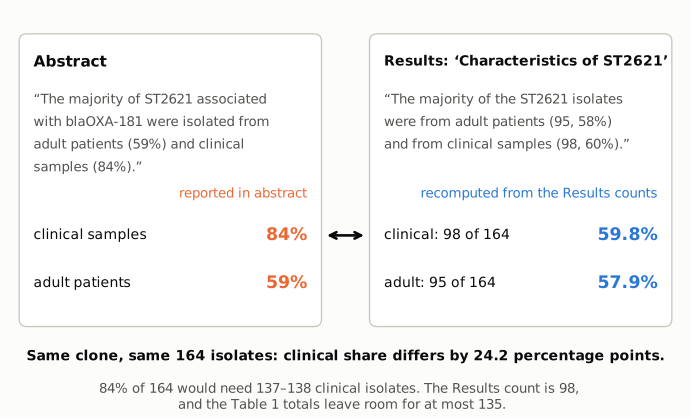
Figure 1. The two conflicting sentences, quoted verbatim. Left: the abstract's percentages, as printed (orange). Right: the percentages computed from the counts printed in the Results sentence (blue): 98 of 164 clinical (59.8%) and 95 of 164 adult (57.9%). The clinical shares differ by 24.2 percentage points. An 84% share would need 137 or 138 clinical isolates, while the Results give 98 and the Table 1 totals leave room for at most 135.
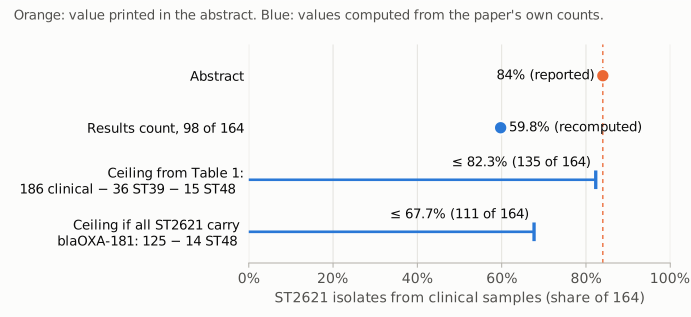
Figure 2. Share of the 164 ST2621 isolates that came from clinical samples, on a 0–100% axis. The orange dot is the abstract value (84%; dashed reference line). The blue dot is the Results count (98/164 = 59.8%). The blue bars show the largest values the paper's other counts permit: 135/164 = 82.3% from the Table 1 total of 186 clinical isolates minus the clinical isolates of ST39 (36) and ST48 (15), and 111/164 = 67.7% from the 125 clinical blaOXA-181 isolates, if, as the Results state, every ST2621 isolate carries blaOXA-181, minus at least 14 clinical blaOXA-181 isolates of ST48. The abstract value lies above both ceilings.
Why it matters
- It changes the description of the clone in the abstract. The abstract sentence is the paper's only summary of who carries ST2621. At 84% clinical, about 1 in 6 ST2621 isolates would have come from carriage screening. The paper's counts give 66 of 164, about 4 in 10. The clone's sample mix is closer to an even split than the abstract suggests.
- It sharpens a contrast the Discussion draws. The Discussion says ST2621 "was more associated with adult patients and clinical samples" than ST39, and raises a possible "propensity to cause more disease". The direction still holds with the correct figure: 60% of ST2621 isolates were clinical, against 36/164 = 22.0% of ST39 isolates. The gap, though, is smaller than the abstract implies (about 38 rather than about 62 percentage points). The paper itself notes that adult wards had limited screening, which would also raise the clinical share of an adult-associated clone.
- The main conclusions are not affected. The paper's headline findings stand without this figure: ST2621 and ST39 dominate the collection, they are distinct from the international lineages, and carbapenemase genes were probably acquired locally. No statistical test depends on it. The adult share (59% in the abstract vs 57.9% computed) differs only slightly.
- Readers are likely to quote the abstract value. The 84% appears only in the abstract, which is the part most readers, indexers and citing papers take numbers from.
Explanations considered
- A different population ("ST2621 associated with blaOXA-181"). The abstract's qualifier could mean a subset rather than all 164 isolates. The Results say blaOXA-181 was "detected in all isolates", so the subset would be all 164 and the share 59.8%. The supplement lists fewer: the S1 metadata sheet has OXA-181 in the class D column for 147 ST2621 isolates, and its "ARG summary" sheet gives 143 (87.2%). In the 147-isolate subset the clinical share is 92/147 = 62.6%. More generally, no subset of 143 or more ST2621 isolates can exceed 98/143 = 68.5% clinical. To reach 84%, a subset would have to drop at least 48 of the 66 screening isolates while keeping nearly every clinical one. This does not explain the number. (The difference between "all isolates" in the text and 143 or 147 in the supplement is a separate, smaller inconsistency. It does not affect the clinical-share comparison.)
- A different denominator or a conditional share. The nearest conditional shares in S1 Table are clinical among ST2621 adults, 78/95 = 82.1%, and clinical among adults in the OXA-181 subset, 74/89 = 83.1%. Both round to 82% or 83%, not 84%, and neither matches the sentence, which gives the adult and clinical shares side by side as fractions of the same group. Adults among clinical isolates is 78/98 = 79.6%. None of these gives 84%.
- Excluding the isolate with an additional blaNDM-1. Dropping one isolate gives 97/163 = 59.5% or 98/163 = 60.1%. It does not explain the number.
- Rounding or a typesetting slip. Rounding cannot turn 59.8% into 84%. Rounding could explain 58% vs 59% only if the adult count were 96 or 97, but the Results and the supplement both give 95. The 59% remains a small unexplained difference.
- Version or conversion differences. The publisher's HTML, the publisher's PDF, the PMC record and the Europe PMC full-text XML all carry the same abstract and Results wording, so this is not an artifact of conversion to PMC.
- A value from a neighbouring paragraph. The ST48 paragraph gives 16/19 = 84.2% adults, the same rounded value. The paper gives no information on how the abstract figure was derived, so whether the two are related cannot be determined. The correction below does not depend on it.
- Minor ST39 figures. The abstract's ST39 percentages (76% carriage, 57% neonatal, 38% paediatric) also differ by 1–2 points from the Results (78.0%, 56.1%, 39.0%). S1 Table has 165 ST39 rows against 164 in the text, because two rows share one laboratory number and one sequencing accession. These are small discrepancies and do not bear on the ST2621 figure.
Status
As of 2026-10-24:
- Version of record. The wording is the same in the publisher's article page (journals.plos.org, published 16 January 2026), the publisher's 18-page PDF, the PMC record and the Europe PMC full-text XML.
- Supplement. S1 Table (ppat.1013859.s006.xlsx, downloaded from the PLOS supplementary link) was recounted at isolate level. It supports the Results figures (95 adult, 98 clinical of 164), not the abstract. S1–S5 Figs (phylogenies and plasmid figures) were not used, because they do not give counts that bear on this question.
- Corrections. No correction, erratum, expression of concern or retraction was found. Crossref has no update records (empty
update-to,updated-byandrelation). PMC and Europe PMC list no notices (src/known.py). The PLOS article page shows no notice and no reader comments. - PubPeer. Web searches found no PubPeer thread or other public discussion. The PubPeer API and the Europe PMC search endpoint returned errors during these checks, so those two sources could not be queried directly.
Suggested correction
In the abstract, replace
The majority of ST2621 associated with blaOXA-181 were isolated from adult patients (59%) and clinical samples (84%).
with wording consistent with the Results and S1 Table, for example:
The majority of ST2621 isolates, which carried blaOXA-181, were from adult patients (95/164, 58%) and clinical samples (98/164, 60%).
The authors may also wish to:
- reconcile "detected in all isolates" for blaOXA-181 in ST2621 with the 147 (metadata sheet) and 143 (ARG summary sheet) isolates listed in S1 Table;
- align the abstract's ST39 percentages (76%, 57%, 38%) with the Results (78.0%, 56.1%, 39.0%);
- remove the duplicated ST39 row from S1 Table.