← Back to the plain-language case
Reported p values for HbA1c and other secondary outcomes contradict their own confidence intervals
Diabetologia (2025) · doi:10.1007/s00125-025-06585-2 · PMC12779728
Summary
This 76-participant randomised trial compared video consultations with in-person care in adults with type 1 diabetes who use insulin pumps. Table 2 gives the between-group difference in HbA1c change as −2.01 mmol/mol with a 95% CI of −5.32 to 1.29 and p < 0.001, and the Abstract and the Discussion present a favourable, statistically significant HbA1c effect. That interval includes zero and implies a two-sided p of about 0.23. A p below 0.001 would need a standard error of at most 0.61, about a third (36%) of the 1.69 implied by the printed interval. The same mismatch between interval and p value appears in every other Table 2 row that has a p value, including the treatment-satisfaction and quality-of-life outcomes the Abstract calls superior and inferior. As printed, none of the secondary-outcome claims of statistical significance is supported by the paper's own intervals. The primary result for time in range, no clinically meaningful difference, is not affected.
What the paper reports
Table 2, "Primary and secondary endpoints" (columns: endpoint | video group | control group | difference (95% CI) | p value). The footer reads "Estimates are reported as least squares means ± SEs".
Change in HbA1c, mmol/mol | -4.13 ± 1.43 | -2.12 ± 1.38 | -2.01 (-5.32, 1.29) | <0.001
Change in HbA1c, % | -0.38 ± 0.13 | -0.19 ± 0.13 | -0.18 (-0.49, 0.12) |
The other Table 2 rows that have a p value:
TiR (3.9–10.0 mmol/l), % | 64.28 ± 2.91 | 63.49 ± 2.50 | 0.8 (-5.30, 6.89) | 0.251
DTQSc (range -18 to 18) | 10.23 ± 1.61 | 9.01 ± 1.42 | 1.22 (-2.51, 4.96) | 0.004
DTQSs (range 0–36) | 30.06 ± 1.25 | 28.09 ± 1.13 | 1.98 (-0.98, 4.93) | <0.001
ADDQoL19 (range -9 to +3) | -1.6 ± 0.33 | -1.33 ± 0.29 | -0.27 (-1.07, 0.53) | 0.004
Methods, "Statistical analysis":
All 95% CIs and p values are two-sided.
the key secondary outcomes were analysed in a prioritised order (i.e. ‘gatekeeping procedure’) [17].
The statistical tests were performed and interpreted in sequence until one of the analyses failed to show a statistically significant difference at a statistical significance level of 0.05
Missing data were imputed using retrieved participants from the same randomised treatment group, with results combined according to Rubin’s rule [18]. The main analyses are reported as least squares means and SEs, with differences between groups and corresponding 95% CIs adjusted for stratification and baseline outcome measurements.
Results, second paragraph. The text repeats the intervals but gives no p values for the secondary outcomes:
the observed difference of 0.8 percentage points (95% CI -5.3, 6.9; p=0.25)
the intervention group showed better treatment satisfaction compared with the controls, with a potential difference of 1.22 points for DTSQc (95% CI -2.51, 4.96) and 1.98 points for DTSQs (95% CI -0.98, 4.93)
Regarding glycaemic control, only HbA1c demonstrated a favourable difference, being lower in the intervention group than in the control group, with a mean difference of -2.01 mmol/mol (95% CI -5.32, 1.29) (-0.18%; -0.49%, 0.12%).
Results, "Sensitivity analyses and adherence to protocol":
No discrepancies were observed between the main findings and those from sensitivity analyses for primary or secondary endpoints
Abstract, Results:
For secondary outcomes, the video group was superior in terms of treatment satisfaction and reduction in HbA1c. However, the video group experienced an inferior impact on quality of life.
Abstract, Conclusions/interpretation:
However, compared with control, the intervention was associated with superior treatment satisfaction and a favourable effect on HbA1c, albeit with an inferior impact on quality of life.
Discussion, first paragraph:
However, although a statistically significant difference was found for several of the secondary outcomes
Discussion, second paragraph:
We did find a statistically significant improvement in HbA1c, albeit not necessarily clinically relevant, in the video consultation group.
Discussion, on quality of life:
Hence, one might speculate that although statistically different, the finding might not be clinically meaningful
Discussion, concluding paragraph:
However, better treatment satisfaction and a greater reduction in HbA1c were seen, although with a greater negative impact on quality of life.
What the paper's own numbers show
Method. The Methods describe a two-sided Wald-type comparison: an ANCOVA difference in least squares means with a 95% CI. For such a comparison the CI and the p value come from the same estimate and standard error, so each one fixes the other. For each Table 2 row I took the SE as the CI width divided by 2 × 1.96, computed z = difference / SE and the two-sided normal p value, and compared it with the printed p. As a second, independent check I computed the SE of the difference from the two arm SEs, assuming the arm estimates are uncorrelated, as they are in a randomised parallel-group trial. I also asked what SE and CI the printed p would need, and repeated the CI-to-p calculation for the sensitivity analyses in ESM Tables 1 and 2. Every number below is printed by recompute.py.txt.
| Quantity | Location | Reported | Recomputed from the paper's numbers |
|---|---|---|---|
| HbA1c difference, video − control (mmol/mol) | Table 2; Results | −2.01 (95% CI −5.32, 1.29) | LS means −4.13 − (−2.12) = −2.01; CI midpoint −2.015, so the interval is centred on the estimate |
| SE of the HbA1c difference, from the CI | Table 2 | — | half-width 3.305; SE = 3.305 / 1.96 = 1.686 |
| HbA1c two-sided p, from the CI | Table 2 | <0.001 | z = −1.19; p = 0.233 (t with 60 or 70 df: 0.24) |
| HbA1c p, from the arm SEs | Table 2 | <0.001 | SE = √(1.43² + 1.38²) = 1.987; z = −1.01; p = 0.31; 95% CI (−5.91, 1.89) |
| HbA1c one-sided p | derived | — (Methods: all p values two-sided) | 0.117 |
| SE and CI that p = 0.001 would require | derived | — | SE ≤ 0.611, CI half-width ≤ 1.20, i.e. about (−3.21, −0.81), against a printed half-width of 3.305 |
| HbA1c difference, % scale | Table 2 | −0.18 (−0.49, 0.12), p cell blank | SE 0.156, p = 0.25; −2.01 / 10.929 = −0.184 (−0.487, 0.118), so the two scales agree with each other |
| TiR (primary) | Table 2; Abstract; Results | 0.8 (−5.30, 6.89), p = 0.251 | SE 3.110, z = 0.26, p = 0.80; p = 0.251 would need a CI half-width of 1.37, not 6.09 |
| DTSQc | Table 2 | 1.22 (−2.51, 4.96), p = 0.004 | SE 1.906, z = 0.64, p = 0.52 |
| DTSQs | Table 2 | 1.98 (−0.98, 4.93), p < 0.001 | SE 1.508, z = 1.31, p = 0.19 |
| ADDQoL19 | Table 2 | −0.27 (−1.07, 0.53), p = 0.004 | SE 0.408, z = −0.66, p = 0.51 |
| TbR < 3.0 mmol/l | Table 2 | 0.05 (−0.34, 0.44), p = 0.200 | p = 0.80 |
| Sensitivity analyses with a printed p | ESM Table 1 (per protocol); ESM Table 2 (baseline carried forward) | ESM T1 TiR 3.69 (−3.36, 10.75), p 0.294; ESM T2 TiR −0.56 (−5.49, 4.36), p 0.819; ESM T1 DTSQc 1.30 (−4.79, 7.39), p 0.658; ESM T2 DTSQc 0.94 (−3.57, 5.45), p 0.674 | in the same order: p = 0.305, 0.824, 0.676 and 0.683; these agree with their CIs to within 0.02 |
| HbA1c in the sensitivity analyses | ESM Table 1 (per protocol); ESM Table 2 (baseline carried forward) | −3.42 (−7.54, 0.69); −1.31 (−4.02, 1.4); p shown as "-" | p = 0.10 and 0.34; both intervals include zero |
All six Table 2 rows with both a printed p and a 95% CI are inconsistent with themselves, and in each case the printed p is smaller than the interval allows. Four of the six fall below 0.05 although every one of the six intervals includes zero. By contrast, the four p values printed in the ESM sensitivity tables match their intervals.
Side observation. In four Table 2 rows without a p value, the printed difference does not equal video minus control. TbR 3.0–3.8 mmol/l: 1.70 − 1.46 = 0.24, printed −0.20. TaR > 13.9 mmol/l: −1.54, printed 0.35. TaR 10.1–13.9 mmol/l: −0.88, printed −2.83. Glycaemic variability: 36.86 − 36.86 = 0.00, printed 2.24. In each case the printed CI is centred on the printed difference, not on the difference of the LS means. These rows do not feed the claims discussed here, but they suggest the Table 2 entries as a whole need checking.
Figure
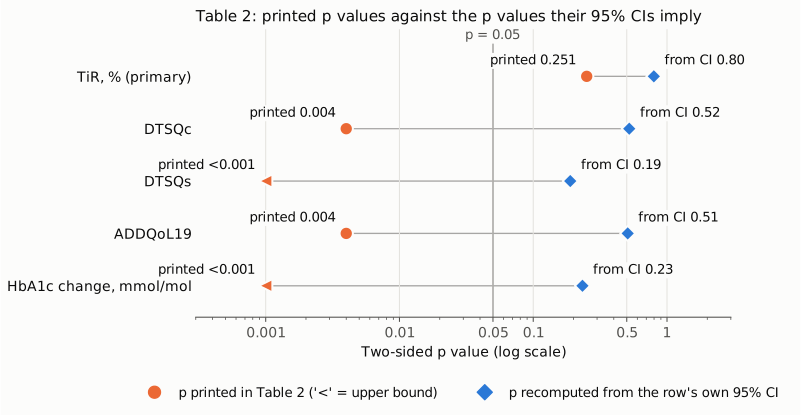
Figure 1. For the primary outcome and the four secondary outcomes that the paper's conclusions rest on, the orange circle is the printed p (a left-pointing triangle marks "<0.001", which is an upper bound, drawn at 0.001), and the blue diamond is the two-sided p recomputed from the printed CI as described above. The axis is logarithmic, and the vertical line marks p = 0.05. Every recomputed value lies above 0.05, between 0.19 and 0.80, while four of the printed values lie below it. The gap is largest for HbA1c and DTSQs, where the printed p is at least 190 to 230 times smaller than the interval implies. The sixth row with a p value, TbR < 3.0 mmol/l (printed 0.200, recomputed 0.80), is not drawn. All values are from Table 2 or from recompute.py.txt.
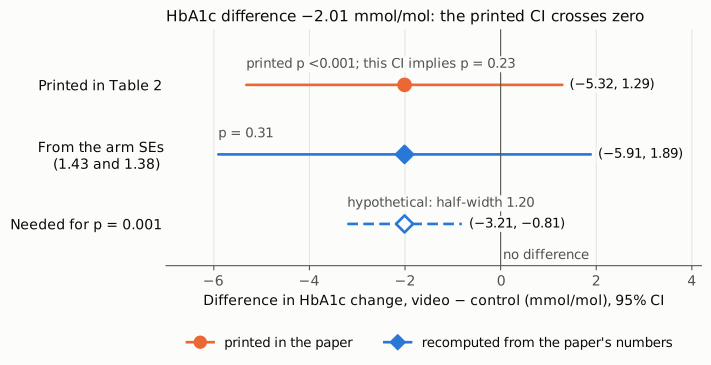
Figure 2. The HbA1c difference on its own scale (mmol/mol, video − control). The orange interval is the printed 95% CI (−5.32, 1.29). The solid blue interval is the CI implied by the two arm SEs, 1.43 and 1.38 (−5.91, 1.89; p = 0.31). The dashed blue interval is hypothetical: the 95% CI that a p of 0.001 would require around the same estimate (−3.21, −0.81). Both intervals built from the paper's numbers cross zero (vertical line). Only an interval less than half as wide as the printed one, and entirely below zero, would be consistent with p < 0.001.
Why it matters
The trial's primary outcome, time in range, showed no meaningful difference, and that conclusion is unaffected: the CI (−5.30, 6.89) and the stated decision rule both point the same way, whichever p value is right. The paper's positive findings all come from the secondary outcomes. The Abstract reports that the video group "was superior in terms of treatment satisfaction and reduction in HbA1c" and had "an inferior impact on quality of life", and the Abstract conclusion and several Discussion paragraphs, including the concluding one, repeat these findings. The Discussion explicitly calls the HbA1c improvement "statistically significant" and the quality-of-life difference "statistically different". Those characterisations match the printed p values (<0.001, <0.001, 0.004, 0.004) but not the printed intervals, all of which include zero and imply p between 0.19 and 0.52. On the intervals, none of the secondary differences is statistically significant at 0.05. That includes the % HbA1c row, which has no p value but whose CI (−0.49, 0.12) gives p ≈ 0.25.
The paper's own gatekeeping rule points the same way. The Methods say the key secondary outcomes were analysed in a prioritised order, "listed in order under 'Outcomes and data collection'", and that the tests were interpreted in sequence until one failed at 0.05. The first outcome listed there is DTSQc, whose interval (−2.51, 4.96) includes zero and implies p = 0.52. On the intervals, the sequence therefore stops at its first step, and none of the later secondary outcomes (DTSQs, ADDQoL19, HbA1c) would be interpreted as confirmatory. If, as is usual, the sequence starts with the primary outcome, it would stop even earlier, since time in range was not significant either (printed p = 0.251; p from the CI 0.80).
Readers of the Abstract are therefore told of a favourable HbA1c effect and of superior treatment satisfaction that the reported data do not show to be different from no effect. A meta-analysis that took the HbA1c result from the text or CI would treat it as null. A reader or guideline that relied on the Abstract would treat it as positive.
Explanations considered
- Conversion or typesetting error in PMC. Ruled out. The publisher's version of record shows the same Table 2 values, including "<0.001" for HbA1c and a blank p cell for the % row, as do the PMC page and the Europe PMC XML.
- Rounding. Cannot account for the gap. The recomputed p values (0.19 to 0.80) differ from the printed ones (<0.001 to 0.251) by factors of 3 to more than 200, which rounding of the CI limits to two decimals cannot produce. The HbA1c interval is centred on its estimate (midpoint −2.015), and its % version converts exactly from the mmol/mol version, so the interval itself is not garbled.
- t rather than normal reference distribution. With 60 to 70 degrees of freedom the HbA1c p is 0.24, slightly larger, not smaller.
- One-sided test. The Methods say all p values are two-sided. A one-sided HbA1c p would still be 0.117.
- Multiplicity adjustment applied to CIs but not p values, or the reverse. The Methods say no multiplicity adjustment was applied. An adjustment would in any case raise p values, not lower them.
- Correlated arm estimates. Taking the arm SEs at face value makes the inconsistency worse (p = 0.31). For the SE of the difference to shrink to 0.61, the two arms' LS means would have to be correlated at about 0.91, which is not plausible for independently randomised parallel groups.
- Multiple imputation (Rubin's rules) affecting the CI but not the p value. For p < 0.001 to be right while the CI is also right, about 87% of the CI's variance would have to come from between-imputation variability. Only 13 of 76 participants (17%) did not complete the trial. The per-protocol analysis, which uses no imputation, also gives an HbA1c interval that includes zero (−7.54, 0.69; p ≈ 0.10).
- The p column reports a different test. For example, the p value could be for a within-group change from baseline, or for another term in the ANCOVA model. The video arm's within-group HbA1c change gives p = 0.004 (−4.13 / 1.43), which is still not <0.001. The other possibilities cannot be checked without the data. In any case the table pairs each p value with a between-group difference and CI, and the text interprets the p values as tests of that difference, so the inconsistency in the reported results would remain.
- The CI is wrong and the p value is right. This cannot be excluded without the data, but the paper's other numbers argue against it. The arm SEs independently imply an even wider interval. The interval is repeated in the Results text on two scales that agree with each other. Both sensitivity analyses give HbA1c intervals that include zero, and the Results state that they agree with the main analysis. The p values printed in the ESM tables also match their own CIs, so the mismatch is confined to the main Table 2.
None of these explanations reconciles the printed p values with the printed intervals.
Status
As of 2026-10-23:
- Version of record. On 2026-10-23 the publisher's Table 2 page (link.springer.com/article/10.1007/s00125-025-06585-2/tables/2) shows "Change in HbA1c, mmol/mol | −4.13 ± 1.43 | −2.12 ± 1.38 | −2.01 (−5.32, 1.29) | <0.001", the % row with a blank p cell, and the same values in the other rows, including the four differences that do not match their LS means. The publisher's article page carries the same Abstract and Discussion sentences. The article was published online on 7 November 2025 in Diabetologia 69(2):321–329 (February 2026). The PMC page and the Europe PMC full-text XML give identical values. Every quote above was checked verbatim against the PMC-archived text with
src/show.py, which renders minus signs as hyphens. - Supplements. The single ESM file (125_2025_6585_MOESM1_ESM.pdf, "ESM Tables", 5 pages) was downloaded from static-content.springer.com and read in full. ESM Tables 1 and 2 (sensitivity analyses) give HbA1c intervals that include zero, with no p value. ESM Table 4 (subgroups) gives HbA1c intervals that all include zero. No other HbA1c p value appears anywhere. Patient-level data are not public; the Data availability statement says they are available from the corresponding author on reasonable request.
- Corrections.
src/known.pylists no Crossref update relations and no PMC or Europe PMC correction, retraction or expression-of-concern notice. A Crossreffilter=updates:query for the DOI returns 0 results. - PubPeer. The PubPeer API and site returned HTTP 403 to automated requests on 2026-10-23, so PubPeer could not be checked directly. A web search for the title together with PubPeer found no thread.
Sources: PMC12779728 (PubMed Central archive, read with src/show.py); https://doi.org/10.1007/s00125-025-06585-2 and the publisher's Table 2 page; ESM file https://static-content.springer.com/esm/art%3A10.1007%2Fs00125-025-06585-2/MediaObjects/125_2025_6585_MOESM1_ESM.pdf; Europe PMC full-text XML; https://api.crossref.org/works?filter=updates:10.1007/s00125-025-06585-2; ClinicalTrials.gov NCT04612933 (registry entry, not used for any number here).
Suggested correction
- Re-derive the between-group p values for every Table 2 row from the same ANCOVA and multiple-imputation model that produced the differences and CIs, and correct the p column. Add the p value for the % HbA1c row, or state that it is the same test as the mmol/mol row.
- Revise the statements that depend on statistical significance of the secondary outcomes so that they match the corrected p values and the intervals. These are the Abstract Results and Conclusions/interpretation, and the first, second, quality-of-life and concluding paragraphs of the Discussion. If the intervals are correct, these differences should be described as not statistically significant, with the CI given.
- State how the gatekeeping procedure was applied: whether the sequence starts with the primary outcome, and how the secondary outcomes were interpreted given that the first listed key secondary outcome, DTSQc, has an interval that includes zero (−2.51, 4.96).
- Check the difference column for TbR 3.0–3.8 mmol/l, both TaR rows and glycaemic variability, where the printed difference does not equal video minus control.