← Back to the plain-language case
Abstract gives an onset age and female share that contradict the paper's own Table 1
Neurology (2025) · doi:10.1212/WNL.0000000000214316 · PMC12615010
Summary
The abstract describes the 140 autopsy-confirmed patients with multiple system atrophy (MSA) as having a "mean age at onset 62.3 ± 8.9 years" and as "44% female". Table 1 gives the same 140 patients a mean age at onset of 57.4 ± 8.5 years and a male:female split of 59:81, which is 57.9% female. The table checks out from several directions. Its subgroup counts sum to 59 men and 81 women in both of its groupings, the size-weighted mean of its subgroup onset ages is 57.40 years, and every one of its 11 subgroup mean onset ages is 59.7 years or less, so the overall mean cannot be 62.3. The paper's inferential results are not affected. However, the abstract, which is the part most often read and indexed on its own, makes the cohort look 4.9 years older at onset than it is and shows men, not women, as the majority.
What the paper reports
All quotations were checked verbatim against the PMC-archived text with src/show.py.
Abstract, Results:
Among 140 patients (mean age at onset 62.3 ± 8.9 years; 44% female), 81 (58%) initially presented without dysautonomia (57 with parkinsonism only, 17 with cerebellar syndrome only, 7 with both).
Table 1 ("Demographic Data"), All patients column:
M:F, n [%] | 59:81 [42:58]
Age at onset, y, mean ± SEM [range; median] | 57.4 ± 8.5 [35–80; 57.5]
Age of death, y, mean ± SEM [range; median] | 64.8 ± 7.7 [40–90; 64.5]
Disease duration, y, mean ± SEM [range; median] | 7.4 ± 3 [2–20; 7]
Table 1, M:F row by phenotype at onset (A, P, C, P+A, C+A, P+C, P+C+A):
16:11a [59:41] | 20:37a [35:65] | 11:6a [65:35] | 5:14 [26:74] | 2:2 [50:50] | 3:4 [37:63] | 2:7 [22:78]
Results, "Characteristics of Patients and of Clinical Phenotypes at Disease Onset":
We included a total of 140 autopsy-confirmed patients with MSA who had sufficient clinical data regarding disease progression in the analysis. The demographic characteristics and basic parameters of the study population are summarized in Table 1.
A significant association was found between sex and phenotype A, P, and C at onset, χ2(2, N = 101) = 7.015, p = 0.030, indicating a higher prevalence of P in women (n = 20 m vs n = 37 f) and of C (n = 11 m vs n = 6 f) and A (16 m vs 11 f) in men.
Methods, "Patients and Clinical Data":
The cohort has been described in previously published work, comprising 144 patients with a pathologic diagnosis of MSA.
Methods, "Statistical Analysis":
Demographic data were presented as means ± SD, ranges, and medians.
What the paper's own numbers show
Method. I transcribed the All patients column of Table 1 and every subgroup column: 7 groups by phenotype at onset and 4 groups by phenotype at final visit, each a partition of the 140 patients. I summed the subgroup sex counts. I pooled the subgroup onset means weighted by subgroup size, and pooled the spreads as SDs (within-group plus between-group variance). As a further check, I compared onset age with mean age at death minus mean disease duration. I also recomputed the Results-text chi-square from its counts, to confirm that the table's sex counts are the ones the analysis used. Every number below is printed by recompute.py.txt.
| Quantity | Location | Reported | Recomputed from the paper's own numbers |
|---|---|---|---|
| Mean age at onset, all 140 | Abstract, Results | 62.3 ± 8.9 y | 57.40 ± 8.49 y (n-weighted pool of the 7 onset groups) |
| Mean age at onset, all 140 | Table 1, All patients | 57.4 ± 8.5 | 57.40 (onset groups); 57.51 (final-visit groups) |
| Highest subgroup mean onset age | Table 1, 11 subgroup columns | 55.9 to 59.7 | maximum 59.7 (final P+C, n = 12); a pooled mean cannot exceed it |
| Age at death − disease duration | Table 1, All patients | 64.8 and 7.4 | 64.8 − 7.4 = 57.4; n-weighted onset groups: 64.80 − 7.44 = 57.37 |
| Female share | Abstract, Results | 44% | 81/140 = 57.9% |
| Sex counts | Table 1, M:F | 59:81 [42:58] | onset groups sum to M 59, F 81; final-visit groups sum to M 59, F 81; M + F = n in every column |
| 44% of 140 | derived | — | 61.6 women (61/140 = 43.6%, 62/140 = 44.3%); matches no count in the paper |
| Male share | Table 1 | 42% | 59/140 = 42.1% (so 44% is not the male share either) |
| Sex × onset phenotype (A, P, C) | Results text | χ²(2, N = 101) = 7.015, p = 0.030 | 7.015, p = 0.030 from counts 16/11, 20/37, 11/6, which equal the Table 1 counts |
| Differences, abstract vs table | — | — | onset age +4.9 y; female share −13.9 percentage points |
Table 1 is internally consistent and agrees with the Results text. Its subgroup counts, subgroup means and overall column fit together to the precision of the printed figures. The pooled SD of 8.49 even reproduces the overall spread of 8.5. The abstract's two demographic figures match nothing in the paper. The 62.3-year mean is 2.6 years above the highest of the 11 subgroup means. Taken against the table's mean age at death of 64.8, it would leave about 2.5 years from onset to death, while the table's mean disease duration is 7.4 years. The 44% female share would mean 61.6 women, which is not a whole number of patients. It is not the male share (42.1%) either.
Figure
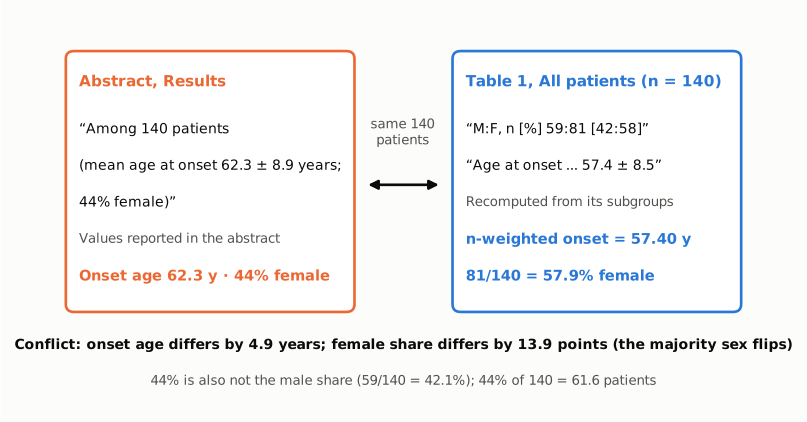
Figure 1. The two conflicting passages side by side. Left (orange): the abstract's description of the cohort, quoted verbatim, which gives an onset age of 62.3 years and 44% female. Right (blue): the Table 1 All patients cells, quoted with the row label shortened, and the values recomputed from the table's own subgroup columns, which give an n-weighted onset age of 57.40 years and 81/140 = 57.9% female. Both passages describe the same 140 patients. The abstract's onset age is 4.9 years higher than the table's, and its female share is 13.9 percentage points lower, which turns a female-majority cohort into an apparent male-majority one. The 44% also does not equal the table's male share (42.1%).
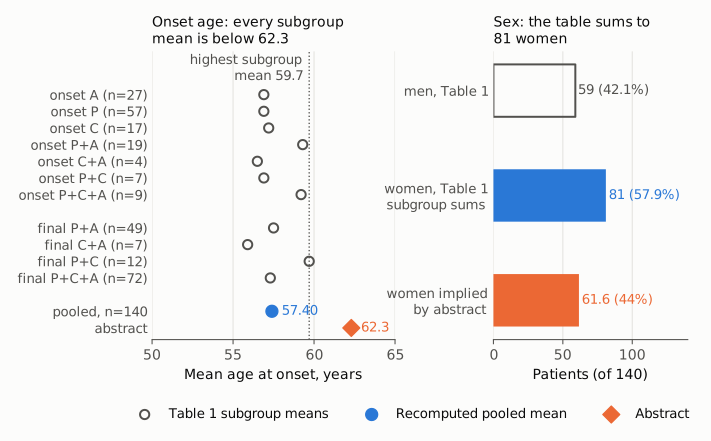
Figure 2. Left: mean age at onset in each Table 1 subgroup (open circles, labelled with subgroup size), shown for the 7 groups by phenotype at onset and the 4 groups by phenotype at final visit. Below them are the n-weighted pooled mean recomputed from the onset groups (blue circle, 57.40) and the abstract's overall mean (orange diamond, 62.3). The dotted line marks the highest subgroup mean (59.7). A weighted mean of the subgroup means cannot exceed it, so 62.3 cannot be the mean of these patients. Right: number of patients by sex. The open bar is the 59 men and the blue bar is the 81 women, both summed from the Table 1 subgroups. The orange bar is the number of women implied by the abstract's 44% of 140, which is 61.6. The x-axis starts at 0 on the right panel. On the left it spans 50 to 65 years, so the gap between 57.4 and 62.3 is shown at true scale against the spread of the subgroup means.
Why it matters
- The abstract misdescribes the cohort. Onset age and sex balance are the basic facts a reader uses to judge whom the findings apply to. The abstract puts the cohort's mean onset 4.9 years later than the body does (62.3 vs 57.4). It also reverses the sex majority, with 44% female against 57.9%. Neither error can be caught from the abstract alone, and the abstract is what databases index and what readers, reviewers and evidence syntheses most often extract.
- The abstract's sex figure conflicts with a reported finding. The paper reports a significant link between sex and onset phenotype, with parkinsonian onset more common in women (20 men vs 37 women). In the table, that sits within a female-majority cohort. A reader of the abstract would place it in a male-majority one.
- The inferential results are not affected. The tested findings are the 12 motor-only patients (9%), their longer disease duration against matched patients (8.1 ± 2.1 vs 6.3 ± 2.6 years, p = 0.035), the 51% who developed all 3 symptom complexes, and the faster progression after cerebellar onset (2.0 vs 3.4 years). None of them uses the cohort's summary onset age or sex share. The matching used each patient's own sex and onset age. Every other number in the abstract Results agrees with the body: 81 (58%), 57/17/7, 12 (9%), 51% and the durations. The error is confined to the two demographic figures.
Explanations considered
- A different population, such as the 144-patient parent cohort. This does not account for the numbers. The abstract says "Among 140 patients", the same N as Table 1 and the Results. The Methods mention the 144-patient cohort only as previously described work. That cohort's own publication (Mov Disord 2024, PMC12403858) reports an M:F of 61:83 [42.4:57.6] and an onset age of 57.42 ± 8.43. Those figures are close to Table 1 here and far from 62.3 years and 44% female.
- A different age variable. This does not account for the numbers. The paper reports age at onset (57.4), age at death (64.8) and disease duration (7.4) for the cohort, and nothing else. 62.3 is none of these and no simple combination of them. The one natural combination, death minus duration, gives 57.4 and so supports the table.
- Sex labels swapped. This does not account for the numbers. If 44% were the male share it would mean 61.6 men. The table has 59 men (42.1%) and 81 women. The Results text and the chi-square, which recomputes exactly to 7.015 from the table's counts, use the same counts.
- Table 1 is the one in error. This is not supported. The subgroup counts sum to the totals in two independent groupings, and M + F equals n in every column. The pooled subgroup means reproduce the overall 57.4 (57.40 and 57.51), and the pooled SD reproduces 8.5 (8.49). Every subgroup mean is 59.7 or below, so no arrangement of these subgroups can give an overall mean of 62.3.
- Rounding or a different denominator. This does not account for the numbers. No denominator the paper reports, whether 140, 101 (the A/P/C chi-square sample) or 99 (the Levodopa analysis), yields 44% female from the counts given. For example, the A, P and C groups together have 54 women of 101 (53.5%).
- A text-conversion artifact. Ruled out. The typeset publisher PDF prints the same abstract sentence and the same Table 1 cells as plain text (see Status). So do the Europe PMC XML and the PubMed abstract.
- Side observations, not part of the main finding. (1) Table 1 labels the spreads "mean ± SEM", but the Methods say "means ± SD". The values are SDs: the pooled subgroup SD is 8.49, while an SEM for n = 140 would be about 0.72. (2) The Results text says "Fifty patients (36%) showed only P+A", while Table 1 gives 49 [35]. With 50, the four final-visit groups would total 141, so the table's 49 is the consistent figure. Neither observation affects any conclusion.
Status
- Version of record. The publisher's site (neurology.org) returned HTTP 403 to automated requests for the article page, the PDF and the supplement. I therefore read two repository copies of the publisher's typeset 8-page PDF, both stamped as downloaded from neurology.org, with the publisher's page footer e214316 and the same creation date (2025-11-13). One is the LMU Munich repository (epub.ub.uni-muenchen.de/130571) and the other the DZNE repository (pub.dzne.de/record/282298). Both print the abstract sentence and the Table 1 cells exactly as quoted above. The Europe PMC full-text XML and the PubMed abstract (PMID 41232058) carry the same text.
- Supplements. The supplement (eTable 1, a sample overview by centre; eTable 2, symptom categories and documentation) is hosted only on neurology.org and could not be retrieved. PMC lists no supplement, and the Europe PMC supplementary bundle contains only the Figure 1 image. The Methods describe neither eTable as reporting cohort-level onset age or sex, and the cohort figures are already given in main Table 1. The data are available on request only.
- Corrections and comments. As of 2026-10-24 I found no correction, erratum, retraction or published comment.
src/known.pyreturns no Crossref update relations, no PMC notices and no Europe PMC notices, and the Crossref record has no update-to or updated-by entries. The PubPeer API returned no record (HTTP 404) for the DOI, and a web search of the title together with "PubPeer", "correction" and "erratum" found no thread or notice for this article. - Sources. PMC article PMC12615010 (via
src/show.py); Europe PMC full-text XML and supplementary files; PubMed PMID 41232058; typeset PDFs at epub.ub.uni-muenchen.de/130571 and pub.dzne.de/record/282298; the parent-cohort paper PMC12403858; Crossref; PubPeer; https://doi.org/10.1212/WNL.0000000000214316.
Suggested correction
In the abstract Results, replace
Among 140 patients (mean age at onset 62.3 ± 8.9 years; 44% female)
with
Among 140 patients (mean age at onset 57.4 ± 8.5 years; 58% female)
so that it matches Table 1 (M:F 59:81; age at onset 57.4 ± 8.5 years). If 62.3 ± 8.9 years and 44% female describe some other group, the abstract should name that group. The authors may also wish to relabel the Table 1 spreads from "SEM" to "SD", in line with the Methods and with the values. They may also wish to reconcile "Fifty patients (36%)" for the P+A group in the Results text with the 49 [35] in Table 1.