← Back to the plain-language case
Printed stroke confidence interval excludes its own estimate; Table 2 shows the effect is non-significant
JAMA Network Open (2025) · doi:10.1001/jamanetworkopen.2025.39862 · PMC12569718
Summary
This UK Biobank cohort study used longitudinal targeted maximum likelihood estimation to estimate how 5-year risks of hospitalization for cardiovascular disease would change under hypothetical PM2.5 interventions at thresholds of 12, 10 and 9 µg/m³. The Abstract and the Results text give the stroke risk difference at the 9 µg/m³ threshold (the US EPA annual standard) as −2.26 per mille with a 95% CI of −8.97 to −20.64. That interval is impossible: its lower bound is above its upper bound, and the point estimate lies outside it. Table 2, Supplement 1 eTable 2, and a recomputation from the Table 2 risks all give an upper bound of about +20.6, so the interval includes zero and the stroke effect at 9 µg/m³ is not statistically significant. The Key Points nonetheless say that the 12 and 9 µg/m³ thresholds "would significantly reduce" stroke, heart failure and myocardial infarction. By Table 2, that holds for myocardial infarction, but not for stroke at 9 µg/m³ or for heart failure at 12 µg/m³. Two smaller sign discrepancies between the text and Table 2 point in the same direction.
What the paper reports
The PMC-archived text uses hyphen-minus signs, and the quotes below reproduce it. The publisher's version of record prints the same characters as true minus signs (U+2212).
Key Points, Findings:
implementing a hypothetical intervention for reducing PM2.5 exposure by 5% if it is above the thresholds of 12 and 9 µg/m3 would significantly reduce the 5-year risk of hospitalization for stroke, heart failure, and myocardial infarction, but not for arrhythmia.
Abstract, Results (the same sentence fragment also appears in the Results text, in the paragraph that describes Table 2):
the hypothetical PM2.5 intervention of reducing PM2.5 exposure by 5% if it is above the threshold of 9 µg/m3, the estimated 5-year risk difference of hospitalization for stroke was -2.26 per mille (95% CI, -8.97 to -20.64 per mille)
Results text, Table 2 paragraph:
For the threshold intervention of 9 µg/m3 compared with no intervention, the estimated 5-year risk difference of hospitalization for stroke was -2.26 per mille (95% CI, -8.97 to -20.64 per mille)
Table 2, stroke rows (columns: hypothetical intervention | 5-y risk (95% CI), per mille | risk difference (95% CI), per mille):
No intervention | 12.32 (11.92 to 12.72) | [Reference] ≤12 | 10.78 (10.07 to 11.67) | -1.54 (-2.21 to -0.73) ≤10 | 6.98 (3.76 to 19.60) | -5.34 (-8.59 to 7.24) ≤9 | 10.06 (3.37 to 32.97) | -2.26 (-8.97 to 20.64)
Supplement 1, eTable 2, stroke, main analysis (columns: no-intervention risk | ≤9 µg/m³ risk | risk difference):
Main analysis 12.32 (11.92, 12.72) 10.06 (3.37, 32.97) -2.26 (-8.97 to 20.64)
The two further discrepancies. Abstract, Results, stroke at 12 µg/m³:
the estimated 5-year risk difference of hospitalization for stroke was -1.54 per mille (95% CI, -2.21 to 0.73 per mille). However, the reduction in risk for arrhythmia was not statistically significant
Results text, stroke at 12 µg/m³, which agrees with Table 2:
the estimated 5-year risk difference of hospitalization for stroke was -1.54 per mille (95% CI, -2.21 to -0.73 per mille)
Results text, heart failure at 10 µg/m³:
for heart failure, -2.15 per mille (95% CI, -3.55 to -0.35 per mille)
Table 2, heart failure row ≤10:
≤10 | 4.35 (2.95 to 6.89) | -2.15 (-3.55 to 0.35)
Heart failure at 12 µg/m³, which agrees between the Results text and Table 2:
for heart failure, -0.51 per mille (95% CI, -1.07 to 0.35 per mille)
The significance criterion, from Methods, Statistical Analysis:
Two-sided P < .05 was considered statistically significant.
The statements that build on these results. Discussion, first paragraph:
Our findings indicate a decreased 5-year risk of hospitalization with a primary diagnosis of stroke, myocardial infarction, or heart failure for the hypothetical intervention of reducing PM2.5 exposure by 5% if it is above the annual average standards of 12 µg/m3, 10 µg/m3, or 9 µg/m3 compared with no intervention on ambient PM2.5. However, the 5-year risk difference was not statistically significant for the hospitalization with a primary diagnosis of arrhythmia.
Discussion, comparison with earlier studies:
While our study found decreased 5-year risks of stroke, myocardial infarction, and heart failure for the hypothetical PM2.5 intervention, the risk difference was not statistically significant for the outcome of arrhythmia.
Conclusions:
Our results indicate that a more stringent ambient PM2.5 standard in the United Kingdom may lower the risk of hospitalization for stroke, myocardial infarction, and heart failure.
What the paper's own numbers show
Method. Table 2 gives, for each of four outcomes, the 5-year risk with no intervention (the reference) and under each of the three threshold interventions, each with a 95% CI, plus the risk difference (RD) with its own 95% CI. I made two checks from Table 2 alone. (a) The RD point estimate should equal the intervention risk minus the reference risk. (b) The RD CI should be close to the intervention-risk CI minus the reference point estimate. Check (b) is an approximation: it ignores the uncertainty in the reference risk and its correlation with the intervention risk. It works here because the reference risks are estimated far more precisely (for stroke, 11.92 to 12.72) than the intervention risks (for stroke at 9 µg/m³, 3.37 to 32.97). I measured the approximation's accuracy against all 24 Table 2 RD bounds and used that accuracy as the yardstick for the text-versus-table discrepancies. Every number below is printed by recompute.py.txt.
| Quantity | Location | Reported | Recomputed from the paper's numbers |
|---|---|---|---|
| Accuracy of check (a), all 12 RD point estimates | Table 2 | — | every RD equals risk(intervention) − risk(no intervention) within 0.010 per mille (rounding) |
| Accuracy of check (b), all 24 RD CI bounds | Table 2 | — | every bound within 0.22 per mille of risk CI − reference risk (largest gap: arrhythmia ≤10 upper, 1.28 vs 1.06) |
| Stroke RD, ≤9 µg/m³ | Abstract; Results text | −2.26 (−8.97 to −20.64) | lower bound > upper bound; −2.26 is outside the interval, and stays outside if the bounds are reordered (−20.64 to −8.97) |
| Stroke RD, ≤9 µg/m³ | Table 2; eTable 2 | −2.26 (−8.97 to 20.64) | 10.06 − 12.32 = −2.26; (3.37 − 12.32, 32.97 − 12.32) = (−8.95 to +20.65). Includes 0 |
| Stroke RD upper bound, ≤9 µg/m³ | — | — | text vs recomputed: 41.29 apart; Table 2 vs recomputed: 0.01 apart. Using either end of the reference CI instead of 12.32 gives 20.25 to 21.05, so the bound is positive in every case |
| Stroke RD, ≤9 µg/m³, three robustness checks | eTable 2 | −3.39 (−9.25 to 18.47); −2.26 (−9.30 to 20.49); −4.02 (−9.26 to 14.91) | (−9.17 to 18.39); (−9.27 to 20.54); (−9.20 to 15.05). All include 0 |
| Stroke RD, ≤12 µg/m³ | Abstract | −1.54 (−2.21 to 0.73) | Table 2 and Results text: −2.21 to −0.73; recomputed (−2.25 to −0.65). The abstract's upper bound is 1.38 from the recomputed value, against 0.08 for Table 2 |
| Heart failure RD, ≤10 µg/m³ | Results text | −2.15 (−3.55 to −0.35) | Table 2: −3.55 to 0.35; recomputed (−3.55 to +0.39). The text's upper bound is 0.74 from the recomputed value, against 0.04 for Table 2. Includes 0 |
| Heart failure RD, ≤12 µg/m³ | Results text; Table 2 | −0.51 (−1.07 to 0.35) | recomputed (−1.13 to +0.41). Consistent, and includes 0 |
| Stroke RD, ≤10 µg/m³ | Results text; Table 2 | −5.34 (−8.59 to 7.24) | recomputed (−8.56 to +7.28). Consistent, and includes 0 |
| Myocardial infarction RD, ≤12 and ≤9 µg/m³ | Results text; Table 2 | −1.41 (−1.98 to −0.67); −8.64 (−9.16 to −6.38) | recomputed (−2.03 to −0.62); (−9.12 to −6.44). Consistent, and both exclude 0 |
| Heart failure RD, ≤9 µg/m³ | Abstract; Results text; Table 2 | −3.20 (−4.16 to −1.25) | recomputed (−4.10 to −1.30). Consistent, and excludes 0 |
| All other text values (abstract and Results text) | — | — | identical to Table 2 |
The paper does not report P values for the main risk differences. When a test and its 95% CI are derived consistently, a CI that includes zero corresponds to a two-sided P ≥ .05, which is the paper's own significance threshold. By Table 2, the significance of each risk difference is:
| Outcome | ≤12 µg/m³ | ≤10 µg/m³ | ≤9 µg/m³ |
|---|---|---|---|
| Stroke | significant | not significant | not significant |
| Myocardial infarction | significant | significant | significant |
| Heart failure | not significant | not significant (the Results text's −0.35 would make it appear significant) | significant |
| Arrhythmia | not significant | not significant | not significant |
The Key Points claim six significant reductions (stroke, heart failure and myocardial infarction, each at 12 and 9 µg/m³). Table 2 supports four of them. The two it does not support are stroke at 9 µg/m³, where only the impossible text interval excludes zero, and heart failure at 12 µg/m³, where the text and the table agree that the interval includes zero.
One further, minor observation. In Figure 3 of the paper (a forest plot of the 9 µg/m³ main analysis and robustness checks), the stroke main-analysis interval is drawn crossing the zero line, ending near 0.02 on the axis. That agrees with Table 2. The axis is labeled "per mille", but its tick values (−0.02 to 0.03) appear to be on the proportion scale, where 0.02 corresponds to 20 per mille.
Figure
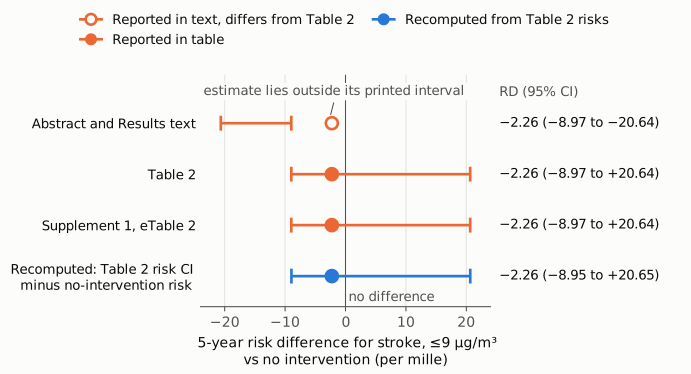
Figure 1. The 5-year stroke risk difference for the 9 µg/m³ intervention versus no intervention, in per mille, on one linear axis. Orange marks are values printed in the paper; the hollow orange marker is the text value that disagrees with Table 2. Blue is the interval recomputed as the Table 2 risk CI under the intervention (3.37 to 32.97) minus the no-intervention risk (12.32). The thin vertical line is zero difference. The interval printed in the Abstract and Results text (−8.97 to −20.64) lies entirely to the left of its own point estimate. Table 2, eTable 2 and the recomputation agree on an interval of about −9 to +20.6, which includes zero. Plus signs in the value column are added for clarity; the paper prints positive bounds without a sign.
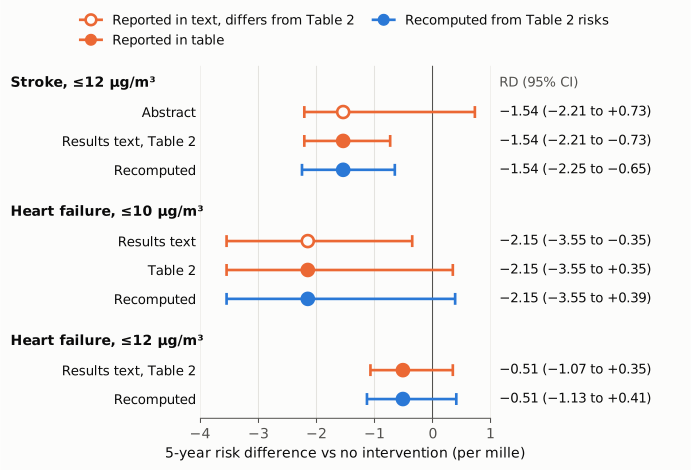
Figure 2. Three risk differences on one linear axis (per mille), using the same encoding as Figure 1. For stroke at 12 µg/m³, the Abstract prints an upper bound of +0.73. The Results text and Table 2 print −0.73, and the recomputed bound is −0.65. For heart failure at 10 µg/m³, the Results text prints −0.35, while Table 2 prints +0.35 and the recomputed bound is +0.39. In both cases the recomputation sides with Table 2, within the approximation's measured accuracy of 0.22 per mille. Heart failure at 12 µg/m³ is printed consistently, and its interval includes zero. Even so, the Key Points describe it as a significant reduction.
Why it matters
The 9 µg/m³ threshold is the one the paper ties to the US EPA primary annual standard, and the Abstract reports the 9 µg/m³ results first. The impossible stroke interval appears twice, in the Abstract and in the Results text. In both places all of the printed interval lies below zero, which makes the stroke reduction look statistically significant. The paper's own table says otherwise. Under the correct interval (−8.97 to +20.64 per mille) the data are compatible with anything from about a 9 per mille decrease to a 21 per mille increase in 5-year stroke hospitalization risk. Stroke is also not significant at 10 µg/m³, and it is not significant in any of the three robustness checks at 9 µg/m³. So the paper's data support a significant stroke reduction only at 12 µg/m³.
The Key Points sentence ("thresholds of 12 and 9 µg/m3 would significantly reduce ... stroke, heart failure, and myocardial infarction") is what most readers take from the article. Read naturally, it is not supported by Table 2 for stroke at 9 µg/m³ or for heart failure at 12 µg/m³. The Discussion's first paragraph lists decreased risk of stroke, myocardial infarction and heart failure at all three thresholds and contrasts them with arrhythmia, which "was not statistically significant". Read that way, the paragraph implies significance for stroke at 10 and 9 µg/m³ and for heart failure at 12 and 10 µg/m³, none of which Table 2 supports. The point estimates are all negative, so "decreased" is accurate as a description of direction only.
The scope of the problem is limited. Myocardial infarction is significant at every threshold, and heart failure at 9 µg/m³. The general conclusion that stricter PM2.5 standards may lower cardiovascular hospitalization is still supported by those results. What changes is the outcome-specific claim, which for stroke matters at the threshold most relevant to current policy.
Explanations considered
- A sign slip when the table values were transcribed into the text. This is the most plausible explanation, and it accounts for all three discrepancies. In each case one bound differs from Table 2 only by its sign: −20.64 for +20.64, +0.73 for −0.73, and −0.35 for +0.35. Table 2 agrees with the recomputation each time. It does not, however, rescue the Key Points or the Discussion, which match the mistyped text value for stroke at 9 µg/m³ rather than the table.
- A conversion artifact in PMC. Ruled out. The publisher's version of record, the Europe PMC full-text XML and the PMC page all print the same values.
- Table 2 is wrong and the text is right. Ruled out for stroke at 9 µg/m³. The text interval does not contain its own estimate, so it cannot be a valid confidence interval on any scale. Table 2's upper bound matches the risk CI (32.97 − 12.32 = 20.65). eTable 2 gives the same value, and the paper's Figure 3 draws the interval across zero. For the other two discrepancies, the recomputation sides with the table (0.08 and 0.04 per mille away) and not with the text (1.38 and 0.74 away). The approximation's largest error across all 24 table bounds is 0.22 per mille.
- The text uses a different interval method (for example a transformed scale or a different bootstrap). Ruled out for stroke at 9 µg/m³. Any valid interval contains its point estimate, and reordering the printed bounds (−20.64 to −8.97) still excludes −2.26. For the other two, nothing in the Methods describes a second interval method, and the remaining text values match Table 2 exactly.
- The recomputation itself is too crude. It cannot account for the numbers. Check (b) is only an approximation, but across all 24 Table 2 bounds it is accurate to 0.22 per mille. For stroke at 9 µg/m³ the discrepancy is 41 per mille. Using either end of the reference CI in place of its point estimate still gives an upper bound of 20.25 to 21.05.
- The Key Points use a looser reading of "12 and 9". This is possible. If the sentence means only that each outcome is significantly reduced at one or other threshold, Table 2 supports it: stroke at 12, heart failure at 9, myocardial infarction at both. But the Abstract's printed stroke interval at 9 µg/m³ lies wholly below zero, and the Discussion claims decreased risk at all three thresholds in contrast to the non-significant arrhythmia result. Both point to the stricter reading, under which two of the six claimed reductions are not significant.
- Significance was judged by P values rather than CIs. The paper reports no P values for the main risk differences, only CIs. The stated criterion is two-sided P < .05. With a consistently derived 95% CI that includes zero, that criterion is not met.
Status
As of 2026-10-23:
- Version of record. The publisher's full text (jamanetwork.com, article 2840619, reached through the doi.org redirect), the Europe PMC full-text XML and the PMC HTML page all carry the same numbers, with true minus signs (U+2212). In each, the Abstract and the Results text print the stroke interval at 9 µg/m³ as "−8.97 to −20.64", and Table 2 prints "−8.97 to 20.64". The Abstract's stroke interval at 12 µg/m³ (−2.21 to 0.73) and the Results text's heart failure interval at 10 µg/m³ (−3.55 to −0.35) also appear in the version of record. Every quote above was checked verbatim against the PMC-archived text.
- Supplements checked. Supplement 1 (eAppendices 1–2, eMethods, eTable 1 on subgroups, eTable 2 on the main analysis and robustness checks, eFigures 1–4). Its eTable 2 agrees with Table 2 for stroke at 9 µg/m³ (−2.26, −8.97 to 20.64), and all three stroke robustness checks include zero. Supplement 2 is the data sharing statement. Both were taken from the Europe PMC supplementary-files archive. The paper's Figure 3 image was also checked, and it draws the stroke interval at 9 µg/m³ across zero.
- Corrections and comments. I found no correction, erratum, retraction or expression of concern. Crossref lists no update-to or updated-by relations for the DOI. PMC has no linked notice. Europe PMC (PMID 41148138) has no comment/correction list, and a Europe PMC search for an erratum under the title returned nothing. Neither the publisher's page nor the PMC page shows a notice. PubPeer could not be checked, because its search page returned HTTP 403 to automated access and the API was blocked. A general web search was not available for this check.
Suggested correction
- In the Abstract (Results) and the Results text, change the stroke risk difference at 9 µg/m³ to "−2.26 per mille (95% CI, −8.97 to 20.64 per mille)", to match Table 2 and eTable 2.
- In the Abstract, change the stroke interval at 12 µg/m³ to "−2.21 to −0.73 per mille". In the Results text, change the heart failure interval at 10 µg/m³ to "−3.55 to 0.35 per mille".
- Revise the Key Points to match Table 2. For example: the 12 and 9 µg/m³ thresholds significantly reduced the risk for myocardial infarction. The reduction for stroke was significant at 12 µg/m³ but not at 10 or 9 µg/m³. The reduction for heart failure was significant at 9 µg/m³ but not at 12 or 10 µg/m³. No threshold significantly reduced the risk for arrhythmia.
- Revise the first Discussion paragraph and the comparison paragraph so that they do not imply significant stroke reductions at 10 and 9 µg/m³ or significant heart failure reductions at 12 and 10 µg/m³. Qualify the Conclusions sentence on stroke accordingly.
- Minor: check the Figure 3 axis, whose tick values appear to be proportions although the label says per mille.