← Back to the plain-language case
Abstract's per-case costs for Xpert Ultra and TB-LAMP do not match Table 2, and the paper's model output rests on two different Xpert test costs
BMJ Glob Health (2025) · doi:10.1136/bmjgh-2025-019270 · PMC12336617
Summary
The abstract gives the cost per TB case detected as US$17 for TB-LAM, US$20 for Xpert MTB/RIF Ultra and US$22 for TB-LAMP. The Results text and Table 2 give US$16.78, US$14.59 and US$20.11. These round to 17, 15 and 20, so the TB-LAM figure agrees and the other two do not.
The paper's decision tree (its Figure 1) shows where Table 2 comes from and why the paper also prints a second Xpert figure. Rebuilt from its own node values, the tree reproduces Table 2's costs, effects and all three NMBs exactly, and the Figure 1 ICER label of 186.55 (Table 2's 187.18 follows from its rounded entries). But its Xpert branch uses a test cost of US$7.97, which is Table 1B's Xpert reagents line. Table 1B's Xpert total is US$19.09 and the Results text gives US$21.01. Run with US$21.01, the same tree gives US$21.80 for Xpert. This matches the Discussion's US$21.79 and, to the cent, the Table 3 Xpert value (2729.29). The abstract's US$20 matches neither run. It would need an Xpert test cost of US$17.75, which the paper does not print.
The error matters because the two runs order the strategies differently. In Table 2, Xpert is the cheapest strategy and TB-LAM costs US$2.19 more per case. With the full Xpert test cost, TB-LAM is cheaper and also more effective, so it dominates, as the Discussion says. The abstract's figures also put TB-LAM below Xpert. TB-LAM has the highest net monetary benefit in every version, so the paper's main recommendation does not depend on which figures are right.
What the paper reports
Abstract, Results:
TB/LAM was found to be the most cost-effective option at a cost of US$17 per TB case detected when compared with US$20 and US$22 per TB case detected for the baseline strategy of Xpert MTB/RIF Ultra and TB-LAMP, respectively. These ICERs are consistent with willingness-to-pay thresholds set at three times Nigeria’s gross domestic product (GDP) and remained robust over a wide range of costs and epidemiological parameter inputs.
Results, "Testing of TB in PLWH", first paragraph:
TB-LAM was found to be the most cost-effective diagnostic strategy, at a cost of US$16.78 per TB case detected, compared with US$20.11 for TB-LAMP and US$14.59 for Xpert MTB/RIF Ultra (table 2).
While the per test costs for TB-LAM, TB-LAMP and Xpert MTB/RIF Ultra were US$11.92, US$17.62 and US$21.01, respectively (as shown in table 1B); multiple individuals with presumptive TB must be tested to identify a single confirmed TB case, especially given the estimated TB prevalence among PLWH of 22%.
Results, "Decision model":
Figure 1 presents a decision tree model outlining the diagnostic pathways and associated accuracy probabilities, utility and cost calculations for the four modalities. It incorporates data from table 1A, B.
Figure 1 (decision tree, PMC image bmjgh-10-8-g001.jpg). The node labels have the form "($) cost; (c) effect". I transcribed them from the image.
Xpertgene_Ultra_algo ("ICER: Baseline"): root ($) 14.5994; (c) 0.521. Active TB ($) 12.4316; (c) 0.986. No active TB ($) 15.1414; (c) 0.4048. Xpert node after a negative CXR ($) 18.17; (c) 0.95 under Active TB, and ($) 18.17; (c) 0.04 under No active TB.
TB LAM_algo ("ICER: 186.5503"): root ($) 16.7798; (c) 0.5327. Active TB ($) 13.5376; (c) 0.918. No active TB ($) 17.5904; (c) 0.4364. LAM node ($) 22.12; (c) 0.707 and ($) 22.12; (c) 0.091.
TB LAMP_algo ("ICER: Strongly Dominated"): root ($) 20.1139; (c) 0.5085. Active TB ($) 15.2288; (c) 0.8986. No active TB ($) 21.3352; (c) 0.411. LAMP node ($) 28.16; (c) 0.638 and ($) 28.16; (c) 0.05.
Terminal payoffs: "cost_cxr; (c) post_case" after a positive CXR, and "cost_cxr+cost_ultra" (or +cost_LAM, +cost_LAMP) after a negative CXR. The counts printed at the right of the Xpert branches are 144.0, 53.2 and 2.8 under Active TB, and 304.0, 19.84 and 476.16 under No active TB.
Table 2, "Cost-effectiveness of results for XpertMTB/RIF, TB LAMP and TB LAM per additional TB case detected" (footer: "Willingness to pay ($5280).*Difference."):
Testing options | Cost | Effect | *Cost | *Effect | ICER | Dominance | NMB
Xpert MTB/RIF (ULTRA) | $14.59 | 0.521 | – | – | | | 2736.49
TB LAM | $16.78 | 0.5327 | 2.19 | 0.0117 | 187.1794 | | 2796.02
TB LAMP | $20.11 | 0.5085 | $3.33 | -0.0242 | -137.60 | Strongly Dominated | 2664.91
Table 1A (mean values):
TB prevalence among PLWH | Prevalence | 0.22†
CXR | Sensitivity | 0.72
CXR | Specificity | 0.62
Table 1B (columns Xpert MTB/RIF Ultra, TB LAM, Chest X-ray, TB LAMP, Source):
Reagents | 7.97 | 3.5 | 0 | 6 | 4 32 33
Total cost | 19.09 | 11.92 | 10.2‡ | 17.62 | 16
Figure 2 legend:
A vertical dashed red line indicates the baseline ICER ($187).
Discussion, second paragraph:
As detailed in table 3, TB LAM outperformed Xpert MTB/RIF Ultra and TB LAMP in terms of both cost and diagnostic yield. TB LAM had a cost of US$16.78 and an effectiveness of 0.532, surpassing Xpert MTB/RIF Ultra (US$21.79, effectiveness 0.521) and TB LAMP (US$20.11, effectiveness 0.506). The ICER for TB LAM was calculated at US$124.72 per additional case detected, further confirming its financial and clinical advantage.
Discussion, fifth paragraph:
Xpert MTB/RIF Ultra, though offering rapid diagnostics, was found to be less favourable due to its higher cost and lower cost-effectiveness.
Table 3, "Value of information analysis for TB screening strategies", strategy rows (column headed "Expected value of perfect information (EVPI)"):
TB LAMP_algo | $2678.22
TB LAM_algo | $2796.02
Xpertgene_Ultra_algo | $2729.29
Methods, "Willingness to pay":
We adopted Nigeria’s gross domestic product (GDP) per capita value of US$1760, such that willingness to pay would be presumed to be three times this amount (US$5280).
What the paper's own numbers show
Method. I compared the abstract's three costs with the Results text and Table 2, and with their rounding to whole dollars. I checked that Table 2 holds together: each increment should be the difference between rows, each ICER the ratio of the increments, and each NMB should equal 5280 × effect − cost. I then rebuilt the Figure 1 tree. Each strategy starts with a CXR (US$10.20, sensitivity 0.72, specificity 0.62, from Table 1A/B). A positive CXR ends the branch, and a negative CXR is followed by the confirmatory test. The strategy cost is therefore 10.20 + P(CXR negative) × test cost. I read each test cost off the tree as its test node minus 10.20, rolled the tree back at the prevalence the figure uses, and compared every node with the printed value. I then reran the Xpert branch with each Xpert test cost printed in the paper (7.97, 19.09, 21.01 and the component sum 21.89). For the Discussion's ICER of 124.72, I tried every ratio (cost difference ÷ effect difference) that can be formed from the paper's strategy-level costs (per case and per test: the Table 2, Discussion and abstract values, the per-test costs, the CXR cost and the Xpert reagents line, 13 values in all) and its five strategy-level effects (0.521, 0.5327, 0.5085, 0.532, 0.506). I then repeated the search with the node-level and component values added, to see how specific a match is. I also compared each test's sensitivity and specificity at the tree nodes with Table 1A. Every number below is printed by recompute.py.txt.
| Quantity | Location | Reported | Recomputed from the paper's own numbers |
|---|---|---|---|
| TB-LAM cost per case detected | Abstract vs Results, Table 2 | US$17 vs US$16.78 | 16.78 rounds to 17: consistent |
| Xpert Ultra cost per case detected | Abstract vs Results, Table 2 | US$20 vs US$14.59 | 14.59 rounds to 15; the abstract is 5.41 higher |
| TB-LAMP cost per case detected | Abstract vs Results, Table 2, Discussion | US$22 vs US$20.11 | 20.11 rounds to 20; the abstract is 1.89 higher |
| Xpert Ultra cost per case detected | Discussion | US$21.79 | rounds to 22; a third value, different from both the abstract (20) and Table 2 (14.59) |
| Cost order of the three strategies | Abstract / Table 2 / Discussion | — | LAM < Xpert < LAMP / Xpert < LAM < LAMP / LAM < LAMP < Xpert |
| ΔCost, ΔEffect, ICER of LAM vs Xpert | Table 2; Figure 2 legend | 2.19, 0.0117, 187.1794 ($187) | 16.78 − 14.59 = 2.19; 0.5327 − 0.521 = 0.0117; 2.19 / 0.0117 = 187.18 |
| ΔCost, ΔEffect, ICER of LAMP vs LAM | Table 2 | 3.33, −0.0242, −137.60 | 3.33; −0.0242; −137.60 |
| Test cost used in each tree branch | Figure 1 test nodes | Xpert 18.17, LAM 22.12, LAMP 28.16 | minus CXR 10.20: Xpert 7.97 (Table 1B reagents line, not the 19.09 total), LAM 11.92 (= Table 1B total), LAMP 17.96 (Table 1B total 17.62) |
| Xpert nodes, rebuilt | Figure 1 | Active TB 12.4316 / 0.986; No active TB 15.1414 / 0.4048; root 14.5994 / 0.521 | 0.72 × 10.20 + 0.28 × 18.17 = 12.4316; 0.38 × 10.20 + 0.62 × 18.17 = 15.1414; 0.2 × 12.4316 + 0.8 × 15.1414 = 14.5994; effects 0.986, 0.4048, 0.52104 |
| LAM and LAMP nodes, rebuilt | Figure 1 | LAM root 16.7798 / 0.5327; LAMP root 20.1139 / 0.5085 | 16.7798 / 0.53273; 20.1139 / 0.50853; all six branch nodes also match |
| ICER of LAM vs Xpert from the tree | Figure 1 label; Table 2 | 186.5503; 187.1794 | 186.5503 from unrounded tree values; 187.18 comes from the rounded Table 2 entries |
| NMB from the unrounded tree values | Table 2 | 2736.49 / 2796.02 / 2664.91 | 2736.49 / 2796.02 / 2664.91 (exact). From Table 2's rounded effects they come out 0.14 to 0.20 lower |
| Xpert cost per case, tree rerun with each printed Xpert test cost | Table 1B reagents / Table 1B total / Results text / component sum | 7.97 / 19.09 / 21.01 / 21.89 | 14.60 / 20.74 / 21.80 / 22.28 |
| Xpert value in Table 3 | Table 3 | 2729.29 | tree with Xpert test cost 21.01: NMB 2729.29 (exact); cost implied by 2729.29 is 21.80, i.e. a test cost of 21.02 |
| Xpert test cost needed for the abstract's US$20 | Abstract | US$20 | (20 − 10.20) / 0.552 = 17.75, printed nowhere in the paper |
| LAM − Xpert cost per case | Table 2; tree with Xpert at 21.01 | +2.19 | +2.18 with Xpert at 7.97; −5.02 with Xpert at 21.01 (LAM then cheaper and more effective) |
| Prevalence used by the tree | Figure 1 vs Table 1A, Results text | 0.22 (22%) | the Figure 1 node values and cohort counts reproduce only at 0.20 (200 with TB per 1000); at 0.22 the Xpert root would be 14.5452 |
| ICER of LAM vs Xpert using the Discussion's costs and effects | Discussion | US$124.72 | (16.78 − 21.79) / (0.532 − 0.521) = −455.45 (LAM cheaper and more effective, i.e. dominant) |
| Ratios of strategy-level costs and effects that give 124.72 | — | — | over the 13 strategy-level costs and 5 strategy-level effects, only one ratio is within 0.05 (the script finds it in both sign orientations): (20.11 − 16.78) / (0.5327 − 0.506) = 124.72, the LAMP-minus-LAM cost difference over a LAM-minus-LAMP effect difference that uses the Discussion's LAMP effect |
| Same search with node-level and component values added | — | — | with the Figure 1 node values, Table 1B components, increments, NMB and Table 3 values, sensitivities, specificities and prevalences added (41 costs, 28 probabilities), 34 distinct ratios fall within 0.05 of 124.72, e.g. (21.01 − 14.5994) / (0.95 − 0.8986). With a pool this large, near-matches arise by chance, so these carry no weight. The strategy-level match above is the one built from the quantities an ICER compares |
| LAMP value in Table 3 | Table 3 | 2678.22 | implies a LAMP cost of 6.81 at the tree effect, below the CXR cost alone; it matches no run |
| NMB with the abstract's costs (Table 2 effects) | — | — | Xpert 2730.9, LAM 2795.7, LAMP 2662.9 |
| NMB with Table 2 costs; with Xpert at 21.80 | — | — | LAM highest in both (2796.0 vs Xpert 2736.5 or 2729.3, LAMP 2664.9) |
| Xpert per-test cost | Table 1B total vs components vs Results text | 19.09; 21.01 | components 7.97 + 5.11 + 5.92 + 2.89 = 21.89. The LAM (11.92) and LAMP (17.62) totals equal their component sums |
| TB-LAM accuracy used by the tree | Figure 1 LAM nodes vs Table 1A | sensitivity (c) 0.707; false-positive (c) 0.091 | Table 1A gives sensitivity 0.701 and specificity 0.91 (false-positive 0.09). The LAM nodes reproduce only with 0.707 and 0.091 (0.72 + 0.28 × 0.707 = 0.91796 → 0.918; with 0.701, 0.91628; 0.38 + 0.62 × 0.091 = 0.43642 → 0.4364; with 0.09, 0.43580). The Results cohort (2200 × 0.701 = 1542.2 → 1542) and the supplement use 0.701 |
| TB-LAMP cases detected in a 10 000 cohort | Results text; Table 1A sensitivity 0.64 | 1404 (63.8%), missed 796 | 2200 × 0.64 = 1408 (missed 792); 1404 corresponds to 0.638, the value in Figure 1 and the online supplement |
Table 2 is the output of the Figure 1 tree. Every node in the figure can be rebuilt from Table 1A's CXR accuracy, a CXR cost of 10.20, a prevalence of 0.20, each test's sensitivity and specificity as shown at its node, and one test cost per strategy. The rebuilt tree gives the root costs and effects in Table 2, the Figure 1 ICER label of 186.5503, and all three Table 2 NMBs to the cent. For TB-LAM the test cost in the tree is the Table 1B total (11.92). For Xpert it is 7.97, which is only the reagents line of Table 1B. It is not the table's total (19.09), its component sum (21.89) or the per-test cost the Results text states (21.01). When the same tree is run with the Results text's 21.01, Xpert comes out at US$21.80, which is the Discussion's US$21.79 and reproduces Table 3's Xpert value of 2729.29 exactly. So the paper contains the output of two runs of one model. They differ only in the Xpert test cost. Table 2, the Results text, the Figure 1 labels and the tornado plot's dashed baseline line ($187) come from the 7.97 run. The Discussion's cost figures and Table 3's Xpert value come from the 21.01 run. The tornado plot's Xpert bars, read approximately, sit near the 21.01 run (see Status).
The abstract's figures match neither run. Its US$17 for TB-LAM is common to both. Its US$20 for Xpert is not 14.60, 20.74 (with 19.09), 21.80 or 22.28, and would need a test cost of 17.75. Its US$22 for TB-LAMP is not 20.11 in either run. In the 21.01 run, however, Xpert rounds to 22 and TB-LAMP to 20, which are the abstract's two numbers with the strategy labels exchanged. That would fit a labelling slip in the abstract, but the paper does not say which run the abstract reports. Whichever Xpert test cost is intended, the abstract, the Results/Table 2 and the Discussion cannot all be correct together.
Figure
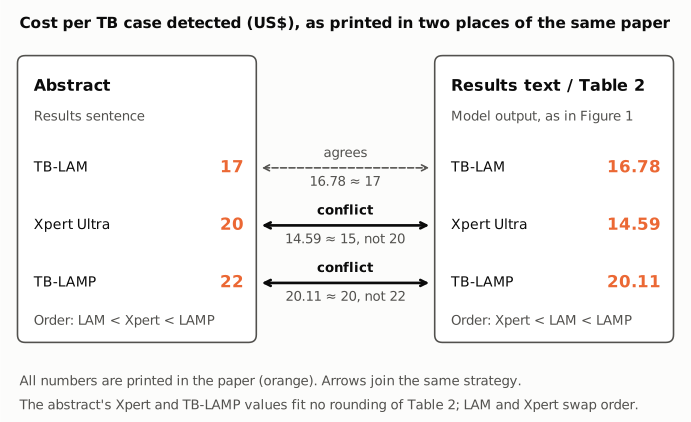
Figure 1. The cost per TB case detected (US$) as printed in the abstract's Results sentence (left) and in the Results text and Table 2 (right). All six numbers are copied from the paper. Arrows join the same strategy. The TB-LAM figures agree (16.78 rounds to 17). The Xpert Ultra figures (20 vs 14.59, which rounds to 15) and the TB-LAMP figures (22 vs 20.11, which rounds to 20) do not. As a result, the abstract puts TB-LAM below Xpert in cost, while Table 2 puts Xpert below TB-LAM.
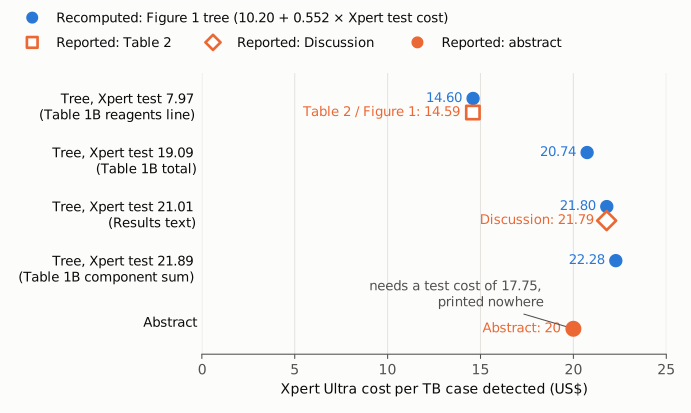
Figure 2. Xpert Ultra cost per TB case detected (US$, linear axis from zero). Blue: the paper's Figure 1 tree rebuilt and rerun with each Xpert test cost printed in the paper (cost per case = 10.20 + 0.552 × test cost at the tree's prevalence of 0.20). Orange: the values the paper reports. Table 2's 14.59 matches the run with the reagents line alone (7.97). The Discussion's 21.79 matches the run with the Results text's per-test cost (21.01). The abstract's 20 matches no printed input.
Why it matters
- The abstract misstates the paper's headline result. The abstract's Results sentence is the only place in the abstract that quantifies the comparison. Its Xpert and TB-LAMP costs appear in neither model run.
- The cost ordering depends on which Xpert test cost is used, and the paper uses two. In Table 2 (Xpert test cost 7.97), Xpert is the cheapest strategy (US$14.59). TB-LAM costs US$2.19 more per case detected and is preferred because it is slightly more effective (0.5327 vs 0.521), at an ICER of about US$187 per additional case. With the per-test cost the Results text gives (21.01), Xpert costs US$21.80 and TB-LAM is both cheaper and more effective, so it dominates. That is the Discussion's statement that TB-LAM "outperformed Xpert MTB/RIF Ultra and TB LAMP in terms of both cost and diagnostic yield". These are different economic findings, and the paper presents the first as its result (Table 2, Figure 1, the $187 tornado baseline line) and the second in its Discussion. The 7.97 used in Table 2 is the Xpert reagents price alone. The LAM branch uses LAM's full cost (11.92), and Table 1B lists supply, labour and equipment costs for Xpert as well, so Table 2 probably understates Xpert's cost relative to TB-LAM. The abstract's figures also put TB-LAM below Xpert, but they match neither run.
- The reported ICERs disagree. Table 2 and the tornado plot's baseline line give US$187 for TB-LAM vs Xpert (Figure 1: 186.55). The Discussion gives US$124.72 "for TB LAM". With the Discussion's own costs, TB-LAM would be dominant, with no positive ICER against Xpert. The only combination of the paper's strategy-level costs and effects that reproduces 124.72 pairs the LAMP–LAM cost difference with a LAMP effect (0.506) that appears only in the Discussion.
- The recommendation does not change. At the paper's willingness to pay of US$5280, TB-LAM has the highest NMB under the abstract's costs (2795.7 vs 2730.9 and 2662.9), under Table 2's costs (2796.0 vs 2736.5 and 2664.9) and with Xpert at 21.80 (Xpert 2729.3). The NMB differences come almost entirely from the effect column, so a few dollars of cost cannot reorder them. This holds on the paper's own effect measure. See the side observations for what that measure counts. The issue is misreported key results and an Xpert cost input that is inconsistent with the paper's own cost table, not an overturned conclusion.
Explanations considered
- Rounding. This accounts for TB-LAM only (16.78 rounds to 17). Xpert's 14.59 rounds to 15 and TB-LAMP's 20.11 rounds to 20. No rounding convention turns them into 20 and 22.
- A different metric in the abstract, such as cost per test or incremental cost. Ruled out. The abstract says "per TB case detected", the same metric as Table 2 and the Results text. The per-test costs (LAM 11.92, LAMP 17.62, Xpert 7.97, 19.09 or 21.01) do not give 17, 20 and 22. The incremental costs in Table 2 (2.19 and 3.33) do not either.
- The abstract reports the run with the full Xpert test cost. Partly fits. In that run, Xpert is US$21.80, TB-LAM US$16.78 and TB-LAMP US$20.11, which round to 22, 17 and 20. The abstract has 17, 20 and 22, so the TB-LAM figure fits and the Xpert and TB-LAMP figures fit only with their labels exchanged. The tree with the Table 1B total of 19.09 gives Xpert US$20.74, which rounds to 21, not 20.
- Two model runs with different Xpert test costs. Confirmed from the paper's own figure. Table 2 and Figure 1 use an Xpert test cost of 7.97, the Table 1B reagents line. The Discussion's US$21.79 and Table 3's Xpert value of 2729.29 match the same tree run with 21.01, the per-test cost in the Results text. The Discussion's effects for LAM and LAMP (0.532, 0.506) also differ slightly from Table 2's (0.5327, 0.5085). The paper does not say which run is the base case, and it does not explain why 7.97 was used. Table 1B and the Results text both give a higher Xpert per-test cost.
- Probabilistic (mean) rather than deterministic results. Ruled out for the main numbers. Table 2 and Table 3's Xpert and LAM values are deterministic tree outputs, reproduced to the cent. Only Table 3's LAMP value (2678.22) matches no run, since it implies a LAMP cost of 6.81, below the CXR cost alone. That does not produce the abstract's figures either.
- A text-conversion artifact. Unlikely. The same numbers appear in the PMC HTML, the Europe PMC full-text XML and the PubMed abstract. The figures are plain digits with no superscripts or special characters to lose, and the Figure 1 image carries the same Table 2 values.
- Already corrected. No correction found (see Status).
- Side observations, not part of the main finding.
- Prevalence. The published tree uses a TB prevalence of 0.20. Its root values (0.2 × 12.4316 + 0.8 × 15.1414 = 14.5994; 0.2 × 0.986 + 0.8 × 0.4048 = 0.521) and its counts (200 with TB per 1000) reproduce only at that value. Table 1A, the Results text and the Discussion give 0.22 (22%). At 0.22 the Xpert root would be 14.5452.
- TB-LAMP inputs. The LAMP node (28.16 = 10.20 + 17.96) implies a LAMP test cost of 17.96, against Table 1B's 17.62. The tree uses a LAMP sensitivity of 0.638. Table 1A gives 0.64, and the cohort figure (1404, 63.8%) and the online supplement use 0.638.
- TB-LAM inputs. The tree's LAM node shows a sensitivity of 0.707 ("(c) 0.707") and a false-positive rate of 0.091, and the LAM branch values reproduce only with these. Table 1A gives a sensitivity of 0.701 and a specificity of 0.91 (false-positive rate 0.09), and the Results cohort (1542 = 2200 × 0.701) and the supplement use 0.701.
- Xpert per-test cost. Table 1B's Xpert total (19.09) is not the sum of its own components (21.89). The Results text gives a third value (21.01). The LAM and LAMP totals equal their components.
- What the effect column counts. In Figure 1 every positive result scores one effect unit, including a positive CXR and positive tests among people without TB. Of Xpert's effect of 0.521, 0.1972 comes from people with TB and 0.3238 from people without TB. TB-LAM's higher effect than Xpert (+0.0117) is the sum of −0.0136 among people with TB and +0.0253 among people without TB. Among people with TB, Xpert detects more, as the paper's cohort numbers (2090 vs 1542) show. The Figure 2 legend defines post_case as the "proportion of true-positive cases initiated on treatment".
- What the cost column is. The root value of the tree is the expected cost per person entering the pathway. It is not divided by the cases detected, although the Results text describes it as an average cost per TB case detected that "accounts for the cumulative testing required to detect each true TB case". Divided by the effect, the tree gives US$28.02 per positive result for Xpert, US$31.50 for TB-LAM and US$39.55 for TB-LAMP.
- Labels. The abstract calls the per-case costs "ICERs", which they are not. Table 3 shows strategy values under a column headed "Expected value of perfect information (EVPI)".
Status
- Version of record. The publisher's site (gh.bmj.com, through the doi.org redirect and at the article URL) returned HTTP 403 to automated requests, so I could not read BMJ's own HTML or PDF. I checked three copies of the publisher-deposited text instead: the PMC HTML page for PMC12336617, the Europe PMC full-text XML, and the PubMed abstract (PMID 40763982). All three carry the numbers quoted here. Every text quotation was checked verbatim against the PMC-archived text with
src/show.py. - Figures. I read the Figure 1 (decision tree) and Figure 2 (tornado plot) images as deposited in PMC (
bmjgh-10-8-g001.jpg,bmjgh-10-8-g002.jpg, from the Europe PMC supplementary bundle). The Figure 1 node values quoted above are transcribed from the image and were checked by rebuilding the tree inrecompute.py.txt. Every branch node reproduces. The tornado plot's horizontal axis is labelled "Cost per EV ($)". Its bars can only be read approximately from the image, so I do not rely on it for any number. Read approximately, the Xpert Ultra bars for the low-influence parameters (prev, cxr_sens, post_case, ultra_sens, ultra_spec) sit at about 21 to 22 and none lies near 14.59, which fits the 21.01 run (Xpert 21.80), not the 7.97 run. The TB-LAM bars sit at about 16 to 21. Only the labelled dashed baseline line ($187) matches the 7.97 run. - Supplements. The only supplement, online supplemental file 1 (
bmjgh-10-8-s001.docx, taken from the Europe PMC supplementary bundle; its checksum matches the one in the article XML), holds one table of cases detected and missed in a hypothetical cohort of 10 000 (TB-LAM 0.701 / 1542 / 658, Xpert 0.95 / 2090 / 110, TB-LAMP 0.638 / 1404 / 796). It has no cost figures. No model file (the Amua tree) or source data are published, although the Data Availability statement says data are in a public repository. - Corrections and comments. As of 2026-10-24 I found no correction, erratum, expression of concern or retraction.
src/known.pyreturns no Crossref update relations, PMC notices or Europe PMC notices. The Crossref record has empty update-to, updated-by and relation fields, and a Crossref search for updates to this DOI returns none. BMJ-style correction DOIs (…019270corr1,…corr2) do not resolve. The PubMed record has no CommentsCorrections entries. The PubPeer API returned no record (HTTP 404) for the DOI, and a web search for the title with "PubPeer" found no thread. - Sources. PMC article PMC12336617, including the Figure 1 (decision tree) and Figure 2 (tornado plot) images; Europe PMC full-text XML and supplementary files; PubMed 40763982; Crossref; PubPeer; https://doi.org/10.1136/bmjgh-2025-019270.
Suggested correction
The authors should confirm which Xpert MTB/RIF Ultra test cost the model is meant to use. The Figure 1 tree, and therefore Table 2, the Results text, the ICER of $187 and the tornado plot's baseline line, uses 7.97, which is Table 1B's reagents line alone. Table 1B gives a total of 19.09 (its components sum to 21.89), and the Results text gives 21.01. The TB-LAM branch uses TB-LAM's full per-test cost. Once the Xpert input is settled, the abstract, Table 2, the Results text, Figure 1 and the tornado plot (its bars and its baseline line) should all report the same run. On the paper's own tree, an Xpert test cost of 21.01 gives US$21.80 per case for Xpert, which matches the Discussion's US$21.79 and Table 3. With that cost TB-LAM (US$16.78) would be cheaper and more effective than Xpert, so it would dominate rather than have an ICER of $187. An Xpert test cost of 19.09 gives US$20.74. In either case the abstract's Xpert and TB-LAMP figures (US$20 and US$22) should be replaced by the values of the chosen run; neither run gives them as labelled. The Discussion's ICER of US$124.72 matches no comparison of TB-LAM with Xpert and should be recomputed. The prevalence used in the tree (0.20) should be reconciled with the 0.22 stated in Table 1A and the text, along with the LAMP test cost (17.96 in the tree, 17.62 in Table 1B), the LAMP sensitivity (0.638 vs 0.64), the TB-LAM sensitivity (0.707 in the tree; 0.701 in Table 1A, the Results cohort and the supplement), the TB-LAM false-positive rate (0.091 in the tree; 1 − 0.91 = 0.09 from Table 1A) and the Table 1B Xpert total (19.09 vs a component sum of 21.89).