← Back to the plain-language case
Settlement ANOVA reports F(12,80) = 0.771 with p < 0.001; that F gives p = 0.68
Proc Biol Sci (2025) · doi:10.1098/rspb.2025.0729 · PMC12187397
Summary
The Results report the host × tile interaction for zygote settlement as "ANOVA, F12,80 = 0.771, p < 0.001". The degrees of freedom match the stated 4 × 5 crossed design with n = 5 tiles per combination. On (12, 80) df, however, F = 0.771 has an upper-tail p of 0.678, and p < 0.001 would need F ≥ 3.16. Supplementary Table S6 prints the same F, and that F equals the table's own mean-square ratio (11000 / 14271), so the inconsistent entry is the p-value, not the F. The same table also prints p < 0.001 for the tile main effect, F(4,80) = 1.638, which gives p = 0.173. This is the only reported omnibus test of the settlement experiment, and the abstract and Discussion describe an "interactive effect" of host- and benthic-associated microbiota on settlement.
What the paper reports
All quotations are verbatim from the article as archived in PMC (checked with src/show.py), except the Table S6 excerpt, which is from the electronic supplementary material.
Methods, "Effect of disruption of host and benthic microbiota on zygote settlement", second paragraph:
Zygotes, released and fertilized by the macroalgal individuals used in the host experiment described above, were introduced to the tiles in an experimental design in which all host and tile treatments were crossed (20 treatment combinations; n = 5 tiles and females per treatment combination).
Methods, "Statistical analyses":
to test for the effect of host and tile microbial disruption on zygote settlement we used a two-factor ANOVA (host and tile factors, fixed, crossed, 4 and 5 levels, respectively) using the GAD package in R (v.4.0.3).
Post hoc contrasts (emmeans R package) were used to examine significant main effects or interactions, as appropriate.
Results, "Effect of microbial disruption on settlement of zygotes", first sentence:
Disruption to the host- and tile-associated microbiota caused significant, but complex and interactive, effects on the settlement of Hormosira’s zygotes (ANOVA, F12,80 = 0.771, p < 0.001, electronic supplementary material, table S6, figure 4).
Same section, second paragraph:
Furthermore, post hoc tests showed that all tiles where the microbiota was disrupted by autoclaving had significantly lower levels of settlement (by approximately 7%) than those that were not autoclaved, which was generally consistent across all host treatments (electronic supplementary material, table S6).
Abstract:
Disruption of host- and benthic-associated microbiota, in combination, caused a significant decrease in settlement of H. banksii zygotes, with the combined disruption having the greatest impact on settlement success. Our results demonstrate the importance of host-associated microbiota in macroalgal reproduction and an interactive effect of host- and benthic-associated microbiota on settlement
Discussion, first paragraph:
Furthermore, microbiota associated with both the adult host and the benthic substratum had a strong interactive effect on zygote settlement and morphogenesis.
Electronic supplementary material (rspb20250729_si_001.docx), Supplementary Table 6, ANOVA rows (columns Df | Sum of Sq | Mean Sq | F | P-value):
Host Treatment | 3 | 34724483 | 11574828 | 811.063 | <0.001
Tile Treatment | 4 | 93486 | 23371 | 1.638 | <0.001
Host Treatment * Tile Treatment | 12 | 132002 | 11000 | 0.771 | <0.001
Residual | 80 | 1213050 | 14271 | |
What the paper's own numbers show
Method. I derived the degrees of freedom from the design stated in the Methods (4 host levels × 5 tile levels × 5 tiles = 100 observations) and compared them with the printed df. I then computed the upper-tail p-value of each printed F on its printed df with scipy.stats.f. For each row of Table S6 I also checked SS / df against the printed mean square and MS / MSresidual against the printed F. Every number below is printed by recompute.py.txt.
| Quantity | Location | Reported | Recomputed from the paper's own numbers |
|---|---|---|---|
| df of the host × tile interaction; residual df | Results; Table S6; design in Methods | 12; 80 | (4 − 1)(5 − 1) = 12; 100 − 20 = 80 (match) |
| p for host × tile, F(12,80) = 0.771 | Results, settlement; Table S6 | < 0.001 | 0.678 (upper tail); lower tail 0.322 |
| F(12,80) needed for p < 0.001 (for p < 0.05) | derived | — | ≥ 3.162 (≥ 1.875) |
| Host × tile F from Table S6 mean squares | Table S6 | 0.771 | 11000 / 14271 = 0.771 (match) |
| p for tile, F(4,80) = 1.638 | Table S6 | < 0.001 | 0.173; p < 0.001 would need F ≥ 5.123 |
| Tile F from Table S6 mean squares | Table S6 | 1.638 | 23371 / 14271 = 1.638 (match) |
| p for host, F(3,80) = 811.063 | Table S6 | < 0.001 | 9 × 10-60 (consistent) |
| Residual mean square | Table S6 | 14271 | 1213050 / 80 = 15163.1 (the printed value equals SS / 85.00) |
| F and p with residual MS = SS / 80 | derived from Table S6 | — | host × tile F = 0.725, p = 0.723; tile F = 1.541, p = 0.198; host F = 763.4, p = 1 × 10-58 |
| Same F = 0.771 on the other df of this design | derived | — | (3,80): p = 0.514; (4,80): p = 0.547; (19,80): p = 0.733 |
| Reproductive output, F(3,96) = 812.7 | Results, reproductive output | p < 0.001 | df match 4 groups × 25; p = 4.5 × 10-68 (consistent) |
The df, the F values and the mean squares of Table S6 agree with one another, so the F of 0.771 is what the tabulated sums of squares produce. The entries that do not fit are the p-values for the interaction and for the tile main effect. An F of 0.771 lies below the mean of the F(12,80) distribution (1.026) and below its median (0.953); it is a value expected when the interaction has no effect at all. The residual mean square printed in Table S6 does not equal its own SS / df. Using SS / 80 makes the residual larger and both F values smaller, so it widens the gap rather than closing it.
Figure
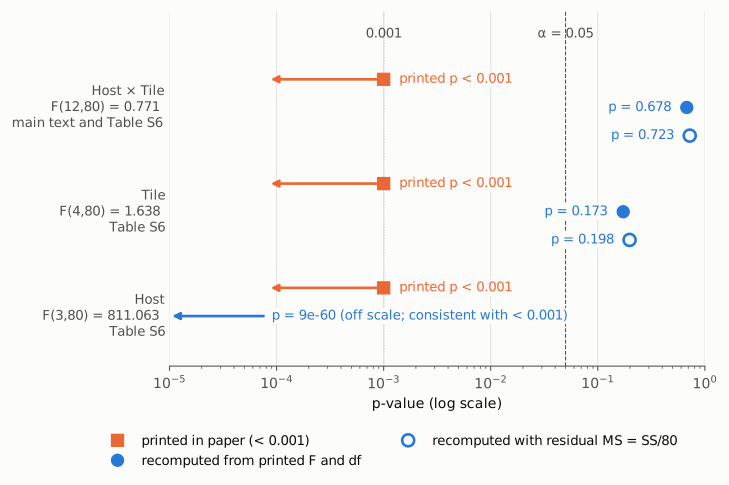
Figure 1. p-values on one log axis for the three terms of the settlement ANOVA in Table S6. Orange squares with leftward arrows are the printed values, all "< 0.001" (upper bounds). Filled blue circles are the upper-tail p-values recomputed from the printed F and df. Open blue circles use the residual mean square recomputed as SS / 80 = 15163.1 in place of the printed 14271. The dashed line marks α = 0.05 and the dotted line 0.001. For the host term the recomputed p (9 × 10-60) is off the left edge of the axis and agrees with the printed bound. For the host × tile interaction (p = 0.678) and the tile main effect (p = 0.173) the recomputed values lie above 0.05 whichever residual mean square is used.
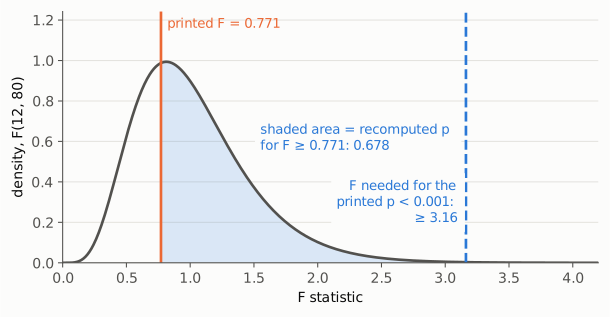
Figure 2. Density of the F(12, 80) distribution, which is the reference distribution for the host × tile test when there is no interaction. The orange line is the printed F = 0.771; the shaded area to its right, 0.678, is the recomputed p-value. The dashed blue line at 3.16 is the smallest F that would give p < 0.001 on these df. The figure shows that the printed F is an unremarkable value under the null hypothesis of no interaction, not one in the extreme tail.
Why it matters
- The interaction claim rests on this test. The Results present the host × tile ANOVA as evidence of "significant, but complex and interactive, effects" on settlement, and the abstract and Discussion state "an interactive effect" and "a strong interactive effect" of host- and benthic-associated microbiota. The printed F and Table S6 sums of squares instead give p = 0.678 for the interaction, which does not reject additivity.
- The tile main effect is not significant on the printed numbers either. Table S6 gives F(4,80) = 1.638 for tile treatment, p = 0.173. The paper's statements that autoclaved tiles had lower settlement, and that AB2 tiles mattered only in combination with host disruption, are drawn from post hoc contrasts. By the paper's own rule, post hoc contrasts "were used to examine significant main effects or interactions, as appropriate"; on the printed numbers neither the tile effect nor the interaction meets that condition.
- The host effect is unaffected. Host treatment, F(3,80) = 811.063, has p ≈ 9 × 10-60, consistent with the printed bound. The finding that AB2-treated hosts gave lower settlement, which Table S6 reports as consistent across every tile treatment, is supported by this term. The separate reproductive-output ANOVA, F(3,96) = 812.7, is also internally consistent.
- What changes. If the Table S6 sums of squares are correct, settlement differs by host treatment, but the printed ANOVA gives no evidence for a tile effect or a host × tile interaction. The headline that combined host and benthic disruption acts interactively would then not be supported by the reported test. If instead the p-values are correct, then the F values, mean squares and sums of squares for the tile and interaction terms are all misprinted, and the analysis would need to be reported again. Either way, the printed statistics cannot all be right.
Explanations considered
- The df belong to a different term. Not supported. (12, 80) are exactly the interaction and residual df of the stated 4 × 5 design with n = 5, and Table S6 assigns 12 df to the interaction. Putting F = 0.771 on the host (3,80), tile (4,80) or whole-model (19,80) df gives p between 0.51 and 0.73.
- A lower-tail or one-sided reading. Not able to explain it. The lower-tail p of F = 0.771 on (12,80) is 0.322. No convention for an ANOVA F test gives p < 0.001 for F below 1 on these df.
- A decimal slip in F (for example 7.71, which would give p ≈ 3 × 10⁻⁹). Ruled out by Table S6. The printed F equals MSinteraction / MSresidual = 11000 / 14271 = 0.771, and the mean square equals SS / df = 132002 / 12. The F is the value the table's sums of squares produce, so the p-value is the inconsistent entry.
- A pseudo-F or permutation test. Not applicable. The Methods describe a parametric two-factor ANOVA in the GAD package, and the paper reports PERMANOVA pseudo-F values separately for the community analyses (Tables S1 and S2). In any case, a permutation p-value for a statistic below its null mean would not fall below 0.001.
- The residual mean square. Not able to explain it. The printed residual MS (14271) is SS / 85 rather than SS / 80; correcting it lowers the interaction and tile F values (to 0.725 and 1.541) and raises their p-values (to 0.723 and 0.198).
- A text-conversion or typesetting artifact. Ruled out. The PMC page, the Europe PMC full-text XML (
F<sub>12,80</sub> = 0.771, <italic>p</italic> < 0.001) and the publisher's supplementary file all carry the same values. - A correction already issued. None found (see Status).
- Side observations, not part of the main finding.
- Supplementary Table 5 (reproductive output) prints Sum of Sq 347244 and Mean Sq 11574 for host (SS / 3 = 115748.0) and 143853 and 14243 for the residual (SS / 96 = 1498.5); neither the printed mean-square ratio (0.813) nor the SS-based ratio (77.2) gives the printed F of 812.7. The main-text F(3,96) = 812.7 and its p-value agree with each other.
- Table S6 is captioned as an analysis of the number of zygotes that settled, and Figure 4 states that 200 eggs were added per tile. The largest total sum of squares 100 counts between 0 and 200 can produce is 1,000,000, while the printed host SS is 34,724,483. The table may therefore have been computed on a differently scaled response, such as the predicted number of settled eggs described in the Methods; this cannot be checked without the data, and it does not affect the F-to-p inconsistency.
- The Results cite "table S2" for the host post hoc contrasts; Table S2 is the PERMANOVA of tile communities, and these contrasts appear in Table S6.
Status
- Version of record. The publisher's article page and PDF (royalsocietypublishing.org, reached through doi.org) returned HTTP 403 to automated requests. The published text was checked in three other copies: the live PMC page (Results section 3c), the Europe PMC full-text XML, and the publisher's own supplementary file. All agree with the passages quoted here. Every quotation from the article was checked verbatim against the PMC-archived text with
src/show.py. - Supplements. The electronic supplementary material (Royal Society figshare collection 10.6084/m9.figshare.c.7834312, one file, rspb20250729_si_001.docx, figshare file 54729154, record modified 2026-02-17) was downloaded and parsed; its Table 6 is quoted above and confirms the main-text numbers without resolving the discrepancy. The Dryad dataset doi:10.5061/dryad.1rn8pk13s lists Experiment_3_Response_Variables_200.xlsx, an R script for plots and statistics, and a README, but every file download returned HTTP 401 or 403, so the ANOVA could not be recomputed from raw data.
- Corrections and comments. As of 2026-10-24 I found no correction, erratum, retraction or expression of concern.
src/known.pyreturns no Crossref update relations, no PMC notices and no Europe PMC notices. The Crossref record has no update-to or updated-by fields; its relations list only peer-review items. The PubPeer API returned no record (HTTP 404) for the DOI, and a web search for the title together with "PubPeer" found no thread for this article. - Sources. PMC article PMC12187397; Europe PMC full-text XML for PMC12187397; Royal Society figshare file 54729154 (rspb20250729_si_001.docx); Dryad dataset doi:10.5061/dryad.1rn8pk13s (file listing only); Crossref; Europe PMC; PubPeer; https://doi.org/10.1098/rspb.2025.0729.
Suggested correction
The authors may wish to re-run the two-factor settlement ANOVA from the archived data and report the full table. If the sums of squares in Table S6 are correct, the first Results sentence on settlement would read, for example,
(ANOVA, host × tile F12,80 = 0.771, p = 0.68; host F3,80 = 811.1, p < 0.001; tile F4,80 = 1.64, p = 0.17)
with the P-value column of Table S6 corrected to match (and the residual mean square to SS / 80 = 15163, with F values recomputed from it). The abstract's and Discussion's statements of an "interactive effect" of host- and benthic-associated microbiota on settlement, and the post hoc interpretation of tile and interaction contrasts, would then need to be revised in line with the corrected test. If instead the reported p-values are confirmed, the F values, mean squares and sums of squares for the tile and interaction terms would need correcting. The authors may also wish to check the mean squares and F in Supplementary Table 5 and the "table S2" citation in the settlement Results.