← Back to the plain-language case
Vaccine "prevented fraction" of critical care admissions reported as 144%; the paper's counts give 59%
Lancet Reg Health Am (2025) · doi:10.1016/j.lana.2025.101143 · PMC12173695
Summary
The abstract and the Results report that vaccination prevented "144%" of SARS-CoV-2 critical care admissions in Ontario, citing 22,017 admissions expected without vaccination against 9020 observed. Those two counts imply 12,997 averted admissions. As a share of the 22,017 expected admissions, which is the prevented fraction the Methods say was estimated, that is 59.0%. The 144% is 12,997 ÷ 9020, the excess of the counterfactual over the observed count. A prevented fraction cannot exceed 100%, so the headline figure for the paper's secondary (counterfactual) objective is impossible as worded and overstates the share of admissions prevented. The underlying counts, the forecasting results and the averted-admission count used in the economic analysis are not affected.
What the paper reports
All quotations from the main text were checked verbatim against the PMC-archived article with src/show.py.
Abstract, Summary, Findings:
Averted admissions attributable to vaccination were estimated at 144% (22,017 expected vs. 9020 observed).
Results, last paragraph (p5 in the PMC numbering):
Counterfactual modeling estimated that vaccination prevented 144% of critical care admissions during the study period (22,017 admissions expected vs. 9020 observed). Details of this analysis, along with an economic evaluation of averted admissions, are provided in the Supplementary Appendix.
Methods, "Counterfactual analysis":
We used our models to estimate the prevented fraction of SARS-CoV-2 critical care attributable to vaccination by generating model predictions with the coefficient for vaccination set to zero, as described by Zhou.19 Prevented fraction was obtained by comparing model predicted critical care admissions with and without vaccination.
Discussion, fifth paragraph:
we find that if vaccination was indeed driving the decline in per-case critical care risk, Ontario's universal SARS-CoV-2 vaccination program effectively paid for itself, simply through prevention of critical care-related resource use.
Supplementary Appendix (mmc1.pdf), "Counterfactual Estimates of Vaccine Impact", p. 9 (text extracted from the PDF):
Over the period from March 2020 to August 2022, we estimated that vaccination prevented approximately 12,977 admissions, representing a prevented fraction of 144% (22,017 expected vs. 9,020 observed).
Supplementary Figure 11 caption, p. 22: "vaccination was estimated to have prevented 12,977 critical care unit admissions, representing a prevented fraction of 144%." Supplementary Table 5, p. 30: "Critical care admissions averted 12997". The Appendix's length-of-stay section (p. 7) states that "A total of 9,020 individuals met our criteria for critical care receipt", which identifies 9,020 as the observed total. The French, Portuguese and Spanish abstracts (mmc2 to mmc4) give the same 144% with 22 017 and 9 020.
What the paper's own numbers show
Method. I took the two counts printed beside the percentage (22,017 expected without vaccination, 9020 observed) and computed the averted admissions, the prevented fraction (averted ÷ expected) and the other ratios that can be formed from the two counts. I then checked which of them reproduces 144%, and cross-checked the averted count against the Supplementary Appendix. Every number below is printed by recompute.py.txt.
| Quantity | Location | Reported | Recomputed from the paper's own numbers |
|---|---|---|---|
| Expected admissions without vaccination, E | Abstract; Results p5 | 22,017 | input |
| Observed admissions, O | Abstract; Results p5; Appendix p. 7 | 9020 | input |
| Averted admissions, E − O | Appendix Table 5; Appendix p. 9 and Suppl. Fig. 11 | 12997 (Table 5); 12,977 (text, caption) | 12,997 |
| Share of admissions prevented (prevented fraction), (E − O) ÷ E | Abstract; Results p5; Appendix | 144% | 59.0% (12,997 ÷ 22,017 = 0.5903) |
| Relative excess of counterfactual over observed, (E − O) ÷ O | not stated as such | — | 144.1% (12,997 ÷ 9020 = 1.4409), the only ratio that gives 144% |
| Ratio E ÷ O | not stated | — | 2.44 |
| Observed count implied by a 144% prevented fraction, E × (1 − 1.44) | — | — | −9,687 (impossible) |
Only one of the ratios that can be formed from the two counts gives 144%: averted admissions divided by observed admissions. That is the relative excess: without vaccination, admissions would have been 144% higher than observed, or 2.44 times as many. The Methods define the quantity as a prevented fraction, and the Abstract and Results describe it as a share of admissions averted or prevented. That share has the counterfactual total as its denominator and is 59.0%. For a prevented fraction of 144%, observed admissions would have to be negative (−9,687).
Figure
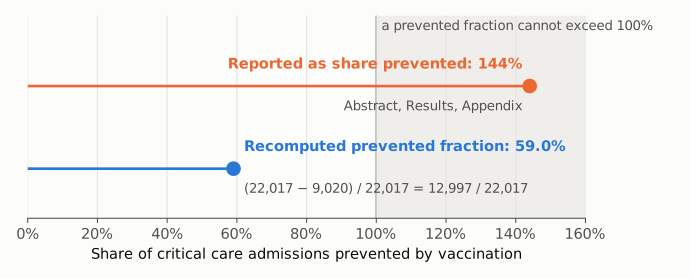
Figure 1. Share of critical care admissions prevented by vaccination. Orange: the value reported in the Abstract, Results and Supplementary Appendix (144%). Blue: the prevented fraction recomputed from the counts printed beside it, (22,017 − 9,020) ÷ 22,017 = 59.0%. The shaded region beyond 100% cannot be reached by a prevented fraction. The axis starts at zero.
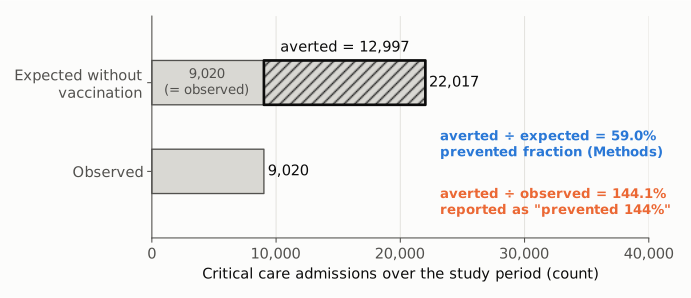
Figure 2. The two counts reported by the paper, on a linear scale from zero. The hatched segment is the 12,997 admissions averted (expected minus observed). Dividing it by the expected total gives the prevented fraction, 59.0% (blue). Dividing it by the observed total gives 144.1% (orange), the figure the paper reports as the share prevented.
Why it matters
- A headline number is impossible as worded. The 144% appears in the abstract Findings and in the Results, and is repeated in the Supplementary Appendix and the three translated abstracts. A reader who takes it at face value reads a share of admissions prevented that is about 2.4 times the correct 59%. A journal-news summary published in June 2025 already reported the result as "an estimated 144% reduction attributable to vaccination".
- The finding concerns a secondary objective. The counterfactual estimate is not part of the forecasting validation that is the paper's main aim. The model calibration and predictive validity (ρ = 0.85, 0.46, 0.60 and 0.68), the likelihood-ratio test for the vaccination term (p = 0.013), the point scores, the occupancy projections and the Interpretation are unaffected.
- The direction and the counts survive. The counts 22,017 and 9020 are printed next to the percentage, so the correct value can be recovered. Supplementary Table 5 uses 12,997 averted admissions, which equals 22,017 − 9,020. The economic estimates (about $2.9 billion CAD averted in the base case) and the Discussion's statement that the programme "effectively paid for itself" rest on that count, not on the percentage. Corrected, the result is still large: vaccination prevented about three in five of the admissions expected without it.
Explanations considered
- A different definition of the percentage. Not supported. The only definition in the paper is the Methods' "prevented fraction", obtained "by comparing model predicted critical care admissions with and without vaccination" and citing Zhou. A prevented fraction is (expected − observed) ÷ expected and is bounded by 100%. No footnote, legend or supplement defines the 144% differently; the Appendix also calls it "a prevented fraction of 144%".
- A correctly computed relative excess, described in other words. This explains the number but not the wording. (22,017 − 9,020) ÷ 9,020 = 144.1%, so "admissions would have been 144% higher without vaccination" would be correct. The Abstract instead calls it a percentage of "averted admissions", and the Results say vaccination "prevented 144% of critical care admissions". Both describe a share of admissions, which cannot exceed 100%.
- Model-predicted rather than observed admissions as the base. Not able to explain it. The Methods compare model predictions with and without vaccination, while the text quotes the observed total (9020). Whichever with-vaccination total is used, the share of counterfactual admissions prevented lies between 0% and 100%. A model-predicted total close to the observed 9020 gives a value near 59%.
- Different populations, periods or units for the two counts. Not supported. Both are counts of critical care admissions in Ontario over the same study period, and they are given together in the same parenthesis. The Appendix dates the counterfactual to March 2020 to August 2022, while the main text gives the study period as March 2020 to September 2022. That small difference cannot turn a share into 144%.
- A conversion or typesetting artifact. Ruled out. The same 144% appears in the PMC and Europe PMC text (the publisher's JATS deposit), in the typeset Appendix PDF, and in the three translated abstracts, each time next to 22,017 and 9,020.
- A correction already issued. None found (see Status).
- Side observations, not part of the main finding. (1) The Appendix text and the Supplementary Figure 11 caption give 12,977 averted admissions, while Supplementary Table 5 and 22,017 − 9,020 give 12,997, a difference of 20. (2) Supplementary Table 5 lists a critical care case fatality of 35.4% and 4549 deaths averted. 12,997 × 0.354 = 4,601, whereas 4549 equals 12,997 × 0.350. Neither difference affects the main finding.
Status
- Version of record. The publisher's pages (doi.org redirect to linkinghub.elsevier.com, thelancet.com and sciencedirect.com) returned only a redirect stub or HTTP 403 to automated requests. I checked the publisher-supplied full text in two archived copies: the PMC article page and the Europe PMC full-text XML, which is the publisher's JATS deposit. Both carry the Abstract and Results sentences quoted above. Every main-text quotation was checked verbatim against the PMC-archived text with
src/show.py. - Supplements. I downloaded the Europe PMC supplementary bundle for PMC12173695: mmc1.pdf (Supplementary Appendix, 35 pages), mmc2.docx, mmc3.docx and mmc4.docx (French, Portuguese and Spanish abstracts), and figure files gr1 to gr4. The Appendix repeats "a prevented fraction of 144% (22,017 expected vs. 9,020 observed)" and gives no other definition, so it confirms rather than resolves the discrepancy. The translated abstracts give the same 144%.
- Corrections and comments. As of 2026-10-24 I found no correction, erratum, retraction or expression of concern.
src/known.pyreturns no Crossref update relations, no PMC notices and no Europe PMC notices, and the Crossref record has empty update-to and updated-by fields. The PubPeer API returned no record (HTTP 404) for the DOI, the PubPeer search page refused automated access (HTTP 403), and a web search for the title together with "PubPeer", "correction" or "erratum" found no thread or notice. The medRxiv preprint (doi:10.1101/2025.01.21.25320912) could not be opened (HTTP 403) and was not checked. - Sources. PMC article PMC12173695; Europe PMC full-text XML and supplementary files for PMC12173695; Crossref; Europe PMC; PubPeer; EMJ news item "Updated Score Improves Prediction of COVID-19 Critical Care Demand" (emjreviews.com, June 2025); https://doi.org/10.1016/j.lana.2025.101143.
Suggested correction
In the Abstract (Findings), replace
Averted admissions attributable to vaccination were estimated at 144% (22,017 expected vs. 9020 observed).
with
Vaccination was estimated to have averted 12,997 critical care admissions, a prevented fraction of 59% (22,017 expected without vaccination vs. 9020 observed).
In the Results (last paragraph), replace "vaccination prevented 144% of critical care admissions" with "vaccination prevented 59% of the critical care admissions expected without vaccination (12,997 averted)". In the Supplementary Appendix (p. 9 and the Supplementary Figure 11 caption), change "a prevented fraction of 144%" to "a prevented fraction of 59%", and make the translated abstracts match. If the authors prefer to keep the 144% figure, it can be stated as a relative excess: "without vaccination, critical care admissions would have been an estimated 144% higher (2.4 times as many)". The authors may also wish to reconcile the averted count in the Appendix text and the Figure 11 caption (12,977) with Supplementary Table 5 (12,997), and the 35.4% case fatality with the 4549 deaths averted shown in the same table.